HAL Id: hal-01578419
https://hal.archives-ouvertes.fr/hal-01578419
Submitted on 29 Aug 2017
HAL is a multi-disciplinary open access
archive for the deposit and dissemination of
sci-entific research documents, whether they are
pub-lished or not. The documents may come from
teaching and research institutions in France or
abroad, or from public or private research centers.
L’archive ouverte pluridisciplinaire HAL, est
destinée au dépôt et à la diffusion de documents
scientifiques de niveau recherche, publiés ou non,
émanant des établissements d’enseignement et de
recherche français ou étrangers, des laboratoires
publics ou privés.
disease.
Jérémy Guillon, Yohan Attal, Valentina La Corte, Olivier Colliot, Bruno
Dubois, Denis P Schwartz, Mario Chavez, Fabrizio de Vico Fallani
To cite this version:
Jérémy Guillon, Yohan Attal, Valentina La Corte, Olivier Colliot, Bruno Dubois, et al.. Loss of brain
inter-frequency hubs in Alzheimer’s disease.. Scientific Reports, Nature Publishing Group, 2017, 7
(1), pp.10879. �10.1038/s41598-017-07846-w�. �hal-01578419�
Loss of brain inter-frequency hubs
in Alzheimer's disease
J. Guillon
1,2, Y. Attal
3, O. Colliot
1,2, V. La Corte
5,6, B. Dubois
4, D. Schwartz
2, M. Chavez
2& F. De
Vico Fallani
1,2Alzheimer’s disease (AD) causes alterations of brain network structure and function. The latter consists of connectivity changes between oscillatory processes at different frequency channels. We proposed a multi-layer network approach to analyze multiple-frequency brain networks inferred from magnetoencephalographic recordings during resting-states in AD subjects and age-matched controls. Main results showed that brain networks tend to facilitate information propagation across different frequencies, as measured by the multi-participation coefficient (MPC). However, regional connectivity in AD subjects was abnormally distributed across frequency bands as compared to controls, causing significant decreases of MPC. This effect was mainly localized in association areas and in the cingulate cortex, which acted, in the healthy group, as a true inter-frequency hub. MPC values significantly correlated with memory impairment of AD subjects, as measured by the total recall score. Most predictive regions belonged to components of the default-mode network that are typically affected by atrophy, metabolism disruption and amyloid-β deposition. We evaluated the diagnostic power of the
MPC and we showed that it led to increased classification accuracy (78.39%) and sensitivity (91.11%).
These findings shed new light on the brain functional alterations underlying AD and provide analytical tools for identifying multi-frequency neural mechanisms of brain diseases.
Recent advances in network science has allowed new insights in the brain organization from a system perspective. Characterizing brain networks, or connectomes, estimated from neuroimaging data as graphs of connected nodes has not only pointed out important network features of brain functioning - such as small-worldness, modularity, and regional centrality - but it has also led to the development of biomarkers quantifying reorganizational mech-anisms of disease1. Among others, Alzheimer’s disease (AD), which causes progressive cognitive and functional impairment, has received great attention by the network neuroscience community1–3. AD is histopathologically defined by the presence of amyloid-β plaques and tau-related neurofibrillary tangles, which cause loss of neurons and synapses in the cerebral cortex and in certain subcortical regions2. This loss results in gross atrophy of the affected regions, including degeneration in the temporal and parietal lobe, and parts of the frontal cortex and cingulate gyrus4.
Structural brain networks, whose connections correspond to inter-regional axonal pathways are therefore directly affected by AD because of connectivity disruption in several areas including cingulate cortices and hippocampus5, 6. A decreased number of fiber connections eventually lead to a number of network changes on multiple topological scales. At larger scales, AD brain networks estimated from diffusion tensor imaging (DTI) showed increased characteristic path length as compared to healthy subjects leading to a global loss of network small-worldness2, 7. Similar topological alterations have been also documented in resting-state brain networks estimated from functional magnetic resonance imaging (fMRI)8, as well as from magneto/electroencephalo-graphic (M/EEG) signals, the latter ones often reported within the alpha frequency range (8–13 Hz) which is typically affected in AD9–11. On smaller topological scales, structural brain network studies have demonstrated a loss of connector hubs in temporal and parietal areas that correlates with cognitive decline2, 12, 13. In addition, higher-order association regions appear to be affected in functional brain networks inferred from fMRI2, 14 and MEG signals, the latter showing a characteristic loss of parietal hubs in higher (>14 Hz) frequency ranges15, 16. 1Inria Paris, Aramis project-team, 75013, Paris, France. 2CNRS UMR-7225, Sorbonne Universites, UPMC Univ Paris 06, Inserm U-1127, Institut du cerveau et la moelle (ICM), Hopital Pitie-Salpetriere, 75013, Paris, France. 3MyBrain Technologies, Paris, France. 4Department of Neurology, Institut de la Memoire et de la Maladie dAlzheimer - IM2A, Paris, France. 5Institute of Psychology, University Paris Descartes, Sorbonne Paris Cite, France. 6INSERM UMR 894, Center of Psychiatry and Neurosciences, Memory and Cognition Laboratory, Paris, France. Correspondence and requests for materials should be addressed to F.D. (email: fabrizio.devicofallani@gmail.com)
Received: 28 March 2017 Accepted: 29 June 2017 Published: xx xx xxxx
Graph analysis of brain networks has advanced our understanding of the organizational mechanisms under-lying human cognition and disease, but a certain number of issues still remain to be addressed17, 18. For example, conventional approaches analyze separately brain networks obtained at different frequency bands, or in some cases, they simply focus on specific frequencies, thus neglecting possible insights of other spectral contents on brain functioning17. However, several studies have hypothesized and reported signal interaction or modulations between different frequency bands that are supportive of cognitive functions such as memory formation19–21. Moreover, recent evidence shows that neurodegenerative processes in AD do alter functional connectivity in different frequency bands16, 22, 23. How to characterize this multiple information from a network perspective still remains poorly explored. Here, we proposed a multi-layer network approach to study multi-frequency connec-tomes, where each layer contains the brain network extracted at different bands. Multi-layer network theory has been previously used to synthesize MEG connectomes from a whole population24, characterize temporal changes in dynamic fMRI brain networks12, and integrating structural information from multimodal imaging (fMRI, DTI)25, 26. Its applicability to multi-frequency brain networks has been recently illustrated in fMRI connectomes for which, however, the frequency ranges of interest remains quite limited27.
We focused on source-reconstructed MEG connectomes, characterized by rich frequency dynamics, that were obtained from a group of AD and control subjects in eyes-closed resting-state condition. We hypothesized that the atrophy process in AD would lead to an altered distribution of regional connectivity across different frequency bands and we used the multi-participation coefficient to quantify this effect both at global and local scale28. We evaluated the obtained results, which provide a novel view of the brain reorganization in AD, with respect to standard approaches based on single-layer network analysis and flattening schemes29. Finally, we tested the diag-nostic power of the measured brain network features to discriminate AD patients and healthy subjects.
Methods
Experimental design and data pre-processing.
The study involved 25 Alzheimer’s diseased (AD)patients (13 women) and 25 healthy age-matched control (HC) subjects (18 women). All participants underwent the Mini-Mental State Examination (MMSE) for global cognition30 and the Free and Cued Selective Reminding Test (FCSRT) for verbal episodic memory31–33. Specifically, we considered the Total Recall (TR) score - given by the sum of the free and cued recall scores - which has been demonstrated to be highly predictive of AD34 (Table 1).
Inclusion criteria for all participants were: i) age between 50 and 90; ii) absence of general evolutive pathology;
iii) no previous history of psychiatric diseases; iv) no contraindication to MRI examination; v) French as a mother
tongue. Specific criteria for AD patients were: i) clinical diagnosis of Alzheimer’s disease; ii) Mini-Mental State Examination (MMSE) score greater or equal to 18. Magnetic resonance imaging (MRI) acquisitions were obtained using a 3T system (Siemens Trio, 32-channel system, with a 12-channel head coil). The MRI examination included a 3D T1-weighted volumetric magnetization-prepared rapid-gradient echo (MPRAGE) sequence with 1 mm iso-tropic resolution and the following parameters: repetition time (TR) = 2300 ms, echo time (TE) = 4.18 ms, inver-sion time (TI) = 900 ms, matrix = 256 × 256. This sequence provided a high contrast-to-noise ratio and enabled excellent segmentation of high grey/white matter.
The magnetoencephalography (MEG) experimental protocol consisted in a resting-state with eyes-closed (EC). Subjects seated comfortably in a dimly lit electromagnetically and acoustically shielded room and were asked to relax. MEG signals were collected using a whole-head MEG system with 102 magnetometers and 204 planar gradiometers (Elekta Neuromag TRIUX MEG system) at a sampling rate of 1000 Hz and on-line low-pass filtered at 330 Hz. The ground electrode was located on the right shoulder blade. An electrocardiogram (EKG) Ag/ AgCl electrodes was placed on the left abdomen for artifacts correction and a vertical electrooculogram (EOG) was simultaneously recorded. Four small coils were attached to the participant in order to monitor head position and to provide co-registration with the anatomical MRI. The physical landmarks (the nasion, the left and right pre-auricular points) were digitized using a Polhemus Fastrak digitizer (Polhemus, Colchester, VT).
We recorded three consecutive epochs of approximately 2 minutes each. All subjects gave written informed consent for participation in the study, which was approved by the local ethics committee of the Pitie-Salpetriere Hospital. All experiments were performed in accordance with relevant guidelines and regulation. Signal space separation was performed using MaxFilter35 to remove external noise. We used in-house software to remove cardiac and ocular blink artifacts from MEG signals by means of principal component analysis. We visually inspected the preprocessed MEG signals in order to remove epochs that still presented spurious contamination. At the end of the process, we obtained a coherent dataset consisting of three clean preprocessed epochs for each subject.
Control (HC) Alzheimer (AD) p-value
Age 70.8 (9.1) 73.5 (9.4) 0.3142 MMSE 28.2 (1.4) 23.2 (3.6) <10−5
FR 31.5 (6.6) 14.9 (6.5) <10−5
TR 46.3 (1.5) 33.9 (10.0) <10−5
Table 1. Characteristics, cognitive and memory scores of experimental subjects. Mean values and standard
deviations (between parentheses) are reported. The last column shows the p-values returned by a non-parametric permutation t-tests with 10000 realizations. MMSE = mini-mental state examination score; TR = total recall memory test score (/48); FR = free recall memory test (/48).
Source reconstruction, power spectra and brain connectivity.
We reconstructed the MEG activity on the cortical surface by using a source imaging technique36, 37. We used the FreeSurfer 5.3 software (surfer.nmr. mgh.harvard.edu) to perform skull stripping and segment grey/white matter from the 3D T1-weighted images of each single subject38, 39. Cortical surfaces were then modeled with approximately 20000 equivalent current dipoles (i.e., the vertices of the cortical meshes). We used the Brainstorm software40 to solve the linear inverse problem through the wMNE (weighted Minimum Norm Estimate) algorithm with overlapping spheres41. Both magneto-meter and gradiomagneto-meter, whose position has been registered on the T1 image using the digitized head points, were used to localize the activity over the cortical surface. The reconstructed time series were then averaged within 148 regions of interest (ROIs) defined by the Destrieux atlas42.We computed the power spectral density (PSD) of the ROI signals by means of the Welch’s method; we chose a 2 seconds sliding Hanning window, with a 25% overlap. The number of FFT points was set to 2000 for a frequency resolution of 0.5 Hz. We estimated functional connectivity by calculating the spectral coherence (Supplementary Text) between each pair of ROI signals43. As a result, we obtained for each subject and epoch, a set of connectivity matrices of size 148 × 148 where the (i, j) entry contains the value of the spectral coherence between the signals of the ROI i and j at a frequency f = 0,0.5, …, 499.
We then averaged the connectivity matrices within the following characteristic frequency bands44, 45: delta (2–4 Hz), theta (4.5–7.5 Hz), alpha1 (8–10.5 Hz), alpha2 (11–13 Hz), beta1 (13.5–20 Hz), beta2 (20.5–29.5 Hz) and gamma (30–45 Hz). We finally averaged the connectivity matrices across the three available epochs to obtain a robust estimate of the individual brain networks whose nodes were the ROIs (n = 148) and links, or edges, were the spectral coherence values.
Single-layer network analysis.
In order to cancel the weakest noisy connections, we thresholded and binarized the values in the connectivity matrices. Specifically, we retained the same number of links for each brain network. We considered six representative connection density thresholds corresponding to an average node degree k = {1, 3, 6, 12, 24, 48}. These values cover the density range [0.007, 0.327] which contains the typical den-sity values used in complex brain network analysis17, 18, 46. The resulting sparse brain networks, or graphs, were represented by adjacency matrices A, where the aij entry indicates the presence or absence of a link between nodesi and j.
Participation coefficient. Given a network partition, the local participation coefficient (PCi) of a node i measures
how evenly it is connected to the different clusters, or modules of the network47. Nodes with high participation coefficients are considered as central hubs as they allow for information exchange among different modules. The global participation coefficient PC of a network at layer λ is then given by the average of the PCi values:
∑
∑
∑
= = − λ λ λ λ = = = λ PC n PC n k k 1 1 1 , (1) i N i i N m M i m i [ ] 1 [ ] 1 1 , [ ] [ ] 2 [ ] where kλi m[ ], is the number of links from the node i to the nodes of the module m in layer λ and ki[ ]λ is the degree of
node i in layer λ. By construction, PC ranges from 0 to 1. Here, the partition of the networks into modules was obtained by maximizing the modularity function48.
Flattened networks. We also computed the participation coefficients for brain networks obtained by flattening
the frequency layers into a single overlapping or aggregated network28. In an overlapping network, the weight of an edge oij corresponds to the number of times that the nodes i and j are connected across layers:
∑
= λ λ o a , (2) ij ij[ ]In an aggregated network, the existence of an edge indicates that nodes i and j are connected in at least one layer: λ = ∃ λ ≠ a 1 if :a 0 0 otherwise , (3) ij ij [ ]
Notice that, by construction, flattened networks do not preserve the original connection density of the single layer networks.
Multi-layer network analysis.
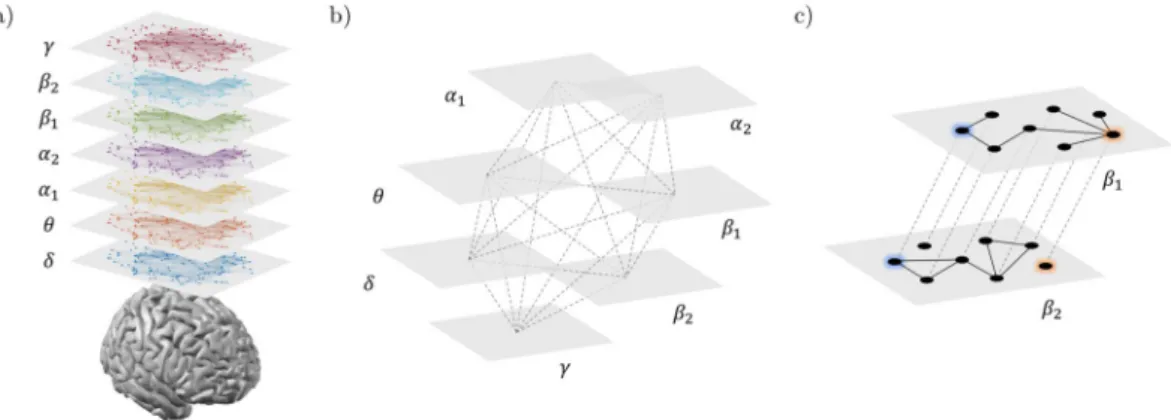
We adopted a multi-layer network approach to integrate the information from brain networks at different frequency bands, while preserving their original structure. Specifically, we built for each subject a multiplex network (Fig. 1a,b) where the different layers correspond to different frequency bands and each node in one layer is virtually connected to all its counterparts in the other layers28, 29.Without loss of generality, the resulting supra-adjacency matrix A is given by the intra-layer adjacency matri-ces on the main diagonal:
={A A A[ ]δ, [ ]θ, [ ]α1,A[ ]α2,A[ ]β1,A[ ]β2,A[ ]γ}, (4)
where A[λ] corresponds to the brain network at the frequency λ. Notice that inter-layer adjacency matrices of multiplexes are intrinsically defined as identity matrices49, 50.
Multi-participation coefficient. We considered the local multi-participation coefficient MPCi, as an akin version of the local participation coefficient PCi, to measure how evenly a node i is connected to the different layers of the multiplex28. This way, nodes with high MPC
i are considered central hubs as they would allow for a better infor-mation exchange among different layers. The global multi-participation coefficient is then given by the average of the MPCi values:
∑
∑
∑
= = − − λ λ = = MPC n MPC n M M NLP 1 1 11 ( ) , (5) i N i i N i 1 1 [ ] 2where NLPi[ ]λ =ki[ ]λ/oi stands for node-degree layer proportion, which measures the tendency of the connectivity
of a node i to concentrate in layer λ. By construction, if nodes tend to concentrate their connectivity in one layer, the global multi-participation coefficient tends to 0; on the contrary, if nodes tend to have the same number of connections in every layer, the MPC value tends to 1 (Fig. 1c). In the singular case where a node is disconnected in every layer, we assigned MPCi = 0 to avoid indeterminate results.
From a statistical perspective, a random walker reaching a node with low MPCi will jump with higher proba-bility to layers where the node degree is higher, while it will tend to avoid layers with lower node degrees. On the contrary, if MPCi is high, the random walker can jump with similar probability to any other layer, and this would facilitate the information passing (or communication) across all the layers.
We further used the standard coefficient of variation CVi to measure the dispersion of the degree of a node i across layers. A global coefficient of variation CV is then obtained by averaging the CVi values across all the nodes (Supplementary Text).
Statistical analysis.
We first analyzed network features on global topological scales in order to detect sta-tistical differences between AD and HC subjects at the whole system level. Only for the network features that resulted significantly different at the global scale, we also assessed possible group-differences at the local scale of single nodes. This hierarchical approach allowed us to associate brain network differences at multiple topological scales51. We used a non-parametric permutation t-test, to assess statistical differences between groups, with a sig-nificance level of 0.0552, 53. The permutation test generated a set of 10000 surrogate data by randomly exchanging the group labels (i.e., AD or HC) of the brain network features. The t-statistic and p-value were then extracted from the simulated distributions. At the local scale, we performed a permutation test for each node separately. Due to the large number of tests (i.e., 148), we applied a correction for multiple comparisons by computing an adjusted version of the false discovery rate (FDR)54.To test the ability of the significant brain network features to predict the cognitive/memory impairment of AD patients, we used the non-parametric Spearman’s correlation coefficient R. We set a significance level of 0.05 for the correlation of global network features, with a FDR correction in the case of multiple comparisons (local features).
Classification.
We used a classification approach to evaluate the discriminating power of the local brain net-work features which resulted significantly different in the AD and HC group. Because we did not know in advance which were the most discriminating features, we tested different combinations. In particular, for each local net-work feature, we first ranked the respective ROIs according to the p-values returned by the between-group sta-tistical analysis (see previous section). For each subject s, we then tested different feature vectors obtained by concatenating, one-by-one, the values of the network features extracted from the ranked ROIs. The generic fea-ture vector cs reads:Figure 1. Multi-frequency brain networks. Panel (a) shows brain networks of a representative subject extracted
from seven frequency bands. Links are inferred by means of spectral coherence and thresholded to have in each layer an average node degree k = 12. (b) Procedure to construct a multi-frequency network. Each layer corresponds to a different frequency band. Only nodes representing the same brain region in each layer are virtually connected. Hence, inter-layer links code for identity relationships. (c) Inter-frequency node centrality. A two-layer multiplex is considered for the sake of simplicity. The blue node acts as an inter-frequency hub (i.e., multi-participation coefficient MPC = 1) as it allows for a balanced information transfer between layer β1 and
= …
cs [ ,g1 , ]gk (6)
where gk is a generic local network feature and k is a rank that ranges from 1 (the most significant ROI) to the total number of significant ROIs. When different network features were considered (e.g., PC and MPC), we concate-nated the respective cs feature vectors allowing for all the possible combinations.
To quantify the separation between the feature vectors of AD and HC subjects, we used a Mahalanobis dis-tance classifier. We applied a repeated 5-folds cross-validation procedure where we randomly split the entire dataset into a training set (80%) and a testing test (20%). This procedure was eventually iterated 10000 times in order to obtain more accurate classification rates. To assess the classification performance we computed the sensi-tivity (Sens), specificity (Spec) and accuracy (Acc), defined respectively as the percentage of AD subjects correctly classified as AD, the percentage of HC subjects classified as HC and the total percentage of subjects (AD and HC) properly classified. We also computed the receiver operating characteristic (ROC) curve and its area under the curve (AUC)55.
Data availability.
The Matlab code for the manipulation of multi-layer networks and the computation of the MPC, together with the connectivity matrices generated and analyzed in this study, are available at the Brain Network Toolbox repository (https://github.com/brain-network/bnt).Results
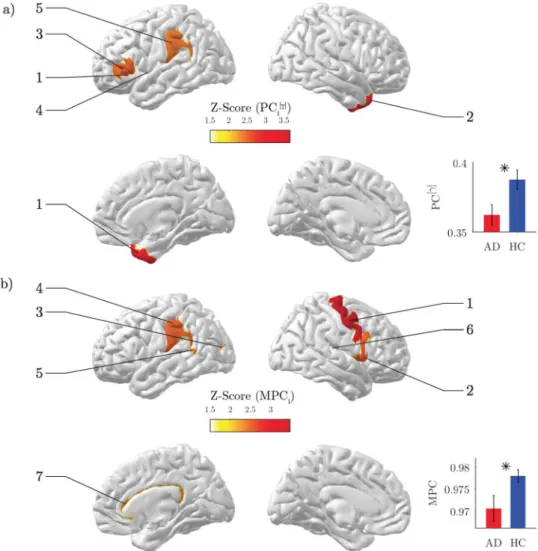
Power analysis of source-reconstructed MEG signals confirmed the characteristic changes in the oscillatory activ-ity of AD subjects compared to HC subjects (Fig. 2a)56–59. Significant alpha power decreases were more evident in the parietal and occipital regions (Z < −2.58), while significant delta power increases (Z > 2.58) were more localized in the frontal regions of the cortex (Fig. 2b).
Reduced gamma inter-modular connectivity.
As expected, the value of the connection density thresh-old had an impact on the network differences between groups. We selected the first threshthresh-old for which we could observe a significant group difference for both single- and multi-layer analysis. The obtained results determined the choice of a representative threshold, common to all the brain networks, corresponding to an average node degree k = 12 (Fig. S1).We first evaluated the results from the single-layer analysis. By inspecting the global participation coefficient
PC, we reported in the gamma band a significant decrease of inter-modular connectivity in AD as compared to
HC (Z = −2.50, p = 0.017; Fig. 3a inset). This behavior was locally identified in association ROIs including tem-poral and parietal areas (p < 0.05, FDR corrected; Fig. 3a; Table 2). No other significant differences were reported in other frequency bands or in flattened brain networks (Fig. S1).
Disrupted inter-frequency hub centrality.
Then we assessed the results from the multi-layer analysis. Both AD and HC subjects exhibited high global multi-participation coefficients (MPC > 0.9), suggesting a gen-eral propensity of brain regions to promote interactions across frequency bands. However, such tendency was significantly lower in AD than HC subjects (Z = −2.24, p = 0.028; Fig. 3b inset). This loss of inter-frequency centrality was prevalent in association ROIs including temporal, parietal and cingulate areas, and with a minor extent in motor areas (p < 0.05, FDR corrected; Fig. 3b; Table 2).Among those regions, the right cingulate cortex was classified as the main inter-frequency hub as revealed by the spatial distribution of the top 25% MPC values in the HC group (Fig. 4a). In HC subjects the connec-tivity of this region across bands, as measured by the node degree layer proportion NLP, was relatively stable (Kruskal-Wallis test, χ2 = 10.79, p = 0.095), while it was significantly altered in AD subjects (Kruskall-Wallis test, χ2 = 14.98, p = 0.020). In particular, the AD group exhibited a remarkably reduced alpha
2 connectivity
Figure 2. Spectral analysis of MEG signals. (a) Power spectrum density (PSD) for a representative occipital
sensor before source reconstruction. Each line corresponds to a subject. Bold lines show the group-averaged values in the Alzheimer’s disease group (AD) and in the healthy control group (HC). (b) Statistical PSD group differences. Z-scores are obtained using a non-parametric permutation t-test. Results are represented both as sensor and source space.
Figure 3. Network analysis of brain connectivity. (a) Inter-modular centrality. Statistical brain maps of group
differences for local participation coefficients PCi in the gamma band. Only significant differences are illustrated (p < 0.05, FDR corrected). The labels same ranks are used as labels. The inset shows the results for the global
PC; vertical bars stand for group-averaged values while error bars denote standard error means. In both cases,
Z-scores are computed using a non-parametric permutation t-test. b) Inter-frequency centrality. Statistical brain maps of group differences for local multi-participation coefficients MPCi. The inset shows the results for the global MPC; same conventions as in (a).
Feature Rank ROI label Cortex Z score p-value
γ PCi[ ] 1 Lat_Fis-ant-Horizont L Frontal −3.6507 0.0007 2 Pole_temporal R Temporal −2.8642 0.0063 3 G_front_inf-Triangul L Frontal −2.4562 0.0198 4 S_temporal_transverse L Temporal −2.3887 0.0207 5 G_pariet_inf-Supramar L Parietal −2.3820 0.0222 MPCi 1 G_precentral R Motor −3.4735 0.0006 2 G_front_inf-Opercular R Motor −2.5239 0.0127 3 S_oc_middle_and_Lunatus L Occipital −2.4582 0.0138 4 G_pariet_inf-Supramar L Parietal −2.4860 0.0142 5 S_interm_prim-Jensen L Parietal −2.3708 0.0147 6 S_temporal_transverse R Temporal −2.3996 0.0191 7 S_pericallosal R Limbic −2.3041 0.0203
Table 2. Statistical group differences for local brain network features. ROI labels, abbreviated according to the
Destrieux atlas, are ranked according to the resulting p-values. The same ranks are used as labels in Fig. 3. ROIs highlighted in bold belong to the default mode network (DMN).
and increased theta connectivity (Fig. 4b). Similar results were also reported for the left cingulate cortex (AD:
χ2 = 11.89, p = 0.064; HC: χ2 = 6.98, p = 0.323), although it was not significant in terms of MPC differences (Fig. 3b; Table 2).
Diagnostic power of brain network features.
We adopted a classification approach to evaluate the power of the most significant local network properties in determining the state (i.e., healthy or diseased) of each individual subject. The best results were achieved neither when we considered single-layer features (i.e., PCγi[ ]) nor
when we considered multi-layer features (MPCi) (respectively, first column and row of panels in Fig. 5a). Instead, a combination of the two most significant features gave the best classification in terms of accuracy (Acc = 78.39%) and area under the curve (AUC = 0.8625) (Fig. 5a,b). While the corresponding specificity was not particularly high (Spec = 65.68%), the sensitivity was remarkably elevated (Sens = 91.11%).
Relationship with cognitive and memory impairment.
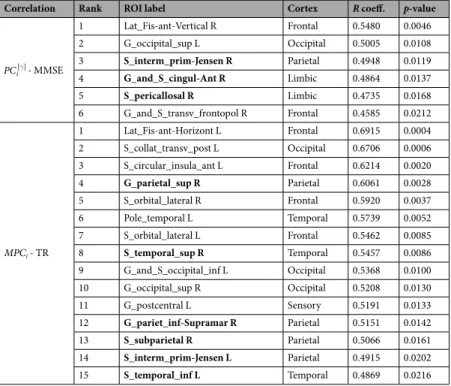
We finally evaluated the ability of the signifi-cant brain network changes to predict the cognitive and memory performance of AD subjects. We first considered the results from single-layer analysis. We found a significant positive correlation between the global participation coefficient PC in the gamma band and the MMSE score (R = 0.4909, p = 0.0127; Fig. 6a). Then we considered the results from multi-layer analysis. We reported a higher significant positive correlation between the global multi-participation coefficient MPC and the TR score (R = 0.5547, p = 0.0074; Fig. 6c). These relationships were locally identified in specific ROIs including parietal, temporal and cingulate areas of the default mode network (DMN)60 (p < 0.05, FDR corrected; Fig. 6b,d; Table 3).Discussion
Graph analysis of brain networks have been largely exploited in the study of AD with the aim to extract new predictive diagnostics of disease progression. Typical approaches in functional neuroimaging, characterized by oscillatory dynamics, analyze brain networks separately at different frequencies thus neglecting the available mul-tivariate spectral information. Here, we adopted a method to formally take into account the topological infor-mation of multi-frequency connectomes obtained from source-reconstructed MEG signals in a group of AD and healthy subjects during EC resting states.
Main results showed that, while flattening networks of different frequency bands attenuates differ-ences between AD and HC populations, keeping the multiplex nature of MEG connectomes allow to capture higher-order discriminant information. AD subjects exhibited an aberrant multiplex brain network structure
Figure 4. Inter-frequency hub centrality distribution. (a) The median values of local multi-participation
coefficients (MPCi) are shown over the cortical surface for the healthy group. Only the top 25% is illustrated for the sake of visualization. The corresponding list of ROIs is illustrated in the horizontal bar plot. (b) Group-median values of the node-degree layer proportion (NLPi) for the right and left cingulate cortex. The grey line corresponds to the expected value if connectivity were equally distributed across frequency bands (NLPi = 1/7).
Figure 5. Classification performance of brain network features. (a) Matrices show the classification rates
(accuracy = Acc, specificity = Spec, sensitivity = Sens, area under the curve = AUC) corresponding to the combination of the most significant PCγ
i[ ] and MPCi network features, respectively on the rows and columns of
each matrix. Black squares highlight the highest accuracy rate and the corresponding specificity, sensitivity and AUC. (b) Scatter plots show the Mahalanobis distance of each subject from the AD and HC classes. Separation lines (y = x: equal distances) are drawn in grey. Red circles stand for Alzheimer’s disease (AD) subjects, blue ones for healthy controls (HC). The bottom right plot shows the ROC curve associated with the best network features configuration. The optimal point is marked by a green circle.
Figure 6. Correlation between brain network properties and cognitive/memory scores. (a) Scatter plot of the
global participation coefficient in the gamma band (PC[γ]) and the mini-mental state examination (MMSE) score of AD subjects (Spearman’s correlation R = 0.4909, p = 0.0127). (b) Correlation brain maps of the local participation coefficient in the gamma band (PCγ
i[ ]) and the mini-mental state examination (MMSE) score of
AD subjects. Only significant R values are illustrated (p < 0.05, FDR corrected). (c) Scatter plot of the global multi-participation coefficient (PC) and the total recall (TR) score of AD subjects (Spearman’s correlation
R = 0.5547, p = 0.0074). (d) Correlation brain maps of the local multi-participation coefficient (MPCi) and the
that significantly reduced the global propensity to facilitate information propagation across frequency bands as compared to HC subjects (Fig. 3b, inset). This could be in part explained by the higher variability of the individual node degrees across bands (Fig. S2).
Such loss of inter-frequency centrality was mostly localized in association areas as well as in the cingulate cortex (Fig. 3b; Table 2), which resulted the most important hub promoting interaction across bands in the HC group (Fig. 4a). Because all these areas are typically affected by AD atrophy4 we hypothesize that the anatomi-cal withering might have impacted the neural oscillatory mechanisms supporting large-sanatomi-cale brain functional integration. Notably, the significant alteration of the connectivity across bands observed in the cingulate cortex could be ascribed to typical M/EEG connectivity changes observed in AD, such as reduced alpha coherence57–59, 61 (Fig. 4b). We also found a significant decrease in the primary motor cortex (right precentral gyrus). While previ-ous studies have identified this specific region as a connector hub in human brain networks2, its role in AD still needs to be clarified in terms of node centrality’s changes with respect to healthy conditions.
While flattening network layers represents in general an oversimplification, analyzing single layers can still be a valid approach that is worth of investigation. Because the MPC is a pure multiplex quantity, we considered the conceptually akin version for single-layer networks, the standard participation coefficient PC, which evaluates the tendency of nodes to integrate information from different modules, rather than from different layers28, 47. AD patients exhibited lower inter-modular connectivity in the gamma band with respect to HC subjects (Fig. 3a; Table 2) that was localized in association areas including frontal, temporal, and parietal cortices (Fig. 3a; Table 2). Damages to these regions can lead to deficits in attention, recognition and planning62. Our results support the hypothesis that AD could include a disconnection syndrome63–65. Furthermore, they are in line with previous findings showing PC decrements in AD, although those declines were more evident in lower frequency bands and therefore ascribed to possible long-range low-frequency connectivity alteration2, 15.
Put together, our findings indicated that AD alters the global brain network organization through connec-tion disrupconnec-tion in several associaconnec-tion regions (Figs 3a and 4a). In particular, we showed that the global loss of inter-modular interactions in the gamma band significantly affected the memory performance of AD patients as measured by the MMSE (Fig. 4a). These results suggest that the capacity of association areas to integrate informa-tion from other cortical regions through high-frequency channels, a crucial mechanism for sensory processing and memory retrieval66–70, becomes critically compromised in AD patients. Interestingly, such loss was paralleled by a diffused decrease of inter-frequency centrality. Future studies, involving recordings of limbic structures and/ or stimulation-based techniques, should elucidate whether these two distinct reorganizational processes are truly independent or linked through possible cross-frequency mechanisms which are known to be essential for normal memory formation71–73.
As a confirmation of the complementary information carried out by the multi-layer approach, we reported an increased classification accuracy when combining the local PC and MPC features. The observed diagnos-tic power is in line with previous accuracy values obtained with standard graph theorediagnos-tic approaches (around 80%) but exhibits slightly higher sensitivity (>90%), which is often desired to avoid false negatives74–78. Other approaches should determine if and to what extent the use of more sophisticated machine learning algorithms, or
Correlation Rank ROI label Cortex R coeff. p-value
γ PCi[ ] - MMSE 1 Lat_Fis-ant-Vertical R Frontal 0.5480 0.0046 2 G_occipital_sup L Occipital 0.5005 0.0108 3 S_interm_prim-Jensen R Parietal 0.4948 0.0119 4 G_and_S_cingul-Ant R Limbic 0.4864 0.0137 5 S_pericallosal R Limbic 0.4735 0.0168 6 G_and_S_transv_frontopol R Frontal 0.4585 0.0212 MPCi - TR 1 Lat_Fis-ant-Horizont L Frontal 0.6915 0.0004 2 S_collat_transv_post L Occipital 0.6706 0.0006 3 S_circular_insula_ant L Frontal 0.6214 0.0020 4 G_parietal_sup R Parietal 0.6061 0.0028 5 S_orbital_lateral R Frontal 0.5920 0.0037 6 Pole_temporal L Temporal 0.5739 0.0052 7 S_orbital_lateral L Frontal 0.5462 0.0085 8 S_temporal_sup R Temporal 0.5457 0.0086 9 G_and_S_occipital_inf L Occipital 0.5368 0.0100 10 G_occipital_sup R Occipital 0.5208 0.0130 11 G_postcentral L Sensory 0.5191 0.0133 12 G_pariet_inf-Supramar R Parietal 0.5151 0.0142 13 S_subparietal R Parietal 0.5066 0.0161 14 S_interm_prim-Jensen L Parietal 0.4915 0.0202 15 S_temporal_inf L Temporal 0.4869 0.0216
Table 3. Correlations of local brain network features and cognitive/memory scores. ROI labels, abbreviated
according to the Destrieux atlas, are ranked according to the resulting p-values. ROIs written in bold belong to the default mode network (DMN).
the inclusion of basic connectivity features79–81 and different imaging modalities82, can lead to higher classification performance and better diagnosis2.
Previous works have documented relationships between brain network properties and neuropsychological measurements in AD, suggesting a potential impact for monitoring disease progression and for the development of new therapies7, 8, 10, 75, 83, 84. This is especially true for the standard PC which has exhibited stronger correla-tions and larger between-group differences2. In line with this prediction, we also reported significant correlations between the MMSE cognitive scores and the PC values of the AD patients in the gamma band (Fig. 6a). An even stronger correlation was found, however, for the global MPC values and the TR scores (Fig. 6b, Table 3). Recent studies suggest that TR scores could be more specific for AD85, 86 as compared to MMSE scores which could be biased by differences in years of education, lack of sensitivity to progressive changes occurring with AD, as well as fail in detecting impairment caused by focal lesions87. Locally, the regions whose MPC correlated with TR were part of the default-mode network (DMN) (Table 3), which is heavily involved in memory formation and retrieval60, 88. According to recent hypothesis, these areas are directly affected by atrophy and metabolism disrup-tion, as well as amyloid-β deposition89, 90.
Put together, our results suggest that AD symptoms related to episodic memory losses could be determined by the lower capacity of strategic DMN association areas to let information flow across different frequency channels. These results are in line with a recent study that adopted a similar multi-frequency network approach91, but that, however, i) did not perform a direct comparison with standard single-frequency network measurements and, more importantly, ii) did not provide a possible interpretation of the MPC in terms of its ability to favor commu-nication across frequencies.
Methodological considerations.
As in many other biological systems, brain networks can be only inferred from experimentally obtained data92, 93. Hence, the resulting network only represents an estimate of the true underlying connectivity. In our study, MEG connectivity could be specifically influenced by linear mixing due to field spread effects (i.e., primary leakage) as well as by spurious interactions between areas spatially close to truly connected regions (i.e., secondary leakage)91, 94.Here, we estimated brain networks by means of spectral coherence, a functional connectivity measure widely used in the electrophysiological literature because of its simplicity and relatively intuitive interpretation95. While this measure, as any other existing ones, cannot solve the problem of primary and secondary leakage effects, recent evidence showed that source reconstruction techniques, like the one we adopted here, can i) mitigate this bias96, 97, ii) generate connectivity patterns consistent within and between subjects98, and iii) help the interpreta-tion of results in terms of cortical regions97.
To validate the obtained results we used, in a separate analysis, the imaginary coherence as a further approach to diminish field spread effects, at the cost, however, of removing possibly existing true interactions at zero-phase lag94, 96, 99. We demonstrated that while no significant between-group differences could be obtained in terms of
MPC (data not shown here), the spatial distribution of the MPC values was very similar to that observed in brain
networks obtained with the spectral coherence, especially for the internal regions along the longitudinal fissure (Fig. S3). Although, this is not a proof that we recovered true connectivity, it nevertheless validates the stability of our main results in terms of MPC.
Differently from other multiplex network quantities, such as those based on paths and walks50, the MPC has the advantage to not depend on the weights of the inter-layer links which, in general, are difficult to estimate or to assign from empirically obtained biological data. This is especially true in network neuroscience where, so far, the strength of the inter-layer connections is parametric and subject to arbitrariness27 or estimated through measures of cross-frequency coupling21 whose biological interpretation remains still to be completely elucidated20.
Conclusions
We proposed a multi-layer network approach to characterize multi-frequency brain networks in Alzheimer’s dis-ease. The obtained results gave new insights into the neural deterioration of Alzheimer’s disease by revealing an abnormal loss of inter-frequency centrality in memory-related association areas as well as in the cingulate cortex. Longitudinal studies, including prodromal mild cognitive impairment subjects, will need to assess the predictive value of this new information as a potential non-invasive biomarker for neurodegenerative diseases.
References
1. Stam, C. J. Modern network science of neurological disorders. Nat Rev Neurosci 15, 683–695 (2014).
2. Tijms, B. M. et al. Alzheimer’s disease: connecting findings from graph theoretical studies of brain networks. Neurobiol. Aging 34, 2023–2036 (2013).
3. Stam, C. J. Use of magnetoencephalography (MEG) to study functional brain networks in neurodegenerative disorders. Journal of
the Neurological Sciences 289, 128–134 (2010).
4. Wenk, G. L. Neuropathologic changes in Alzheimer’s disease. J Clin Psychiatry 64(Suppl 9), 7–10 (2003).
5. Rose, S. E. et al. Loss of connectivity in Alzheimer’s disease: an evaluation of white matter tract integrity with colour coded MR diffusion tensor imaging. J. Neurol. Neurosurg. Psychiatr. 69, 528–530 (2000).
6. Zhou, Y. et al. Abnormal connectivity in the posterior cingulate and hippocampus in early Alzheimer’s disease and mild cognitive impairment. Alzheimers Dement 4, 265–270 (2008).
7. Lo, C.-Y. et al. Diffusion tensor tractography reveals abnormal topological organization in structural cortical networks in Alzheimer’s disease. J. Neurosci. 30, 16876–16885 (2010).
8. Sanz-Arigita, E. J. et al. Loss of ‘Small-World’ Networks in Alzheimer’s Disease: Graph Analysis of fMRI Resting-State Functional Connectivity. PLOS ONE 5, e13788 (2010).
9. Stam, C. J. et al. Graph theoretical analysis of magnetoencephalographic functional connectivity in Alzheimer’s disease. Brain 132, 213–224 (2009).
10. de Haan, W. et al. Functional neural network analysis in frontotemporal dementia and Alzheimer’s disease using EEG and graph theory. BMC Neuroscience 10, 101 (2009).
11. Miraglia, F., Vecchio, F. & Rossini, P. M. Searching for signs of aging and dementia in EEG through network analysis. Behavioural
Brain Research 317, 292–300 (2017).
12. Bassett, D. S. et al. Dynamic reconfiguration of human brain networks during learning. PNAS 108, 7641–7646 (2011).
13. Crossley, N. A. et al. The hubs of the human connectome are generally implicated in the anatomy of brain disorders. Brain 137, 2382–2395 (2014).
14. Buckner, R. L. et al. Cortical hubs revealed by intrinsic functional connectivity: mapping, assessment of stability, and relation to Alzheimer’s disease. J. Neurosci. 29, 1860–1873 (2009).
15. de Haan, W. et al. Disrupted modular brain dynamics reflect cognitive dysfunction in Alzheimer’s disease. NeuroImage 59, 3085–3093 (2012).
16. Engels, M. M. et al. Declining functional connectivity and changing hub locations in Alzheimer’s disease: an EEG study. BMC Neurol 15 (2015).
17. De Vico Fallani, F., Richiardi, J., Chavez, M. & Achard, S. Graph analysis of functional brain networks: practical issues in translational neuroscience. Phil. Trans. R. Soc. B 369, 20130521 (2014).
18. Bullmore, E. & Sporns, O. Complex brain networks: graph theoretical analysis of structural and functional systems. Nat. Rev.
Neurosci. 10, 186–198 (2009).
19. Canolty, R. T. & Knight, R. T. The functional role of cross-frequency coupling. Trends in Cognitive Sciences 14, 506–515 (2010). 20. Jirsa, V. & Müller, V. Cross-frequency coupling in real and virtual brain networks. Front Comput Neurosci 7 (2013).
21. Brookes, M. J. et al. A multi-layer network approach to MEG connectivity analysis. NeuroImage 132, 425–438 (2016).
22. Fraga, F. J., Falk, T. H., Kanda, P. A. M. & Anghinah, R. Characterizing Alzheimer’s Disease Severity via Resting-Awake EEG Amplitude Modulation Analysis. PLoS One 8 (2013).
23. Blinowska, K. J. et al. Functional and effective brain connectivity for discrimination between Alzheimer’s patients and healthy individuals: A study on resting state EEG rhythms. Clin Neurophysiol (2016).
24. Ghanbari, Y. et al. Functionally driven brain networks using multi-layer graph clustering. Med Image Comput Comput Assist Interv 17, 113–120 (2014).
25. Simas, T., Chavez, M., Rodriguez, P. R. & Diaz-Guilera, A. An algebraic topological method for multimodal brain networks comparisons. Front Psychol 6 (2015).
26. Battiston, F., Nicosia, V., Chavez, M. & Latora, V. Multilayer motif analysis of brain networks. Chaos. 27(4):047404 (2017). 27. De Domenico M, Sasai S, Arenas A. Mapping Multiplex Hubs in Human FunctionalBrain Networks. Front Neurosci. 15;10:326
(2016)
28. Battiston, F., Nicosia, V. & Latora, V. Structural measures for multiplex networks. Phys. Rev. E 89, 032804 (2014). 29. De Domenico, M. et al. Mathematical Formulation of Multilayer Networks. Phys. Rev. X 3, 041022 (2013).
30. Folstein, M. F., Folstein, S. E. & McHugh, P. R. “Mini-mental state”. A practical method for grading the cognitive state of patients for the clinician. J Psychiatr Res 12, 189–198 (1975).
31. Buschke, H. Cued recall in Amnesia. Journal of Clinical Neuropsychology 6, 433–440 (1984).
32. Grober, E., Buschke, H., Crystal, H., Bang, S. & Dresner, R. Screening for dementia by memory testing. Neurology 38, 900–903 (1988).
33. Pillon, B., Deweer, B., Agid, Y. & Dubois, B. Explicit memory in Alzheimer’s, Huntington’s, and Parkinson’s diseases. Arch. Neurol. 50, 374–379 (1993).
34. Sarazin, M. et al. Amnestic syndrome of the medial temporal type identifies prodromal AD: a longitudinal study. Neurology 69, 1859–1867 (2007).
35. Taulu, S. & Simola, J. Spatiotemporal signal space separation method for rejecting nearby interference in MEG measurements. Phys.
Med. Biol. 51, 1759 (2006).
36. He, B. Brain electric source imaging: scalp Laplacian mapping and cortical imaging. Crit Rev Biomed Eng 27, 149–188 (1999). 37. Baillet, S. et al. Evaluation of inverse methods and head models for EEG source localization using a human skull phantom. Phys Med
Biol 46, 77–96 (2001).
38. Fischl, B. et al. Whole brain segmentation: automated labeling of neuroanatomical structures in the human brain. Neuron 33, 341–355 (2002).
39. Fischl, B. et al. Sequence-independent segmentation of magnetic resonance images. Neuroimage 23(Suppl 1), S69–84 (2004). 40. Tadel, F. et al. Brainstorm: A User-Friendly Application for MEG/EEG Analysis, Brainstorm: A User-Friendly Application for MEG/
EEG Analysis. Computational Intelligence and Neuroscience, Computational Intelligence and Neuroscience 2011, e879716 (2011). 41. Lin, F.-H. et al. Assessing and improving the spatial accuracy in MEG source localization by depth-weighted minimum-norm
estimates. NeuroImage 31, 160–171 (2006).
42. Destrieux, C., Fischl, B., Dale, A. & Halgren, E. Automatic parcellation of human cortical gyri and sulci using standard anatomical nomenclature. Neuroimage 53, 1–15 (2010).
43. Carter, G. C. Coherence and time delay estimation. Proceedings of the IEEE 75, 236–255 (1987).
44. Stam, C. J. et al. Generalized synchronization of MEG recordings in Alzheimer’s Disease: evidence for involvement of the gamma band. J Clin Neurophysiol 19, 562–574 (2002).
45. Babiloni, C. et al. Abnormal fronto-parietal coupling of brain rhythms in mild Alzheimer’s disease: a multicentric EEG study. Eur. J.
Neurosci. 19, 2583–2590 (2004).
46. Rubinov, M. & Sporns, O. Complex network measures of brain connectivity: Uses and interpretations. NeuroImage 52, 1059–1069 (2010).
47. Guimerà, R. & Amaral, L. A. N. Cartography of complex networks: modules and universal roles. J Stat Mech 2005, P02001–1–P02001–13 (2005).
48. Newman, M. E. J. Finding community structure in networks using the eigenvectors of matrices. Phys. Rev. E 74, 036104 (2006). 49. Kivelä, M. et al. Multilayer networks. jcomplexnetw 2, 203–271 (2014).
50. Boccaletti, S. et al. The structure and dynamics of multilayer networks. Physics Reports 544, 1–122 (2014).
51. De Vico Fallani, F. et al. Interhemispheric Connectivity Characterizes Cortical Reorganization in Motor-Related Networks After Cerebellar Lesions. Cerebellum (2016).
52. Benjamini, Y. & Hochberg, Y. Controlling the False Discovery Rate: A Practical and Powerful Approach to Multiple Testing. Journal
of the Royal Statistical Society. Series B (Methodological) 57, 289–300 (1995).
53. Zar, J. H. Biostatistical analysis (Prentice Hall PTR, 1999).
54. Benjamini, Y. & Yekutieli, D. The Control of the False Discovery Rate in Multiple Testing under Dependency. The Annals of Statistics 29, 1165–1188 (2001).
55. Hastie, T., Tibshirani, R. & Friedman, J. The Elements of Statistical Learning. Springer Series in Statistics (Springer New York, New York, NY, 2009).
56. Babiloni, C. et al. Mapping distributed sources of cortical rhythms in mild Alzheimer’s disease. A multicentric EEG study.
Neuroimage 22, 57–67 (2004).
57. Jeong, J. EEG dynamics in patients with Alzheimer’s disease. Clin Neurophysiol 115, 1490–1505 (2004).
58. Dauwels, J., Vialatte, F. & Cichocki, A. Diagnosis of Alzheimer’s Disease from EEG Signals: Where Are We Standing? Current
Alzheimer Research 7, 487–505 (2010).
60. Buckner, R. L., Andrews-Hanna, J. R. & Schacter, D. L. The Brain’s Default Network. Annals of the New York Academy of Sciences 1124, 1–38 (2008).
61. Stam, C. J. et al. Magnetoencephalographic evaluation of resting-state functional connectivity in Alzheimer’s disease. NeuroImage 32, 1335–1344 (2006).
62. Purves, D. et al. (eds) Neuroscience, 2nd edn. (Sinauer Associates, 2001).
63. Pearson, R. C., Esiri, M. M., Hiorns, R. W., Wilcock, G. K. & Powell, T. P. Anatomical correlates of the distribution of the pathological changes in the neocortex in Alzheimer disease. Proc. Natl. Acad. Sci. USA 82, 4531–4534 (1985).
64. Arnold, S. E., Hyman, B. T., Flory, J., Damasio, A. R. & Van Hoesen, G. W. The topographical and neuroanatomical distribution of neurofibrillary tangles and neuritic plaques in the cerebral cortex of patients with Alzheimer’s disease. Cereb. Cortex 1, 103–116 (1991).
65. Catani, M. & Ffytche, D. H. The rises and falls of disconnection syndromes. Brain 128, 2224–2239 (2005).
66. Miltner, W. H., Braun, C., Arnold, M., Witte, H. & Taub, E. Coherence of gamma-band EEG activity as a basis for associative learning. Nature 397, 434–436 (1999).
67. Buschman, T. J. & Miller, E. K. Top-down versus bottom-up control of attention in the prefrontal and posterior parietal cortices.
Science 315, 1860–1862 (2007).
68. Siegel, M., Donner, T. H., Oostenveld, R., Fries, P. & Engel, A. K. Neuronal Synchronization along the Dorsal Visual Pathway Reflects the Focus of Spatial Attention. Neuron 60, 709–719 (2008).
69. Gregoriou, G. G., Gotts, S. J., Zhou, H. & Desimone, R. High-frequency, long-range coupling between prefrontal and visual cortex during attention. Science 324, 1207–1210 (2009).
70. Hipp, J. F., Engel, A. K. & Siegel, M. Oscillatory synchronization in large-scale cortical networks predicts perception. Neuron 69, 387–396 (2011).
71. Canolty, R. T. et al. High Gamma Power Is Phase-Locked to Theta Oscillations in Human Neocortex. Science 313, 1626–1628 (2006). 72. Axmacher, N. et al. Cross-frequency coupling supports multi-item working memory in the human hippocampus. PNAS 107,
3228–3233 (2010).
73. Goutagny, R. et al. Alterations in hippocampal network oscillations and theta–gamma coupling arise before Aß overproduction in a mouse model of Alzheimer’s disease. Eur J Neurosci 37, 1896–1902 (2013).
74. Li, Y. et al. Discriminant analysis of longitudinal cortical thickness changes in Alzheimer’s disease using dynamic and network features. Neurobiol. Aging 33 (2012).
75. Wang, J. et al. Disrupted functional brain connectome in individuals at risk for Alzheimer’s disease. Biol. Psychiatry 73, 472–481 (2013).
76. Wee, C.-Y. et al. Enriched white matter connectivity networks for accurate identification of MCI patients. Neuroimage 54, 1812–1822 (2011).
77. Wee, C.-Y. et al. Identification of MCI individuals using structural and functional connectivity networks. Neuroimage 59, 2045–2056 (2012).
78. Horwitz, B. & Rowe, J. B. Functional biomarkers for neurodegenerative disorders based on the network paradigm. Progress in
Neurobiology 95, 505–509 (2011).
79. Dai, D., He, H., Vogelstein, J. & Hou, Z. Network-Based Classification Using Cortical Thickness of AD Patients. In Hutchison, D.
et al. (eds) Machine Learning in Medical Imaging, vol. 7009, 193–200 (Springer Berlin Heidelberg, Berlin, Heidelberg, 2011).
80. Shao, J. et al. Prediction of Alzheimer’s disease using individual structural connectivity networks. Neurobiol Aging 33, 2756–2765 (2012).
81. Zhou, L. et al. Hierarchical Anatomical Brain Networks for MCI Prediction: Revisiting Volumetric Measures. PLOS ONE 6, e21935 (2011).
82. Dai, Z. et al. Discriminative analysis of early Alzheimer’s disease using multi-modal imaging and multi-level characterization with multi-classifier (M3). NeuroImage 59, 2187–2195 (2012).
83. Shu, N. et al. Disrupted topological organization in white matter structural networks in amnestic mild cognitive impairment: relationship to subtype. Radiology 265, 518–527 (2012).
84. Stam, C. J., Jones, B. F., Nolte, G., Breakspear, M. & Scheltens, P. Small-world networks and functional connectivity in Alzheimer’s disease. Cereb. Cortex 17, 92–99 (2007).
85. Grober, E., Sanders, A. E., Hall, C. & Lipton, R. B. Free and cued selective reminding identifies very mild dementia in primary care.
Alzheimer Dis Assoc Disord 24, 284–290 (2010).
86. Velayudhan, L. et al. Review of brief cognitive tests for patients with suspected dementia. Int Psychogeriatr 26, 1247–1262 (2014). 87. Tombaugh, T. N. & McIntyre, N. J. The mini-mental state examination: a comprehensive review. J Am Geriatr Soc 40, 922–935
(1992).
88. Sperling, R. A. et al. Functional Alterations in Memory Networks in Early Alzheimer’s Disease. Neuromolecular Med 12, 27–43 (2010).
89. Buckner, R. L. et al. Molecular, structural, and functional characterization of Alzheimer’s disease: evidence for a relationship between default activity, amyloid, and memory. J. Neurosci. 25, 7709–7717 (2005).
90. Greicius, M. D., Srivastava, G., Reiss, A. L. & Menon, V. Default-mode network activity distinguishes Alzheimer’s disease from healthy aging: Evidence from functional MRI. Proc Natl Acad Sci USA 101, 4637–4642 (2004).
91. Yu, M. et al. Selective impairment of hippocampus and posterior hub areas in Alzheimer’s disease: an MEG-based multiplex network study. Brain 140, 1466–1485 (2017).
92. Vidal, M., Cusick, M. E. & Barabási, A.-L. Interactome networks and human disease. Cell 144, 986–998 (2011). 93. Craddock, R. C. et al. Imaging human connectomes at the macroscale. Nat. Methods 10, 524–539 (2013).
94. Palva, S. & Palva, J. M. Discovering oscillatory interaction networks with M/EEG: challenges and breakthroughs. Trends in Cognitive
Sciences 16, 219–230 (2012).
95. Srinivasan, R., Winter, W. R., Ding, J. & Nunez, P. L. EEG and MEG coherence: measures of functional connectivity at distinct spatial scales of neocortical dynamics. J. Neurosci. Methods 166, 41–52 (2007).
96. Sekihara, K., Owen, J. P., Trisno, S. & Nagarajan, S. S. Removal of Spurious Coherence in MEG Source-Space Coherence Analysis.
IEEE Transactions on Biomedical Engineering 58, 3121–3129 (2011).
97. Schoffelen, J.-M. & Gross, J. Source connectivity analysis with MEG and EEG. Hum Brain Mapp 30, 1857–1865 (2009). 98. Colclough, G. L. et al. How reliable are MEG resting-state connectivity metrics? Neuroimage 138, 284–293 (2016).
99. Nolte, G. et al. Identifying true brain interaction from EEG data using the imaginary part of coherency. Clinical Neurophysiology 115, 2292–2307 (2004).
Acknowledgements
We are grateful to F. Battiston for his useful comments and suggestions. This work has been partially supported by the program “Investissements d’avenir” ANR-10-IAIHU-06. FD acknowledges support from the “Agence Nationale de la Recherche” through contract number ANR-15-NEUC-0006–02. The content is solely the responsibility of the authors and does not necessarily represent the official views of any of the funding agencies.
Author Contributions
J.G. conceived and perfomed data analysis, wrote the manuscript and prepared all figures. Y.A. and D.S. performed data preprocessing. V.C. and B.D. conceived the experimental protocol, included patients and acquired neuroimaging and clinical data. O.C. conceived the experimental protocol and wrote the manuscript. F.D.V.F. conceived data analysis and wrote the manuscript. All authors reviewed the manuscript.
Additional Information
Supplementary information accompanies this paper at doi:10.1038/s41598-017-07846-w
Competing Interests: The authors declare that they have no competing interests.
Publisher's note: Springer Nature remains neutral with regard to jurisdictional claims in published maps and
institutional affiliations.
Open Access This article is licensed under a Creative Commons Attribution 4.0 International
License, which permits use, sharing, adaptation, distribution and reproduction in any medium or format, as long as you give appropriate credit to the original author(s) and the source, provide a link to the Cre-ative Commons license, and indicate if changes were made. The images or other third party material in this article are included in the article’s Creative Commons license, unless indicated otherwise in a credit line to the material. If material is not included in the article’s Creative Commons license and your intended use is not per-mitted by statutory regulation or exceeds the perper-mitted use, you will need to obtain permission directly from the copyright holder. To view a copy of this license, visit http://creativecommons.org/licenses/by/4.0/.
![Figure 6. Correlation between brain network properties and cognitive/memory scores. (a) Scatter plot of the global participation coefficient in the gamma band (PC [γ] ) and the mini-mental state examination (MMSE) score of AD subjects (Spearman’s correl](https://thumb-eu.123doks.com/thumbv2/123doknet/14372976.504644/9.892.231.829.493.936/correlation-properties-cognitive-scatter-participation-coefficient-examination-spearman.webp)