Publisher’s version / Version de l'éditeur:
Vous avez des questions? Nous pouvons vous aider. Pour communiquer directement avec un auteur, consultez la première page de la revue dans laquelle son article a été publié afin de trouver ses coordonnées. Si vous n’arrivez pas à les repérer, communiquez avec nous à PublicationsArchive-ArchivesPublications@nrc-cnrc.gc.ca.
Questions? Contact the NRC Publications Archive team at
PublicationsArchive-ArchivesPublications@nrc-cnrc.gc.ca. If you wish to email the authors directly, please see the first page of the publication for their contact information.
https://publications-cnrc.canada.ca/fra/droits
L’accès à ce site Web et l’utilisation de son contenu sont assujettis aux conditions présentées dans le site LISEZ CES CONDITIONS ATTENTIVEMENT AVANT D’UTILISER CE SITE WEB.
The Journal of Biological Chemistry, 262, 19, pp. 9037-9043, 1987-07-05
READ THESE TERMS AND CONDITIONS CAREFULLY BEFORE USING THIS WEBSITE. https://nrc-publications.canada.ca/eng/copyright
NRC Publications Archive Record / Notice des Archives des publications du CNRC :
https://nrc-publications.canada.ca/eng/view/object/?id=16c6e850-d709-4261-a551-017ffc32d423
https://publications-cnrc.canada.ca/fra/voir/objet/?id=16c6e850-d709-4261-a551-017ffc32d423
NRC Publications Archive
Archives des publications du CNRC
This publication could be one of several versions: author’s original, accepted manuscript or the publisher’s version. / La version de cette publication peut être l’une des suivantes : la version prépublication de l’auteur, la version acceptée du manuscrit ou la version de l’éditeur.
For the publisher’s version, please access the DOI link below./ Pour consulter la version de l’éditeur, utilisez le lien DOI ci-dessous.
https://doi.org/10.1016/S0021-9258(18)48043-X
Access and use of this website and the material on it are subject to the Terms and Conditions set forth at
Infrared spectroscopic characterization of the structural changes
connected with the E1→E2 transition in the Ca2+-ATPase of
sarcoplasmic reticulum
Arrondo, Jose L. R.; Mantsch, Henry H.; Mullner, Nandor; Pikula, Slawomir;
Martonosi, Anthony
0 1987 by The American Society of Biological Chemists, Inc Printed in U. S. A.
Infrared Spectroscopic Characterization
of the Structural Changes
Connected with the
El
+
E2
Transition in the Ca2+-ATPase
of
Sarcoplasmic Reticulum*
(Received for publication, November 14,1986)
Jose L. R. Arrondo$ Henry H. Mantsch
From the Division of Chemistry, Nationul Research Council of Canada, Ottawa, Ontario, Canada KIA OR6
Nandor Mullner, Slawomir Pikula, and Anthony Martonosig
From the Department of Biochemistry and Molecular Biology, State university of New York, Health Science Center, Syracuse, New York 1321 0
The Ca2+-transporting ATPase (EC 3.6.1.38) of sar- coplasmic reticulum alternates between several con- formational states during ATP-dependent Ca2+ trans- port. The El conformation is stabilized by 0.1 mM Ca2+
and the
E,
conformation by vanadate in a Ca2+-free medium. Fourier transform infrared spectroscopy re- veals significant differences between the two states that indicate differences in the protein secondary structure. The two states and the corresponding spec-tra can be interconverted reversibly by changing the Ca2+ concentration of the medium. The infrared spec- tral changes indicate the appearance of a new a-helical substructure connected with the El + E, conversion accompanied by small changes in &turns, while the
B-
sheet content remains essentially unchanged. There are also differences between the El and
Ez
states in theC=O stretching vibrations of the ester carbonyl groups of phospholipids in intact sarcoplasmic reticulum that are not observed under identical conditions in isolated sarcoplasmic reticulum lipid dispersions. These obser- vations imply an effect of proteins on the structure of the interfacial regions of the phospholipids that is de- pendent on the conformational state of the Ca2+-ATP- ase. The CH2- and CHS-stretching frequencies of the membrane lipids are not affected significantly by the
El -., E, transition. The Fourier transform infrared spectra of sarcoplasmic reticulum vesicles in the pres- ence of 20 mM Ca2+ suggest the stabilization of a pro- tein conformation similar to the
E2
state except for differences in the behavior of COO- and phospholipid ester C=O groups that may reflect charge effects of the bound Ca2+.The Ca2+-transporting ATPase (EC 3.6.1.38) is an intrinsic membrane protein that constitutes about 80% of the protein content of isolated sarcoplasmic reticulum vesicles (Marto- nosi and Beeler, 1983). The predicted structure of Ca2+-
* This work was supported by National Institutes of Health Grant AM 26545, National Science Foundation Grant PCM 84-03679, and the Muscular Dystrophy Association, Inc. Issued as NRCC publica- tion no. 26590. The costs of publication of this article were defrayed in part by the payment of page charges. This article must therefore be hereby marked “advertisement” in accordance with 18 U.S.C. Section 1734 solely to indicate this fact.
$ Acknowledges North Atlantic Treaty Organization for a fellow- ship. Permanent address: Dept. of Biochemistry, University of the Basque Country, Bilbao, Spain.
J To whom all correspondence should be addressed.
ATPase, based on its amino acid sequence consists of an intramembranous, primarily helical domain, and several cy- toplasmic domains composed of a-helical, p-sheet, @-turn, and random elements (MacLennan et al., 1985; Brandl et al.,
1986). Circular dichroism measurements gave the following composition of secondary structures: 46% a-helix, 8% @-sheet, 13% p-turn, and 33% random coil (Csermely et al., 1987). The dominant a-helical character of the protein is also suggested by Raman spectroscopic studies (Lippert et aL, 1981; Williams
et al., 1986) in essential agreement with the circular dichroism
data. Based on electron microscopy of frozen hydrated Ca2+- ATPase crystals, about l/3 of the Ca2+-ATPase polypeptide is
located within the lipid environment of the membrane, and
215 is exposed on the cytoplasmic surface (Taylor et al., 1986a;
1986b). A similar disposition of the Ca2+-ATPase was derived from x-ray and neutron diffraction data (Brady et
ul.,
1981, 1982; Blasie et al., 1985).During ATP-dependent Ca2+ transport the Ca*+-ATPase alternates between several conformations, characterized by different affinities for calcium, ATP, and magnesium, and changes in the reactivity of several functional groups (Inesi and de Meis, 1985). Stabilization of the enzyme in the El conformation by calcium and lanthanides leads to the for- mation of P1-type crystalline CaZ’-ATPase arrays (Dux et al.,
1985). Vanadate and inorganic phosphate in a calcium-free medium shift the equilibrium in favor of the E2 conformation and promote the formation of P2-type Ca*+-ATPase crystals (Taylor et al., 1986a; 1986b). Previous circular dichroism measurements did not reveal significant differences between these two major conformations in the protein secondary struc- ture of sarcoplasmic reticulum (Nakamoto and Inesi, 1986; Csermely et al., 19871, suggesting that the El + E2 transition involves a rearrangement of domains within the ATPase molecule rather than a refolding of polypeptide backbone.
Recent applications of Fourier transform infrared spec- trometry (Mendelsohn and Mantsch, 1986; Lee and Chapman, 1986) promise a more penetrating insight into the structural changes connected with the E, + E2 transition. Infrared spectra of sarcoplasmic reticulum in H20 or D20 media show distinct bands in the Amide I region related to a-helix,
p-
sheet, and random coil structures (Cortijo et al., 1982; Men- delsohn et al., 1984; Lee et al., 1985; Arrondo and Goni, 1985;Arrondo et al., 1985; Muga et al., 1986; Jaworsky et al., 1986). Detailed FT-IR’ studies of the effect of Ca2+-ATPase on the order and melting characteristics of phospholipids in native
The abbreviations used are: FT-IR, Fourier transform infrared; EGTA, [ethylenebis(oxyethylenenitrilo)]tetraacetic acid.
9037
9038
Infrared Spectroscopy
of Sarcoplasmic Reticulum
sarcoplasmic reticulum and in reconstituted CaZf-ATPase vesicles (Mendelsohn et al., 1984; Jaworsky and Mendelsohn,
1985; Anderle and Mendelsohn, 1986) reveal interesting se- lectivity in the interaction of Ca2+-ATPase with certain phos- pholipid classes.
The focus of this report is the effect of Ca", EGTA, and vanadate on the Amide I and I1 vibrations arising from protein peptide bonds and on the C=O stretching vibrations of the lipid ester carbonyl groups in rabbit sarcoplasmic reticulum vesicles and in isolated sarcoplasmic reticulum lipids. The data indicate distinct differences in protein secondary struc- tures between the E, and E, conformations of Ca2+-ATPase and a clear relationship between the structure of Ca2+-ATPase and the conformation of the lipid ester carbonyl bond.
EXPERIMENTAL PROCEDURES Materials
Deuterium oxide was obtained from MSD Isotopes, Merck Chem- ical Division, St. Louis, MO 63116. EGTA, phosphoenolpyruvate, p-
nicotinamide adenine dinucleotide, lactic dehydrogenase (rabbit mus- cle), pyruvate kinase (rabbit muscle), and adenosine 5'4riphosphate were supplied by Sigma. A23187 was purchased from Behring Diag- nostics, and sodium vanadate was obtained from Fisher. All other reagents were of analytical grade.
Methods
Preparation of Sarcoplasmic Reticulum-The sarcoplasmic reticu- lum vesicles were isolated from predominantly white skeletal muscles of rabbits as described earlier (Jona and Martonosi, 1986), and the preparations were stored before use frozen at -70 "C in 0.3 M sucrose, 10 mM Tris-maleate, pH 7.0, at a protein concentration of 25-38 mg/ ml.
About 16-18 h before measurements, 1- to 2-ml aliquots of the microsomes were thawed, centrifuged, and the pellet resuspended in
5 ml of standard medium containing 0.1 M KCl, 10 mM imidazole, pH 7.4, and 1 mM MgClZ in either HzO or DzO. The centrifugation and resuspension steps were repeated twice more. The final sediments were taken up in standard Hz0 or DzO medium to a final protein concentration of 24-33.6 mg/ml.
FT-IR measurements were carried out: (a) without further addi- tion, (b) after the addition of CaClz to a final concentration of 0.1 mM, (c) after addition of CaClz to a final concentration of 20 mM, and (d) after addition of 1 mM EGTA and 5 mM Na3V04.
Concentrated stock solutions of CaClZ, EGTA, and vanadate were prepared in HzO or DzO containing standard medium.
Protein was determined according to Lowry et al. (1951). Extraction of Phospholipids from Sarcoplasmic Reticulum-The preparation of sarcoplasmic reticulum phospholipids was carried out essentially as described by Folch et al. (1957). The extracted lipids were dried under nitrogen and suspended in standard Hz0 or DZO medium. After ultrasonic dispersion the liposomes were stored at 2 "C under nitrogen for 1-2 days. Before FT-IR measurements, Ca2+ or EGTA and vanadate were added as described for native sarcoplasmic reticulum. The phospholipid P content of the extract was determined after perchloric acid digestion according to Fiske and Subbarow
(1925) or Bartlett (1959).
Delipidation of Sarcoplasmic Reticulum-The method of Dean and Tanford (1977,1978) was used with minor modifications. Microsomes
(5 mg of protein/ml) suspended in HzO or DzO containing standard with deoxycholate (10 mg/ml). After centrifugation at 59,000 medium (pH 7.5) supplemented with 20% glycerol were solubilized X g for 45 min, the supernatant was diluted with equal volume of standard medium, and the Ca2+-ATPase was precipitated with 12.5% polyeth- ylene glycol. Following centrifugation at 33,000 X g for 20 min, the
pellets were washed with standard medium containing 12.5% polyeth- ylene glycol and were finally resuspended in HzO or DzO containing standard medium. FT-IR measurements were carried out after addi- tion of Ca2+ or EGTA and vanadate as described for native sarco- plasmic reticulum.
ATPase Assay
ATPase activities were measured, either by a coupled enzyme system of pyruvate kinase and lactate dehydrogenase (Dean and
Tanford, 1977), or by the analysis of inorganic phosphate liberation from ATP using the Fiske-Subbarow (1925) technique.
bated for 5 min at 25 "C in 1 ml of medium I containing 0.1 (a)-In the coupled enzyme assay, the microsomes were preincu- M KCl,
0.02 M Tris-HCI, pH 7.5, 0.9 mM CaCl2, 5 mM MgClZ, 0.42 mM
phosphoenolpyruvate, 0.2 mM NADH, 7.5 IU of pyruvate kinase, and
18 IU of lactate dehydrogenase f 2 p~ A23187; the microsomal protein concentration was 1 pg/ml. After preincubation 1 ml of medium I1 was added to start the reaction. Medium I1 contained 0.1
M KCl, 0.02 M Tris-HC1, pH 7.5, 1 mM EGTA, 5 mM MgCl2, 10 mM ATP, and phosphoenolpyruvate, NADH, pyruvate kinase, and lactate dehydrogenase at the same concentrations as in medium I. The preincubation in medium I was required to displace vanadate from the binding site of the Ca2+-ATPase. The absorbance was measured at 340 nm at 25 "C using a Perkin-Elmer Lambda 3-B dual wavelength spectrophotometer. The recorded absorbance was linear up to at least 5-10 min of reaction time. For measurement of the Ca2+-insensitive (basal) ATP hydrolysis, Ca2+ was omitted from the medium. The Ca2+-insensitive ATP hydrolysis rate was usually less than 5% of the rate of ATP hydrolysis in Caz+-containing medium. Data on total ATP hydrolysis rates measured in Ca2+-containing media were cor- rected for the Ca2+-insensitive hydrolysis rate determined in the same experiment to obtain the rate of Ca2+-stimulated ATPase activity.
(b)-The rate of inorganic phosphate liberation from ATP was determined by incubation of microsomes (0.05 to 0.1 mg of protein/ ml) in an assay medium of 0.1 M KCl, 10 mM imidazole, pH 7.4, 5
mM MgCl,, 5 mM ATP, 0.5 mM EGTA, 0.45 mM CaCl2 f 1 p~ A23187
at 25 "C for 1-5 min. The reaction was stopped with trichloroacetic acid, and the inorganic phosphate was determined according to Fiske and Subbarow (1925). In the assay of basal (Ca2+-insensitive) ATPase activity, the Ca2+ was omitted from the medium.
Fourier Transform Infrared Spectrometry
Digilab Infrared spectra of aqueous vesicle suspensions were recorded on a FTS-15 FT-IR spectrometer using a demountable cell (Har- rick Scientific, Ossining, NY) with calcium fluoride windows and 6- pm spacers for samples in H 2 0 medium or 50-pm spacers for samples in DzO medium. A tungsten-copper thermocouple was taped directly onto the window and the cell placed into a thermostated cell mount. For each spectrum 512 interferograms were averaged at an optical retardation of 0.5 cm, triangularly apodized, and Fourier transformed to yield FT-IR spectra with a resolution of 2 cm". The HzO or DzO spectra were digitally subtracted using a spectrum of the medium as reference. In order to separate instrumentally unresolvable infrared band contours, Fourier deconvolution (Mantsch et al., 1986) and Fourier derivation techniques (Moffatt et al., 1986) were applied. Band narrowing by Fourier deconvolution was performed by using Lorentzian bandwidths of 15 cm" and a resolution enhancement factor of 2.2. Fourier derivation was performed by using a power of 3 and a breakpoint of 0.4. A power of 3 in Fourier derivation corre- sponds to a smoothed fourth derivative. The ATPase activity of sarcoplasmic reticulum samples was measured before and after re- cording the FT-IR spectra, and the activities did not change signifi- cantly.
RESULTS
The unique advantage of infrared spectrometry is that it allows the simultaneous study of the structure of lipids and proteins of intact biological membranes under near physiolog- ical conditions without the introduction of reporter groups. While the strong water absorption in the region 1700-1600 cm-', where the structurally most significant protein bands are located, presented difficulties in the early applications of infrared spectrometry to biological systems, modern FT-IR spectrometers generate infrared spectra with a signal-to-noise ratio high enough to subtract the water component from the protein spectrum. The problem caused by the Hz0 band may also be prevented by the use of D20 instead of HzO as solvent; however, under these conditions the replacement of exchange- able hydrogens by deuterium leads to changes in the spectrum that must be taken into account in the analysis and interpre- tation of the data.
Infrared Spectra of Sarcoplasmic Reticulum Vesicles in HzO
branes isolated from rabbit muscle are shown in Fig. 1 after solvent subtraction in H,O (solid line) and in D,O solutions (dashed line). Several differences can be seen. The maximum
of the Amide I band which is at 1652 cm" in H 2 0 buffer has shifted to 1646 cm" in DzO. This is due to H-to-D exchange of the amide N-H groups in un- (or less) ordered structures that changes the overall band shape. The Amide I1 band shifts from 1550 cm" in H,O to 1460 cm" after deuteration; a residual Amide I1 band that is retained in DzO medium at 1550 cm" is due to the slow exchange of amide hydrogens in ordered structures and in domains that are sheltered from solvent exchange. Furthermore, the decrease in the intensity
of the Amide I1 band in a D 2 0 medium allows one to see other vibrations that are usually hidden by the strong Amide I1 band in H20; among these are the side chain vibrations of amino acids, such as carboxylate and carbimino groups and the C-C stretching vibrations of the phenyl group of tyrosine (Chirgadze et al., 1975).
The Amide I and I1 modes generate unique band contours in the region of 1800:1500 cm". Generally, both the Amide I and I1 band contours consist of several component bands which overlap each other. Because of the intrinsic widths of these component bands (their half-bandwidth, typically 20- 25 cm", is larger than the separation between individual bands), they cannot be resolved by increased instrumental resolution. In the past this fact had severely limited the application of infrared spectroscopy to protein conformational analysis. More recently mathematical methods have been developed that allow the computational narrowing of infrared bands that comprise a complex band contour. While this operation is often referred to as resolution enhancement, it does not increase the instrumental resolution but increases the degree to which individual component bands can be vis- ualized. Currently, two such computational procedures are used for band narrowing, Fourier deconvolution and deriva- tion. Fourier deconvolution is an iterative procedure con- trolled by two adjustable parameters, i.e. the bandwidth and a resolution enhancement factor. The Fourier derivation is an alternative and mathematically different method of spec- tral resolution enhancement that is based on the generation of "non-integer derivative" band profiles; the degree of reso- lution enhancement is under the control of a single "break-
1 8 0 0 1 7 5 0 1 7 0 0 1 6 5 0 1 6 0 0 1550 1 5 0 0 WAVENUMBER/CM'
FIG. 1. Infrared spectra of sarcoplasmic reticulum in HzO and DzO. Solid line, spectrum of sarcoplasmic reticulum vesicles (24
mg of protein/ml) in H,O medium containing 0.1 M KC1, 10 mM
imidazole, pH 7.4, 1 mM MgC12, and 0.1 mM CaCl,, after subtraction of the spectra of the H,O medium without sarcoplasmic reticulum. The spectra were recorded at 10 "C in a CaF, cell of 6 pm thickness and corrected for water vapor. Broken line, spectra. of sarcoplasmic reticulum vesicles (24 mg of protein/ml) in a D,O medium of otherwise identical composition, measured at 10 "C in a BaF, cell of 50 pm thickness, after subtraction of the spectrum of D,O medium without sarcoplasmic reticulum and correction for water vapor. In both cases the recording started 1 h after addition of Ca2+ to the sarcoplasmic reticulum vesicles dispersed in the appropriate standard medium.
point" parameter which can be adjusted. The validity of these procedures was tested on synthetic curves (Kauppinen et al., 1981), and both techniques are now being used extensively to resolve overlapping infrared hands in complex systems, such as lipids (Casal and Mantsch, 1984; Mendelsohn and Mantsch, 1986) and proteins (Lee et al., 1985; Renugopalak- rishnan et al., 1985; Byler and Susi, 1986; Olinger et al., 1986; Jaworsky et al., 1986; Haris et al., 1986).
Changes in the Infrared Spectra of Sarcoplasmic Reticulum Connected with the Transition between the E, and E2 Confor- mations of the Ca2+-ATPase-The Ca2+-ATPase of sarco- plasmic reticulum is stabilized in the El conformation by 0.1 mM CaC1, and in the E, conformation by 1.0 mM EGTA
+
5 mM vanadate. Fig. 2A shows the spectra of sarcoplasmicreticulum dispersed in D20 medium in the two conformational states. The naked eye is unable to detect significant differ- ences between the two spectral curves. However, subtle dif-
ferences became apparent after suitable data processing, zs
evident from Fig. 2, B and C, which show the same spectra after band narrowing, respectively, by Fourier deconvolution or Fourier derivation. In each case the solid line corresponds to sarcoplasmic reticulum in the presence of 0.1 mM Ca2+ (E1
1700 1650 1 6 0 0 1550 1500 WAVENUMBER/CM'
FIG. 2. Original, deconvolved, and derivative spectra of sarcoplasmic reticulum in DzO medium in the El and in the
E2 states. A, to sarcoplasmic reticulum vesicles (24 mg of protein/ ml) suspended in a standard medium of 0.1 M KCl, 10 mM imidazole, pH 7.4, and 1 mM MgCl,, either 0.1 mM CaCl, (solid line) or 1 mM EGTA and 5 mM monovanadate (broken line) were added to stabilize the El and E:! conformations, respectively. The spectra were taken at 10 "C ahout 1 h after the additions in a 50-pm BaF, cell. From both spectra the spectrum of D20 medium and the contribution of water vapors were subtracted. B, same spectra as in A after resolution enhancement by Fourier deconvolution, using a band narrowing factor of 2.2. C, same spectra as in A after band narrowing by Fourier derivation using a power of 3 and a breakpoint of 0.4.
9040 Infrared Spectroscopy of Sarcoplasmic
Reticulum
state), and the dashed line in the presence of 1 mM EGTA+
5 mM vanadate (E2 state). Our practice in assessing the validity of resolution-enhanced band profiles is to generate them independently by two different procedures and compare the results. Only peaks that show up in both procedures are considered. Thus, from a comparison of the resolution-en- hanced spectra we are confident that all spectral features observed as individual bands in Fig. 2B or as shoulder bands in Fig. 2C are real and represent specific conformational structures. As can be seen from Fig. 2B, the degree of band narrowing is less pronounced upon deconvolution; however, the intensities of the component bands (integrated band areas) are preserved. Upon derivation (Fig. 2C) sharper peaks are obtained, but the true line shape is lost, and the peak intensity becomes dependent on the width of the original bands. For example, the peak at 1516 cm" has the greatest intensity in the derivative spectra because it is narrower than the other bands, although it is only a small peak in the original spectrum (see Fig. 1). The advantage of derivation over de- convolution is that it allows a more precise determination of the position of component bands that appear only as shoulder bands in the deconvolved spectra.
The region 1800-1500 cm" contains bands coming from the peptide backbone of the protein, from the amino acid side chains, and from the lipid moieties of sarcoplasmic reticulum. The following regions have been chosen to analyze the con- formational differences in sarcoplasmic reticulum between the E, and E, states: ( a ) 1700-1620 cm", which corresponds to the Amide I band, that is most sensitive to conformational changes, ( b ) 1565-1535 cm", which contains the Amide I1
band, ( c ) 1620-1560 cm-l, with bands related to amino acid side chain vibrations, and ( d ) 1760-1700 cm" that gives
information about the phospholipid headgroup.
The Amide I Region (1700-1620 cm")-Fig. 3 shows the resolution enhanced infrared spectra of sarcoplasmic reticu- lum in D20 in the presence of 0.1 mM calcium that stabilizes the El state (solid line), 1 mM EGTA
+
5 mM vanadate that stabilizes the E2 state (broken line), or 20 mM calcium withoutdefinite conformational assignment (dotted line). The Amide
1700 1680 1660 1640 1620
WAVENUMBER/CM'
FIG. 3. Fourier derivative infrared spectra of sarcoplasmic reticulum in the various conformations stabilized by Ca2+ or vanadate (Amide I region). To sarcoplasmic reticulum vesicles (24 mg of protein/ml) suspended in standard D20 medium, 0.1 mM CaCL
(solid line) or 1 mM EGTA and 5 mM sodium vanadate (broken line) were added to stabilize the El and the E, conformations, respectively. In a third sample of sarcoplasmic reticulum, the Ca2+ concentration was raised to 20 mM (dotted line). Although conformational assign- ment under the latter condition is not entirely established, kinetic considerations suggest that saturation of the low affinity binding sites of Ca2+-ATPase by 20 mM Ca2+ would stabilize the E, state. The spectra were taken at 10 "C and corrected for the contributions of the D 2 0 medium and water vapor. Band narrowing by Fourier derivation was carried out as described under "Experimental Procedures."
I bands observed in the 1700-1620 cm" region of the infrared spectra of Ca2+-ATPase in the El and E, conformations are given in Table I, along with their assignment to specific secondary substructures. Whereas the spectra obtained in the presence of 5 mM vanadate or 20 mM calcium are very similar, there are differences between these and the spectrum obtained in the presence of 0.1 mM calcium. The most important of these differences is the presence of a peak at 1650 cm" in the E2 state stabilized by vanadate, that is absent in the E, state, stabilized by 0.1 mM CaC12. Surprisingly, the 1650 cm" peak reappears when the [Ca"] is raised to 20 mM. The binding of Ca2+ to the low affinity Ca2+-binding sites of the Ca2+-ATPase apparently stabilizes a conformation that is similar to the E2 state induced by vanadate.
The peak at 1650 cm", specific of the E, state, occurs in the Amide I region characteristic for a-helices and probably represents a new a-helical structure that may arise from the rearrangement of other structures during the El + E2 tran- sition. The appearance of the new 1650 cm" band in the E2 state may occur at the expense of the 1657 cm" or the 1643 cm" bands.
In the spectra of both the El and E2 conformations, the band at 1657 cm" can be assigned to a-helices, and the bands at 1630 and 1682 cm" to antiparallel P-sheet structures (Susi
et al., 1967; Cortijo et al., 1982; Mendelsohn et al., 1984; Arrondo et al., 1985; Lee et al., 1985; Jaworsky et al., 1986).
The infrared bands at 1668 and 1692 cm" are attributable to turns (Krimm and Bandekar, 1980). There is one additional band in the spectrum of the El state of Ca2+-ATPase at 1677 cm" which is absent in the spectrum of the E, state and which most likely also represents turns. Alternatively, the peak at 1677 cm" may correspond to the high frequency component of a P-sheet structure (Susi et al., 1967); this is,
however, less likely since there is no doubling of the corre- sponding low frequency component at 1630 cm" that is much stronger in intensity. In the spectra obtained in the presence of 20 mM calcium or 5 mM vanadate, the two peaks at 1683 and 1677 em-' have apparently merged into one composite peak due to a change in the position or a decrease in the intensity of one of the bands. It is more likely that the band representing turns is affected. The band at 1643 cm" is
assigned to un- (or less) ordered structures. In H 2 0 medium (not shown), the band assigned to unordered structures over- laps with the a-helix band, giving rise to a composite band at 1654.5 cm".
The Amide 11 Region (1565-1535 cm")-The Amide I1 and Amide I bands represent different vibrational modes; whereas the Amide I mode is a C=O stretching vibration, the Amide I1 mode is mainly a N-H bending vibration (Susi, 1969, 1972; Mendelsohn and Mantsch, 1986). Despite some attempts to
TABLE I
Characteristic Amide I bands from the infrared spectra of Caz+- ATPase in the El and E, conformations and their assignment
Frequencies (in cm") are from resolution-enhanced infrared spec- tra in D,O buffer and are rounded off to the nearest integer. The symbols a, @, T, and R stand for a-helices, @-structures, turns, and random structures, respectively.
E, state EP state 1630 (B) 1630 (@) 1643 (R) 1643 (R) 1650 (a) 1657 (a) 1657 (a) 1668 (T) 1668 (T) 1677 (TIP) 1683 (8) 1682 (6) 1692 (T) 1692 (T)
Sarcoplasmic 9041
correlate the Amide I1 band with the same structural patterns as established for the Amide I band, no conclusive experimen- tal results have been obtained. The position of the Amide I1 band is sensitive to deuteration, shifting from around 1550 cm” to the so-called Amide 11’ frequency at 1450 cm”. The Amide 11’ band overlaps with the H-0-D bending vibration,
so it has no value in the analysis of conformational changes. Fig. 1 shows clearly the decrease in Amide I1 intensity upon deuteration (H ”-* D exchange of the N-H groups). However,
the remainder of the Amide I1 band at 1550 cm” is a clue to the accessibility of solvent to the peptide backbone. Hydro- phobic environments or tightly ordered structures (a-helix or p-sheet) prevent the amide H from being exchanged. In Fig. 4 the residual Amide I1 bands of the two conformational states
(E1
andEz)
of sarcoplasmic reticulum are compared. It is evident that in DzO medium only the peak at 1550 cm” is left in the E, state, whereas there is a second Amide I1 peak at 1537 cm” in theE,
state. This suggests that at least some of the groups which were accessible to H .+ D exchange in the E, conformation are protected in the E, state. The vana- date-induced changes characteristic of the Ez state are re- versed on addition of 0.1 mM CaC1, that restores the spectral characteristics of the El state.Amino Acid Side C h i n Vibrations (1620-1560 cm“)-In the region 1800-1500 cm”, in addition to the protein bands attributed to the peptide backbone, some bands due to side chain vibrations are also seen (Chirgadze et al., 1975). Little is known about these vibrations and their conformational sensitivity. The 1516 cm” band due to the C-C stretching of the phenolic tyrosine ring (Fig. 2, B and C) is apparently not affected by protein conformational changes. It is interesting to note that in the region 1620-1560 cm”, where the side chain vibrations of charged amino acids occur, the spectrum of the 0.1 mM calcium sample is closer to that of the 20 mM calcium sample than to that of the sample in 5 mM vanadate. It is plausible to assume that the charged residues (i.e. the
-
COO- groups) are more sensitive to the type of cation bound than to changes in protein conformation. The bands due to sarcoplasmic reticulum protein side chain vibrations in H 2 0 and inDzO
media are similar. Some bands around 1700 cm” may correspond to the nonionized forms of the amino acids.Phospholipid Headgroup Vibrations (1 760-1 700 cm”)-The region 1760-1700 cm” contains vibrations from the ester carbonyl groups of the membrane phospholipids. In model systems two bands can be distinguished in this region that correspond to the sn-1 and sn-2 C=O groups (Bush et al., 1980; Levin et al., 1982). In natural membranes the interpre- tation may be less straightforward, since several phospholipid
1565 1560 1555 1550 1545 1 5 4 0 1535
WAVENUMBER/CM’
FIG. 4. Fourier derivative spectra of sarcoplasmic reticu- lum in DzO in the various conformations stabilized by Caz* or vanadate (Amide I1 region). The samples and conditions are identical to those described in Fig. 3.
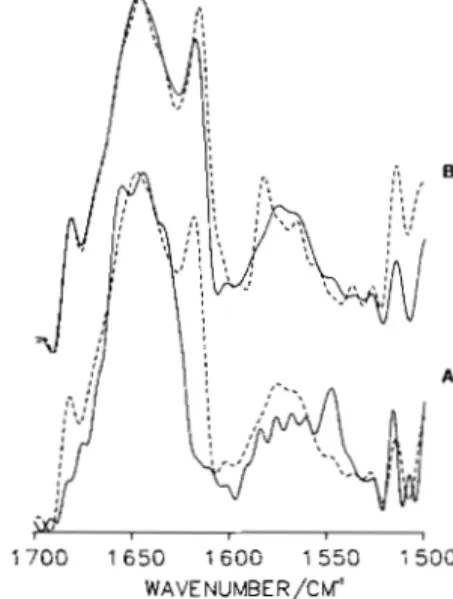
classes with different acyl chains are normally present and even some amino acid side chain vibrations can be encoun- tered in this region. Fig. 5A shows the deconvolved spectra of sarcoplasmic reticulum in the presence of 0.1 mM calcium (solid line), 20 mM calcium (dotted line), and 5 mM vanadate (broken line) in H 2 0 medium. In all three cases there are two peaks at 1741 and 1731 cm” that can be assigned to the sn- 1- and sn-2-ester carbonyls, respectively. The ratio between the 1741 and 1731 peaks is greater than 1 in the presence of 0.1 mM calcium (E,) and less than 1 in the presence of vanadate
(Ez).
There ari two additional peaks at 1750 cm” and 1717 cm” in the 5 mM vanadate and in the 0.1 mM calcium samples that are not seen in the 20 mM calcium spectrum.In order to establish whether the differences observed in Fig. 5A are due to the protein or to a direct effect of calcium on the phospholipids, the phospholipids were extracted from sarcoplasmic reticulum and their spectra compared in the presence of 0.1 mM calcium, 5 mM vanadate, or 20 mM calcium (Fig. 5B). The 1741 cm-‘ peak is observed more or less in the same position; however, in the 20 mM Ca2+ spectrum (and to a lesser extent in the 0.1 mM Caz+ spectrum) the 1731 cm” peak has split in two. The bands at 1750 cm” and at 1717 cm” which are clearly seen in the spectra of sarcoplasmic reticulum in the presence of 0.1 mM CaC1, or 5 mM vanadate (Fig. 5A) become weak shoulders in the corresponding lipid extracts (Fig. 5B).
From these data it is clear that there is an influence of the protein on the ester carbonyl groups of phospholipids, since the lipids exhibit different infrared spectra in the presence or in the absence of protein. It is not possible to attribute this to a direct effect of Ca2+ on phospholipids, since no large differences are seen under identical conditions in the ex- tracted lipid. The splitting found in the lipid extract at high calcium concentration is not observed when there is protein
, ,
‘\,.;I,
‘6 j . 1 7 6 0 1 7 4 0 1 7 2 0 1700 WAVENUMBER/CK‘FIG. 5. Infrared spectra of sarcoplasmic reticulum (A) and of the extracted sarcoplasmic reticulum lipids (B) in HzO medium under various experimental conditions after Fourier deconvolution (C=O stretching modes). A, sarcoplasmic reticu- lum vesicles (24 mg of protein/ml) were suspended in standard HzO medium and supplemented with 0.1 mM CaCl, (solid line), 1 mM
EGTA, and 5 mM sodium vanadate (broken line) or 20 mM CaClz (dotted line). Spectra were taken at 8.8-10 “C and the spectrum of H,O medium subtracted. B, sarcoplasmic reticulum lipids were ex- tracted as described under “Experimental Procedures” and suspended in standard HzO medium to a final concentration of 53 mg/ml. Additions were made and spectra recorded as described under A . Band narrowing by Fourier deconvolution was carried out as de- scribed under “Experimental Procedures.”
9042 Infrared Spectroscopy of Sarcoplasmic Reticulum
in the system. Although some buffering of calcium by proteins may occur, the differences observed between the E, and Ez states in sarcoplasmic reticulum in the vibrations assigned to the ester carbonyl bonds most probably reflect the influence of protein on phospholipids, and this influence is different when the Ca2+-ATPase is in the E, as compared with the EP state. The precise nature of the conformation-dependent ef- fect of Ca2+-ATPase on the ester carbonyl vibration of phos- pholipids is not known, but it is likely to involve the stalk region (Brand1 et al., 1986) of the Ca2+-ATPase that is close to the water-lipid interface.
The POz-stretching vibrations are not changed, which is consistent with the proposition that the differences in the carbonyl ester stretching vibrations are not due to a direct effect of the cations on the phospholipids, but reflect an influence of the protein.
The infrared spectra of delipidated sarcoplasmic reticulum (not shown) indicate gross structural changes (decrease of cy-
helix content and increase of 6-sheet and unordered struc- tures) connected with the removal of phospholipids. Based on the intensity of Amide I1 band the H + D exchange is more pronounced in native than in delipidated sarcoplasmic retic- ulum.
The Acyl C h i n s of Phospholipids-Another spectral region of interest is the 3000-2800 cm" range where the bands due to the methyl- and methylene-stretching vibrations are seen; these are related to the conformational arrangement of the acyl chains (Casal and Mantsch, 1984). In native sarcoplasmic reticulum membranes at 8-10°C, the acyl chains are in the liquid crystalline state, which is thought to be necessary to sustain the enzymatic activity of the Ca2+-ATPase. There is no difference in the CH2- or CH3-stretching band frequencies between the E, or E2 states.
Temperature-dependent Changes in the Structure of Sar- coplasmic Reticulum-Proteins undergo a temperature-in- duced denaturation that involves a major rearrangement of the tertiary structure. A nearly complete H + D exchange is observed in D20 medium upon denaturation (Englander and Kallenbach, 1984). This is also evident from the loss of the Amide I1 band at 1550 cm" upon thermal denaturation (Fig. 6A). Furthermore, new peaks appear in the Amide I region of the infrared spectra that indicate a loosening of structures. After thermal denaturation of the sarcoplasmic reticulum in DZO, the new peaks at 1619 and 1686 cm" dominate the Amide I band, and there is a decrease in the intensity at 1658
and 1630 cm". The broad peak centered at 1648 cm" prob- ably represents primarily nonordered structures together with some remnants of the secondary structures that were present in the native protein before thermal denaturation.
Fig. 6B compares the spectra of sarcoplasmic reticulum in
D20 in the presence of either 0.1 mM calcium or 1 mM EGTA
+
5 mM vanadate after thermal denaturation. In the Amide Iregion, the two spectra are similar with peaks located at 1689, 1648, and 1619 cm"; the Amide I1 is completely exchanged in both cases. In the 1760-1700 region, two peaks are visible in the presence of 0.1 mM calcium, while the 5 mM vanadate sample has only one broad band. The midpoint of denatura- tion temperature is 42 "C in the El and 50 "C in the E2 state. Therefore, 1 mM EGTA and 5 mM vanadate slightly stabilize the Ca"-ATPase against thermal denaturation. Under similar conditions vanadate also increased the stability of Ca2+-ATP- ase against inactivation by 1-2 kbar pressure (Varga et al.,
1986) suggesting a more compact structure in the Ez than in the El state. The similar profiles of thermally denatured sarcoplasmic reticulum in the presence of 0.1 mM calcium or
1700 1650 1600 1550 1500 WAVENUMBER/CM'
FIG. 6. The effect of thermal denaturation on the infrared spectra of sarcoplasmic reticulum in DzO. A, sarcoplasmic retic- ulum vesicles (24 mg of protein/ml) were suspended in a solution of
0.1 M KCl, 10 mM imidazole, pH 7.4, 1 mM MgCl, in DzO; 0.1 mM CaC1, was added, and the spectrum was recorded -1 h later at 10 "C
(solid line). Thermal denaturation was induced in a different sample of identical composition by stepwise increase of temperature to 85 "C
(broken line). Deconvolved spectra (see "Experimental Procedures")
are presented after subtraction of the contribution of the D,O me- dium. B, sarcoplasmic reticulum vesicles were thermally denatured
in standard DZO medium containing either 0.1 mM CaC1, (solid line)
or 1 mM EGTA and 5 mM sodium vanadate as described under A .
Data treatment was carried out as under A.
1 mM EGTA
+
5 mM vanadate show that the two different conformational states (E, and Ez) can only exist when the native tertiary structure is present.DISCUSSION
The FT-IR spectra of sarcoplasmic reticulum stabilized by
0.1 mM Ca2+ in the E, conformation and by vanadate in the E, conformation show significant differences. These differ- ences indicate changes in the secondary structure of the protein and in the conformation of the phospholipid ester carbonyl group related to the transition between the E, and Ez states. The -CH, and -CH3 stretching vibrations of the acyl chains of phospholipids are not affected by the transition, and there are no clearly identified changes in vibrations related to amino acid side chains in the sarcoplasmic reticu- lum proteins. Since the Ca2+-ATPase constitutes at least 80% of the protein content of sarcoplasmic reticulum, the Ca2+ and vanadate induced changes in protein secondary structure are likely to occur in the Ca2+-ATPase rather than in the acces- sory proteins of sarcoplasmic reticulum. Nevertheless, conclu- sive evidence on this point is not available and may be very difficult to obtain. Reconstituted vesicle preparations contain- ing purified Ca*+-ATPase have been widely used, but recent x-ray and neutron diffraction data indicate that the disposi- tion of Ca2+-ATPase in reconstituted vesicles is very different from that in the native sarcoplasmic reticulum (Herbette et al., 1983); therefore, it is difficult to relate with confidence structural information obtained on reconstituted Ca2+-ATP- ase vesicles to the native membranes. Ca2+-induced changes in the secondary structure of calsequestrin have been reported (for review see MacLennan et al., 1983); however, a recent Raman spectroscopic study (Williams and Beeler, 1986) casts
some doubt on these observations. In any case, calsequestrin is a minor component representing less than 5% of the protein content of sarcoplasmic reticulum used in these studies; there- fore, it is unlikely to affect significantly the FT-IR spectrum. Based on these considerations, it seems justified to assume that the observed changes in protein secondary structure involve the Ca2+-ATPase.
The El conformation stabilized by 0.1 mM Ca2+ contains less a-helix than the E, conformation stabilized by EGTA
+
vanadate. This is in essential agreement with earlier obser- vations of Arrondo et al. (1985) that Ca2+ decreases the helixcontent of sarcoplasmic reticulum, compared with an EGTA- containing, i.e. Ca2+-free, system. There is no detectable dif-
ference in @-sheet and only a slight difference in @-turn content between the El and E, conformations. These data represent the first clear indication that changes in the sec- ondary structure of Ca2+-ATPase accompany the previously observed rearrangement of structural domains within the ATPase molecule connected with the El + E, transition (Dux et al., 1985).
Previous circular dichroism studies did not indicate differ- ences in the secondary structure composition between the El and E, states in sarcoplasmic reticulum (Nakamoto and Inesi, 1986; Csermely et al., 1987). It is difficult to list the specific reasons that may contribute to these differences between circular dichroism and FT-IR data. It is likely, however, that the greater information content, better signal-to-noise ratio, less interference by light scattering, and more sophisticated data analysis by Fourier transform infrared spectroscopy per- mitted the resolution of structural differences between the E, and E, states that remained undetected by circular dichroism, although the magnitude of the structural differences seen by FT-IR is difficult to quantitate.
Surprisingly, 20 mM Ca2+ produced similar changes in the vibrational modes assigned to protein secondary structure as vanadate, suggesting stabilization of the E2 conformation at high Ca2+ concentration. Based on kinetic studies the Ca2+- ATPase in the E2 conformation has low affinity sites for Ca2+ (Inesi and de Meis, 1985). Therefore, it is plausible to assume that Ca2+ at concentrations sufficient to saturate low affinity binding sites (-20 mM) would shift the conformational equi- librium in favor of the E, form. Vanadate achieves the same effect by stabilizing an E, type intermediate at a different stage of the Ca2+ transport cycle. Such interpretation is sup- ported by recent observations of Varga et al. (1986) that the
irreversible denaturation of Ca*+-ATPase at pressures of 1000-2000 atm can be prevented or slowed either by vanadate in a calcium-free medium or by high Ca2+ concentration; at similar pressures sarcoplasmic reticulum vesicles stripped from Ca2+ by EGTA completely and irreversibly lose their enzymatic activity within minutes. These observations also imply that the mixture of enzyme conformations that exist in Ca2+-free media, although usually considered to be predomi- nantly E,, differs from the Ez conformation stabilized in a Ca2+-free system by vanadate.
There are significant differences between spectra obtained in the El and E, state in the intensity ratio of the 1741 cm-' and 1731 cm" bands that are assigned to the vibrational modes of the sn-1- and sn-2-ester carbonyl groups of phos- pholipids. This observation suggests a relationship between the conformation of the protein and that of the interfacial region of phospholipids. The methylene and methyl vibrations associated with the acyl chains of the phospholipids do not show such sensitivity.
REFERENCES
Anderle, G., and Mendelsohn, T. (1986) Biochemistry 26,2174-2179 Arrondo, J. L. R., and Goni, F. M. (1985) in Spectroscopy of Biological Molecules
(Alix, A. J. P., Bernard, L., and Manfait, M., e&) pp. 184-186, Wiley, New York
Arrondo, J. L. R., Urbaneja, M. A,, Goni, F. M., Macarulla, J. M., and Sarzala, G. (1985) Biochern. Bio hys Res Common. 128,1159-1163
Bartlett, G. R. (1959) J. ifiol.
Cheh.
2 3 4 , 466-468Blasie, J. K., Herbette, L. G., Pascolini, D., Skita, V., Pierce, D. H., and Scarpa, Brady, G. W., fein,'D: B., Harder, M. E., Spehr, R., and Meissner, G. (1981) Brady,
z.
'W:, Fein, D. B., Harder, M. E., and Meissner, G. (1982) Biophys. J.Brand, C. J., Green, N. M., Korczak, B., and MacLennan, D. H. (1986) Cell Bush, S. F., Levin, H., and Levin, I. W. (1980) Chem. Phys. Lipids 2 7 , 101- Byler, D. M., and Susi, H. (1986) Biopolymers 26,469-487
Casal, H. L., and Mantsch, H. H. (1984) Biochim. Biophys. Acta 779,381-401 Chirgadze, Y. N., Fedorov, 0. V., and Trushina, N. P. (1975) Biopolymers 1 4 ,
A. (1985) Bio hys J 48,9-18 Bioph s J 34,13-34 37,637-645 44,597-607 111 fi79-fiQA
Cortijo, M., Alonso, A., Gomez-Fernandez, J. C., and Chapman, D. (1982) J. Csermely, P., Katopis, C., Wallace, B. A,, and Martonosi, A. (1987) Biochem. Dean, W. L., and Tanford, C. (1977) J. Biol. Chem. 262,3551-3553 Dean, W. L., and Tanford C. (1978) Biochemist 17,1683-1690
Dux, L., Taylor, K. A,, Tkg-Beall, H. P., and%artonosi, A. (1985) J. Biol. En lander S W , and Kallenbach, N. R. (1984) Q. Reu. Biophys. 16,521-655 Fisfe, C. H., and Subbarow, Y. (1925) J. Biol. Chern. 66,375-400
Folch, J., Lees, M., and Sloane Stanley, G. H. (1957) J. Biol. Chem. 2 2 6 , 497-
-.1
_".
Mol. Biol. 167,597-618
J. 24 1,663-669
Chem. 260,11730-11743
K m
Cortijo, M., Alonso, A., Gomez-Fernandez, J. C., and Chapman, D. (1982) J. Csermely, P., Katopis, C., Wallace, B. A,, and Martonosi, A. (1987) Biochem.
-.1
_".
Mol. Biol. 167,597-618
.T 941 m-fica
Dean, W. L., and Tanford, C. (1977) J..Biol. Chem. 262,3551-3553 Dean, W. L., and Tanford, C. (1978) Bwchemist 17,1683-1690
Dux, L., Taylor, K. A,, Ting-Beall, H. P., and%artonosi, A. (1985) J. Biol.
Y . "A, Y"" ""I
En lander S W , and Kallenbach, N. R. (1984) Q. Reu. Biophys. 16,521-655 Fisfe, C. H., and Subbarow, Y. (1925) J. Biol. Chern. 66,375-400
Folch, J., Lees, M., and Sloane Stanley, G. H. (1957) J. Biol. Chem. 2 2 6 , 497-
Chem. 260,11730-11743
K m
Haris, P. I., Lee, D. C., and Chapman, D. (1986) Biochim. Biophys. Acta 874,
Herbette, L., Scarpa, A., Blasie, J. K., Wang, C. T., Hymel, L., Seelig, J., and Inesi, G., and de Meis, L. (1985) in The Enzymes of Biological Membranes Jaworsky, M., and Mendelsohn, R. (1985) Biochemlstry 24,3422-3428 Jaworsky, M., Brauner, J. W., and Mendelsohn R. (1986) Spectmhim. Acta Jona, I., and Martonosi, A. (1986) Biochem. J. 234,363-371
KauDDinen. J. K.. Moffatt. D. J.. Mantsch. H. H.. and Cameron. D. G. (1981)
""Il
255-265
Fleischer, S. (1983) Biochim. Biophys. Acta 730,369-378 (Martonosi, A., ed), Vol. 3, pp. 157-191, Plenum,,New York Part A Mol. Spectrosc. 4 2 , 191-198
Appl. S 'ctrosc: 3 6 , 271-276 '
. , Krimm, C a n d Bandekar, J. (1980) Biopolymers 1 9 , l - 2 9
Lee, D. C., and Cha man D. (1986) Biosc. Re 6,235-256
Lee, D. C., Haywarcf J. AI, Restall, C. J., and 8hapman, D. (1985) Biochemistry Levin, 24,4364-4373 I. W., Mushayakarara, E., and Bittman, R. (1982) J. Raman Spectrosc.
Lippert, J. 13,231-234 L., Lindsay, R. M., and Schultz, R. (1981) J. Biol. Chem. 2 6 6 ,
Lowry, 12411-12416 0. H., Rosebrough, N. J., Farr, A. L., and Randall, R. J. (1951) J. Biol. MacLennan, D. H., Brand, C. J., Korczak, B., and Green, N. M. (1985) Nature Chem. 193,265-275 MacLennan, D. H., Campbell, K. P., and Reithmeier, R. A. F. (1983) in Calcium 316,696-700 and Cell Function (Cbeung, W. Y., ed), Vol. 4, pp. 152-174, Academic Press,
New Ynrk
Mantsch H. H., Casal, H. L. and Jones, R. N. (1986) in Spectrosco of
Biologhal Systems (Clark, R.'J. H., and Hester, R. E., e&), pp. 1-46, @ley and Sons, Chichester
Martonosi, A., and Beeler, T. J. (1983) in Handbook of Physiology. Skeletal Muscle (Peachey, L. D., and Adrian, R. H. eds), Section 10, pp. 417-485, Mendelsohn, R., Anderle, G., Jaworsky M. Mantsch, H. H., and Dluhy, R. A. American Physiological Society, Bethesda, MD Mendelsohn, R., and Mantsch, (1984) Bwchim. Biophys. Acta 776, H. H. (1986) in Progress in Protein-Lipid h i 2 4
Interactions (Watts, A., and DePont, J. J. H. H. M., e&), Vol. 2, pp. 103- 146, Elsevier Scientific Publishing Co., Amsterdam
Moffatt, D. G., Kauppinen, J. K., Cameron, D. G., Mantsch, H. H., and Jones, R. N. (1986) Computer Program or Infrared Spectrophotometry, NRC Muga, A,, Valpuesta, J. M., Arrondo, J. L. R., and Goni, F. M. (1986) J. Mol. Bulletin No. 18, pp. 1-111, Ottawa, Janada Nakamoto, R. K., and Inesi, G. (1986) Strut. 143,465-468 FEBS Lett. 194,258-262
Olinger, J. M., Hill, D. M., Jakobsen, R. J., and Brody, R. S. (1986) Biochim. Bwphys. Acta 869,89-98
Renugopalakrishnan, V., Horowitz, P. M., and Glimcher, M. J. (1985) J. Biol.
Chem. 260,11406-11413
Susi, H. (1969) in Structure and Stability of Biological Macromolecules (Ti- masheff,
s.,
and Fasman, G., e&), pp. 575-663, Marcel Dekker, New York Susi, H., Timasheff, S. N., and Stevens, L. (1967) J. Biol. Chem. 2 4 2 , 5460-Susi, H. (1972) Methods Enzymol. 26,455-472
Taylor K. A Dux, L., and Martonosi A. (1986a) J. Mol. Biol. 187,417-427
Taylor: K. A:: Ho, M. H., and Marton& A. (1986b) Ann. N Y Acad. Sci. 4 8 3 ,
- . - . . - - - "
5466 21 -A2
Vaiia;s., Mullner, N., Pikula, S., Papp, S., Varga, K., and Martonosi, A. (1986) Williams, R. W., and Beeler, T. J. (1986) J. Biol. Chem. 2 6 1 , 12408-12413 Williams, R. W., McIntyre, J. 0.. Gaber, B. P., and Fleischer, S. (1986) J. Biol.
J. Biol. Chem. 2 6 1 , 13943-13956 Chem. 2 6 1 , 14520-14524