HAL Id: hal-02945917
https://hal.archives-ouvertes.fr/hal-02945917v2
Submitted on 30 Oct 2020
HAL is a multi-disciplinary open access
archive for the deposit and dissemination of
sci-entific research documents, whether they are
pub-lished or not. The documents may come from
teaching and research institutions in France or
abroad, or from public or private research centers.
L’archive ouverte pluridisciplinaire HAL, est
destinée au dépôt et à la diffusion de documents
scientifiques de niveau recherche, publiés ou non,
émanant des établissements d’enseignement et de
recherche français ou étrangers, des laboratoires
publics ou privés.
Longitudinal comparison of subjects with and without
Sleep Disorders in Parkinson’s Disease
Raphäel Couronné, Arnaud Valladier, Marie Vidailhet, Jean Christophe
Corvol, Stephane Lehericy, Stanley Durrleman
To cite this version:
Raphäel Couronné, Arnaud Valladier, Marie Vidailhet, Jean Christophe Corvol, Stephane Lehericy,
et al.. Longitudinal comparison of subjects with and without Sleep Disorders in Parkinson’s Disease.
VPH 2020 - Virtual Physiological Human, Aug 2020, Paris / Virtual, France. �hal-02945917v2�
VPH2020 Conference, Paris 26-28 August 2020
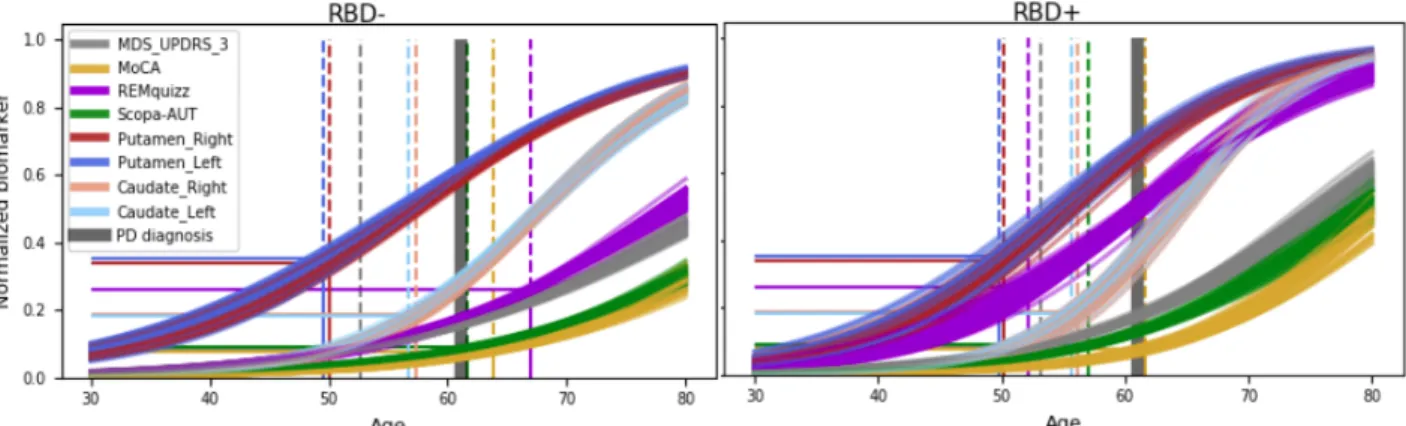
Figure 1: Cross validated (10x5) average scenario of progression for the 2 subgroups, relative to
age. Abnormality thresholds (straight lines) are mapped to the corresponding age of occurrence (dotted lines). Note the major difference for the REM-quizz (chosen split criterion).
Longitudinal comparison of subjects with and without Sleep
Disorders in Parkinson’s Disease
R. Couronné
a,b,1, A. Valladier
a,b, M. Vidailhet
b,c, J.C. Corvol
b,c, S. Lehéricy
b,d,
S. Durrleman
a,ba
Inria, Aramis project-team; b
ICM, Inserm U 1127, CNRS UMR 7225, Sorbonne Universite, F-75013, Paris, France; c
Department of Neurology, ICM; dCentre for Neuroimaging Research (CENIR)
Keywords
:
Longitudinal study, disease progression model, subgroup comparison, Parkinson’s Disease1. Introduction
Patients with Parkinson’s Disease (PD) may have very different patterns of progression, corresponding to distinct disease subtypes. Here, we describe quantitatively the overall pattern of progression in subgroups of PD by using a Bayesian non-linear mixed effect model that describes the continuous progression of biomarkers at both population and individual level. This approach allows to model variability in progression patterns and disease stage between patients. We analyzed two subgroups of patients, with (RBD+) and without sleep disorders (RBD-), that are known to present different patterns of progression [1]. We compared the two groups by extracting the ordering of abnormalities that occurred over the disease course, and by studying their disease onset and speed of progression.
2. Methods
2.1 Data
We used the Idiopathic PD patients of the PPMI Dataset. We considered eight biomarkers to describe the disease progression. First four clinical scores, the MDS-UPDRS part III, MoCA,
1
Corresponding author. Email: raphael.couronne@inria.fr
SCOPA-AUT and REM-quizz, measuring respectively motor, cognitive, autonomy and sleep dysfunctions. Second, we included four measures from DatScan imaging, the Striatal Binging Ratios (SBR) of left and right side of both Putamen and Caudate. From the 362 idiopathic PD patients of the PPMI dataset, we excluded patients that had less than two visits of the biomarkers to obtain 349 patients. Patients that reached a REM-quizz score of 6 over 9 at least once over the course of the study were labeled as REM+ (94 patients), the others as REM- (249 patients).
2.2 Modeling approach
We used a multivariate non-linear Bayesian mixed-effect model, introduced in [2] and extended in [3], to estimate the longitudinal progression of clinical and imaging scores. We estimated both population and individual parameters of patients, to obtain the average and individual trajectories, respectively. Sub-group trajectories were obtained by averaging individual parameters over the patient sub-groups. Then, to assess the robustness of our method, accounting for both sampling bias and stochastic variations in the estimation algorithm, we performed a patient-wise repeated cross validation (10x5 folds) on our dataset.
VPH2020 Conference, Paris 26-28 August 2020
2.3 Average progression RBD+ RBD-
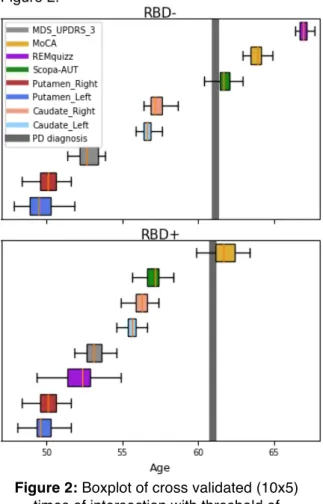
With the methodology described above, we obtained 50 sub-population average trajectories for each group (RBD- and RBD+), shown in Figure 1. To build a hierarchy of arrival of abnormalities of PD biomarkers that may progress at very different speeds and occur at different ages, we introduced abnormality thresholds. For each biomarker independently, thresholds were computed from the data as the optimal cut-off for a balanced logistic regression between PD patients and controls at baseline. We then computed the times of intersection between the averaged trajectories of the sub-groups and these abnormal thresholds to assess an abnormality timing density for each modality. Densities are shown as boxplots in Figure 2.
Figure 2: Boxplot of cross validated (10x5)
times of intersection with threshold of abnormalities for each considered biomarker. Average age of conversion to PD is mostly the
same for both groups.
3. Results and discussion
The ordering of abnormalities between modalities in the two groups was the same, at the exception of REM-quizz since it discriminated our 2 groups (Figure 2). The first abnormality was observed in the putamen, followed by MDS-UPDRS part III then, caudate,
scopa and finally MoCA. Note that MDS-UPDRS abnormality occurred early, as even few points of MDS-UPDRS label patients as PD in our logistic regression. Thus, we could also consider the age at disease onset, mainly based on motor scores, to represent a more advanced stage of motor abnormality. Noticeably, the distance to PD average age at diagnosis differed between the two subgroups. In RBD- patients, autonomic dysfunction occurred shortly after conversion to PD, whereas in RBD+, the SCOPA-AUT was already abnormal up to 4 years before conversion. To a lesser extent, MoCA abnormalities occurred earlier in RBD+ than in RBD-. Finally, considering only the individual parameters estimated by the model, we found that RBD+ were affected in average 6 years earlier than RBD-, and progressed 30% faster in average.
4. Conclusions
Using a longitudinal model, we were able to compare two sub-populations of a longitudinal cohort in several ways: progression speed, age at onset and ordering of abnormalities. RBD+ were affected 6 years earlier and progressed 30% faster. They also presented autonomic dysfunction up to 4 years before PD diagnosis whereas these symptoms occurred around PD onset in RBD- patients.
These results stand as a proof of concept for longitudinal group comparison methodology, which could be applied to other types of diseases. Furthermore, this first subgroup analysis lay the foundations of a more precise subtyping of patterns of progression in PD.
5. Acknowledgements
The research leading to these results has received funding from the program "Investissements d’avenir" ANR-10-IAIHU-06. This work was funded in part by the French government under management of Agence Nationale de la Recherche as part of the "Investissements d'avenir" program, reference ANR-19-P3IA-0001 (PRAIRIE 3IA Institute).
6. References
[1] R. B. Postuma, A. E. Lang, J. F. Gagnon,
A. Pelletier, J. Y. Montplaisir. How does
parkinsonism start? Prodromal
parkinsonism motor changes in idiopathic REM sleep behaviour disorder. Brain,
VPH2020 Conference, Paris 26-28 August 2020
Volume 135, Issue 6, June 2012, Pages1860–1870
[2] J.-B. Schiratti, S. Allassonnière, O. Colliot, S. Durrleman. A Bayesian mixed-effects model to learn trajectories of changes from repeated manifold-valued observations.
Journal of Machine Learning Research,
18(133):1-33. 2017.
[3] R. Couronné, M. Vidailhet, J.C. Corvol, S. Lehéricy, S. Durrleman. Learning disease progression models with longitudinal data and missing values. ISBI. 1033-1037. 2019.