HAL Id: hal-00553405
https://hal.archives-ouvertes.fr/hal-00553405
Submitted on 9 Mar 2011HAL is a multi-disciplinary open access
archive for the deposit and dissemination of sci-entific research documents, whether they are pub-lished or not. The documents may come from teaching and research institutions in France or abroad, or from public or private research centers.
L’archive ouverte pluridisciplinaire HAL, est destinée au dépôt et à la diffusion de documents scientifiques de niveau recherche, publiés ou non, émanant des établissements d’enseignement et de recherche français ou étrangers, des laboratoires publics ou privés.
Application of a hemodynamic model to epileptic spikes
Nicole Voges, Solenna Blanchard, Fabrice Wendling, Olivier David, Habib
Benali, Théodore Papadopoulo, Maureen Clerc, Christian Bénar
To cite this version:
Nicole Voges, Solenna Blanchard, Fabrice Wendling, Olivier David, Habib Benali, et al.. Application of a hemodynamic model to epileptic spikes. Cinquième conférence plénière française de Neurosciences Computationnelles, ”Neurocomp’10”, Aug 2010, Lyon, France. �hal-00553405�
APPLICATION OF A HEMODYNAMIC MODEL TO EPILEPTIC SPIKES
N. Voges (1,2), S. Blanchard (3) , F. Wendling (3), O. David (4), H. Benali (5), T. Papadopoulo (2), M. Clerc (2), C. Bénar (1)
(1) INSERM U751, Aix-Marseille Université, 27 Bd Jean Moulin, 13005 Marseille, France, [email protected]
(2) INRIA, Sophia-Antipolis Méditerranée, 2004 route des Lucioles, 06902 Sophia-Antipolis, France (3) INSERM U642, Université de Rennes 1, Campus de Beaulieu - Bat 22, 35042 Rennes, France (4) INSERM, U836, Grenoble Institut des Neurosciences & University Hospital, Chemin Fortuné Ferrini, 38043
Grenoble, France
(5) INSERM U678, CHU Pitié-Salpêtrière & Université de Paris 6, 91 Bd de l'Hôpital, 75634 Paris, France
ABSTRACT
Despite the interest in simultaneous EEG-fMRI studies of epileptic spikes, the link between epileptic discharges and their corresponding hemodynamic responses is poorly understood. We applied two biophysical models in order to investigate the mechanisms underlying the neurovascular coupling in epilepsy: a metabolic hemo-dynamic model, and a neural mass model that simulates epileptic discharges. Analyzing the effect of epileptic neuronal activity on the BOLD response we focussed on the issues of linearity and on the origin of negative BOLD signals. In our BOLD simulation results both sub- and supra-linearity occur one after another. The size of these effects depends on the spike frequency, as well as on the amplitude of the excitatory part of the neural input. For the hemodynamic model used in this study, we found that the sign of the BOLD response is mainly determined by the area under the curve descri-bing the excitatory neural activity. Therefore, a strong deactivation following the initial peak of the excitatory time course of an epileptic spike is necessary to obtain a negative BOLD.
KEY WORDS
hemodynamic model, neural mass model, epileptic spikes, BOLD linearity, negative BOLD
1. Introduction
The present study is a step towards a better understand-ing of the link between epileptic spikes and their BOLD responses, which is necessary to improve the interpreta-tion of simultaneous EEG-fMRI recordings [1,2,3]. Such measurements combine the high temporal resolu-tion of EEG with the high spatial resoluresolu-tion of fMRI
re-cordings. We apply the metabolic hemodynamic model (MHM) suggested in [4,5] to epileptiform neural activ-ity. One specific feature of neurophysiological record-ings in epilepsy is the interictal epileptic spike, i.e. a short period of strongly increased excitatory activity, outside of seizures. The spike shapes show a certain variability, e.g. depending on the recording session, the spatial position of the electrode, or the type of epilepsy [3,6]. Including information about the shape of such in-terictal discharges can improve the detection of fMRI correlates [7]. In order to specifically analyze the neur-ovascular coupling in epilepsy we couple a neural mass model (NMM) that simulates realistic epileptiform neural activities [8,9] to the MHM. The two main issues we are focusing on are (1) the question of linearity in BOLD signals, and (2) the source of negative BOLD re-sponses to epileptic spikes. The latter point is of partic-ular interest because interictal epileptic discharges are a marker of neuronal hyper-excitability which is gener-ally related to a BOLD increase. Here, we investigate the influence of the spike shape on the sign of the BOLD response. Originally, the General linear model (GLM) is used in processing and analyzing experiment-al data from simultaneous EEG-fMRI recordings [10,11], resulting in a linear prediction (LP) of the BOLD response. Such a procedure incorporates only the linear part of the neurovascular coupling. However, there are hints for non-linear correlations between neur-onal and hemodynamic responses [12,13,14]. In particu-lar, concerning the localization of epileptic regions, lin-earity is an important issue [11]: using the GLM if BOLD signals were non-linear would reduce the detec-tion sensitivity.
2. Methods & Results
The general settings, e.g. baselines bl or signal units, used in this study are mostly adopted from [4,5]. It is
bl=0 for the BOLD signal [%], and bl=1 for all neural activities [a.u.], i.e. for the excitatory (exc.) and inhibit-ory (inh.) parts, as well as for the original output of the NMM.
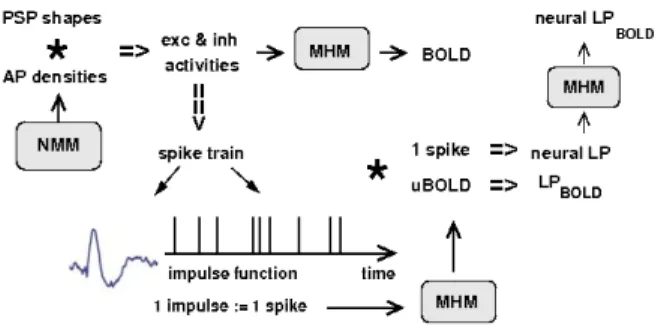
We initially assumed simple rectangular impulses of w=0.5s length that represent interictal epileptic dis-charges. They are stringed together in order to represent burst of spikes. The exc. amplitudes range from eA=2 up to eA=10 while the inh. amplitudes are iA=(eA-1)/2. We also vary the inter-spike-intervals from dt=0.5s up to dt=9s. As in the GLM, the LP of the BOLD response to a spike train is calculated as follows (see Fig.1): The extraction of the spike times of the spike train leads to the impulse function fimp. It isfimp (ti)=1 for the first point in time of each spike, and fimp(ti)=0 otherwise. Then, the BOLD response to a single input impulse is simulated, here called unit BOLD response (uBOLD), and con-volved with fimp: LP = fimp * uBOLD. The difference between the signal and its LP characterizes the non-lin-earity of the BOLD signal simulated with the MHM. To assess these deviations quantitatively for spike trains of 30s duration we calculated the area under the curve of the residual, normalized by the global maximum of the actual BOLD signal:
Σi |BOLD(ti)-LP(ti)|/BOLDmax , for all time steps ti, <tb, and
Σi |BOLD(ti)-LP(ti)|/BOLDmax)/fl, for ti, >tb,
with the intersection time tb that separates the BOLD response into two parts (vertical line in Fig. 2A) and a factor fl that accounts for the different lengths of part I and part II. In part I (ti, <tb), the simulated BOLD signal behaves linearly or sub-linearly (BOLD<LP), in part II (ti,>tb) it is linear or supra-linear (BOLD>LP). The size of both effects depends on the spike frequency (1/dt), as well as on the amplitude of the exc. activity (eA), as shown in Figures 2C and 2D. The phase space plot in Fig. 2B indicates that the border between part I and part II (tb) also depends on dt and eA: higher frequencies and larger exc. amplitudes lead to a longer lasting sub-linear behaviour (part I). Within the first 7 to 12s the BOLD response is sub-linear in case of high
Fig. 1: Scheme representing the coupling and the differ-ent signal types we generated with a neural mass and a metabolic hemodynamic model (NMM and MHM). Ex-cept for the upper left corner, it also applies for the rect-angular input impulses used in the first part of this study.
frequencies and large amplitudes. In part II, the signal turns to supra-linearity, but again only for small dt and high eA.
Secondly, in order to investigate the neurovascular coupling with respect to more realistic epileptiform neural signals, we coupled a simplified version of the NMM in [8, 9] to the MHM. The original outputs of the NMM are the summed post-synaptic potentials (PSPs) of the exc. population, representing SEEG recordings, here called LFP (local field potential). We plugged one NMM to one MHM, assuming that the neural activity in one cortical region (a voxel of approx. 1mm3) causes one isolated hemodynamic response. We convolved the incoming action potential densities at exc. (inh.) syn-apses with the average shape of the exc. (inh.) post-syn-aptic potentials (cf. Fig. 1) defined by the input para-meters of the NMM. Then each pre-processed NMM output was normalized according to its baseline. In Fiures. 3A and 3B we present two exemplary spike shapes that result from this procedure. They show dif-ferent time courses in terms of the LFP output (dotted lines), but the curves of the exc. activities are rather similar. For example, the large undershoot after the peak in the LFP in Fig. 3B is predominately the result of a delayed inhibition, rather than a particularly large undershoot in excitation. The BOLD output of the MHM in [4,5] mainly depends on the exc. activity, therefore the corresponding two BOLD signals in Fig. 3C are very similar. Fig. 3D shows the BOLD response to the epileptic spike train in Fig. 3E. Due to the vari-ations in the frequency of spike occurrences, the BOLD signal constantly changes between supra- and sub-lin-earity. Note that at t~26s the LP indicates a slightly negative BOLD whereas the actual BOLD signal is pos-itive. For this spike train we additionally calculated the
Fig. 2: Comparison of the BOLD signal and its LP for a 30s spike train consisting of rectangular input impulses. (A) Exemplary BOLD response, its LP and the uBOLD of the first spike (dt=1, eA=6). The vertical line indic-ates tb, i.e. the border between supra- and sub-linearity. (B) Phase space plots describing how tb shifts in time, depending on dt and eA. (C, D) Phase space plots for part I (C) and II (D) describing the deviation from lin-earity (indicated by the color code) in dependence of dt and eA.
neural LP (cf. Fig. 1), i.e., the average spike of a spike train is convolved with its impulse function, and fed into the MHM. If a spike train were based on a non-lin-ear superposition of single spikes, this neural LP would clearly deviate from the actual BOLD signal. However, this is not the case. Thus, this example indicates that the deviations from linearity originate predominately from the neurovascular coupling.
We found that the variability of the exc. time course of the NMM spikes is rather limited (cf. Figures 3A and 3B). In addition, the NMM does not allow for a con-trolled variation of the features characterizing the shape of an epileptic spike. Therefore, we used another, sim-plified approach to investigate the influence of the shape of an epileptic spike on the sign of the BOLD re-sponse. We simulated artificial spikes (see Fig. 3F) whose exc. time courses are separated into three parts: a first peak p, an undershoot u, and a possible slow wave w. Inhibition is included via delayed peak. Each part is characterized by an amplitude A and a duration Δt. For a given ratio between exc. and inh. peak amplitudes (ri=0.5 with eA=2), we varied the amplitude ratio eA/uA from 1.5 to 100, the duration ratio Δt(p)/Δt(u) from 0.166 to 100, and the size of the slow wave (eA/wA, Δt(p+u))/Δt(w) from (1, 1.5) to (100, 200). After feeding these signals into the MHM we determ-ined the extrema of the corresponding BOLD responses. In addition, we calculated the areas under the exc. and inh. curves:
areaexc = ΣT1 exc(ti) - ΣT2 exc(ti) + ΣT3 exc(ti),
with T1=Δt(p), T2= Δt(u), T3=Δt(w), and
areainh = ΣT inh(ti), with T=T1+T2+T3.
Figure 3G shows the extremal values of the correspond-ing BOLD responses to these differently shaped spikes in dependence of areaexc (and, for a comparison, also in dependence of areaexc-areainh). Most of the artificial spikes lead to a positive simulated BOLD response. Only if the area of the exc. undershoot is larger than the sum the areas of the peak and the slow wave, a negative BOLD signal is possible. Yet, even if there is a negative BOLD response, its minimum is relatively small com-pared to the maximums of the BOLD increase. The maximums obtained with the MHM of [4,5] exhibit a linear relationship to areaexc, while the values of the BOLD minimums immediately saturate for larger neg-ative values of areaexc.
3. Discussion & Conclusion
We investigated the BOLD response of the MHM pro-posed in [4,5] with respect to epileptic spikes. The spikes can occur isolated or in short bursts. Concerning such bursts we found a non-linear behavior that in-creases for large exc. amplitudes (typical for epilepsy), and for highspike frequencies. The sub-linearity of the first part of the BOLD signal and its stimulus depend-ence is a well-known feature [11,12,13] .
Fig. 3, left: (A,B) Two exemplary spike shapes generated with the NMM and their corresponding BOLD signals (C) gen-erated with the MHM. (E) BOLD response, its (neural) LP to the spike train in (E) from which the average spike shape S3 was calculated. Right: (F) Schematic representation of the time curves of exc. and inh. activity constituting an epi-leptic spike. (G) Maximum and minimum of the BOLD response to differently shaped spikes in dependence of the area under the time curves of exc. and inh. neural activities.
Most studies agree on a linear relationship for stimulus durations or inter-spike-intervals longer than approxi-mately 4 to 6s, and a sub-linear behavior for shorter per-iods. The supra-linearity in the second part is surprising with no direct experimental evidence. Yet, such a chan-geover is not necessarily detectable by a mere compari-son of BOLD signals to different activation durations, i.e., without calculating the LP [12,14]. Moreover, there are some findings that indirectly support our findings. Our results indicate that the supra-linearity is induced by the negative part of the uBOLD response (cf. Fig. 2). Similarly, Birn et al. [15] found that the BOLD decrease on stimulus cessation was smaller that linearly expec-ted, opposite to what has been reported for its increase, and Deneux & Faugeras [12] mention nonlinear effects in the post-stimulus undershoot. With respect to epilep-tiform activity, Bagshaw et al. [11] reported the absence of the linearly predicted plateau for particularly long lasting events (in addition to the sub-linear effect). For the interpretation of combined EEG-fMRI data, such an additional supra-linearity may significantly impact the detection of epileptic regions, and, in the worst case, lead to a false negative BOLD detection (Fig. 3D). We had difficulties in simulating differently shaped spikes with the NMM. This topic was not the original focus of the model adapted from [7,8] who aimed at re-producing the transformation between interictal and ic-tal activity, in particular in terms of the frequency do-main. Our simulations indicate similar BOLD responses for very different LFP spikes, because of very similar exc. signals and the domination of excitation in the MHM [4,5]. As a consequence, the most important fea-ture is not the actual shape of the spike but rather the time-course of excitatory activity. Indeed, a negative BOLD response occurs only for epileptic spikes inclu-ding a large undershoot in excitation but how realistic is such an assumption? High firing rates of exc. neurons may induce strong inh. feedback that, in combination with a pronounced exc. refractory period, may lead to such a strong decrease in excitation. The absence of a BOLD decrease for spike shapes that include a third slow wave is, however, in disagreement with [3] who suggest that negative BOLD occurs predominantly for SEEG signals that contain a high amount of low fre-quencies (i.e. slow waves). Yet, it is not possible to spe-cify whether these low frequencies are based on posi-tive or negaposi-tive slow waves.
In addition, it is important to note that any kind of elec-trophysiological recording (EEG, LFP etc.) is only an indirect representation of the neural activites inducing a BOLD signal. A spike recorded by an EEG electrode is presumably based on the activities of many interconnec-ted NMMs (larger spatial scale). Let us, for example, consider two spatially separated NMMs (only one of them, NMM1, exhibits epileptiform activity) that are coupled by an inhibitory link. Then each epileptic spike of NMM1 inhibits the ongoing background activity of NMM2. Based on the the low spatial resolution of EEG compared to fMRI recordings we assume just one com-bined EEG signal for both NMMs but two separate fMRI signals. Thus, one would obtain one positive (due
to NMM1) and one negative BOLD response (related to NMM2). The investigation of the neurovascular coup-ling would presumably benefit from simulations includ-ing a more detailed neuronal network model that in-cludes a spatial component [16]. In particular we sug-gest to avoid a direct coupling between EEG and BOLD signals, but to calculate them separately from the under-lying neural activities.
Acknowledgments
This study was supported by a postdoctoral fellowship from INRIA Sophia-Antipolis to N.V.
References
[1] J. Gotman, E. Kobayashi., A.P. Bagshaw, C.G. Bén-ar, F. Dubeau, Combining EEG and fMRI: A mul-timodal tool for epilepsy research. J. Magn. Reson.
Imaging, 23, 2006, 906-920.
[2] L. Lemieux, A. Salek-Haddadi, O. Josephs, P. Al-len, N. Toms, C. Scott, K. Krakow, R. Turner & D.R. Fish, Event-related fMRI with simultaneous and con-tinuous EEG: description of the method and initial case report. NeuroImage, 14(3), 2001, 780-787.
[3] C.G. Bénar, C. Grova, E. Kobayashi, A.P. Bagshaw, Y. Aghakhani, F. Dubeau & J. Gotman, EEG-fMRI of epileptic spikes: concordance with EEG source localiza-tion and intracranical EEG, NeuroImage, 20, 2006, 1161-1170.
[4] R.C. Sotero & N.J. Trujillo-Barreto, Modelling the role of excitaory and inhibitory activity in the genera-tion of the BOLD signal, NeuroImage, 35, 2007, 149-165.
[5] R.C. Sotero & N.J. Trujillo-Barreto, Biophysical model for integrating neuronal activity, EEG, fMRI and metabolism, NeuroImage, 39, 2008, 290-309.
[6] J. M. Fernandez, A. Martins da Silva, G. Huiskamp, D.N. Velis, I. Manshanden, J.C. de Munck, F. Lopes da Silva & J.P.S. Cunha, What does an epileptiform spike look like in MEG? Comparison between coincident EEG and MEG spikes, J. Clin. Neurosci. 22, 2005, 68-73.
[7] A. Salek-Haddadi., B. Diehl, K. Hamandi, M. Mer-schhemke, A. Liston, K. Friston, J.S. Duncan, D.R. Fish, & L. Lemieux, Hemodynamic correlates of epilep-tiform discharges: An EEG-fMRI study of 63 patients with focal epilepsy. Brain Research 1088, 2006, 148-166.
[8] F. Wendling, J.J. Bellanger, F. Bartolomei & P. Chauvel, Relevance of nonlinear lumped-parameter models in the analysis of depth-EEG epileptic signals.
[9] F. Wendling, A. Hernandez, J.J. Bellanger, P. Chauvel & F. Bartolomei, Interictal to ictal transition in human TLE: insights from a computational model of in-tracerebral EEG, J.Clin. Neurophysiol., 22(5), 2005, 343-356.
[10] K.J. Friston, A.P. Holmes, K.J. Worsely, J.P. Poline, C.D. Frith & R.S.J. Frackowiak, Statistical para-metric maps in functional imaging: a general linear ap-proach, Hum. Brain Mapp., 2, 1995, 189-210.
[11] A.P. Bagshaw, C. Hawco, C.G. Bénar, E. Kobay-ashi, Y. Aghakhani, F. Dubeau, G.B. Pike & J. Gotman, Analysis of the EEG-fMRI response to prolonged bursts of interictal epileptiform activity, NeuroImage, 24, 2006 1099-1112.
[12] T. Deneux & O. Faugeras, Using nonlinear models in fMRI data analysis: Model selection and activation detection, NeuroImage, 32, 2006, 1669-1689.
[13] Z. Liu, C. Rios, N. Zhang, L. Yang, W. Chen & B. He, Linear and nonlinear relationships between visual stimuli, EEG and BOLD fMRI signals, NeuroImage,
50, 2010, 1054-1066.
[14] H.G. Glover, Deconvolution of impulse responses in event-related BOLD fMRI. NeuroImage, 9, 1999, 416-429.
[15] R.M. Birn & P.A. Bandettini, The effect of stimu-lus duty cycle and off duration on BOLD response lin-earity. NeuroImage, 27, 2005, 70-82.
[16] N. Voges & L. Perrinet, Phase space analysis of networks based on biologically realistic parameters, J.