CLOSING OF THE NASA ELECTRONICS RESEARCH CENTER A STUDY OF THE REALLOCATION OF SPACE PROGRAM TALENT
by
ROBERT HARVEY ROLLINS II B.S., University of Illinois
(1957)
M.S., University of Illinois (1958)
SUBMITTED IN PARTIAL FULFILLMNT
OF THE REQUiREMENTS FOR THE DEGREE OF MASTER OF SC IENCE at the MASSACHUSETTS INSTITUTE OF TECHNOLOGY e , 9 'f) Signature Certified of Author. . . .. ... ** *0 Alfred P. Sloan School of Manaie iEt71ay 21, 1970
by. . . ...
Thesis Supervisor do A#
Accepted by.... ... . . -.-.. ... .... . . . ..
Chairman, Departme tal Committee on Graduate Students
ABSTRACT
CLOSING OF THE NASA ELECTRONiCS RESEARCH CENTER A STUDY OF THE REALLOCATION OF SPACE PROGRAM TALENT
ROBERT HARVEY ROLLINS II
Submitted to the Alfred P. Sloan School of Management on May 21, 1970, in partial fulfillment of the requirements for the degree of Master of Science in Management.
Four-hundred and thirty-six scientists and engineers employed by the Electronics Research Center of the National Aeronautics and Space Administration were displaced by the
closing of the Center, located in Cambridge, Massachusetts, on July 1, 1970. The attitudes and behavior of these aero-space professionals were studied during a period of four months, during which time they were actively searching for new employment and the Center was being reestablished with
a new role in the transportation field.
Management of the Center provided a wide range of vices to aid the employees in their job search. These ser-vices, which assisted employees in making contacts with em-ployers outside as well as inside the federal government, are discussed and evaluated for the benefit of other organi-zations involved in a layoff of high-technology personnel. A technique for rapid distribution of employee
characteris-tics which is also useful for job market survey is described. Profiles of the employees educational, job classifica-tion, salary and age characteristics are supplied and these characteristics are used to compare employment success. Fields of education and specialization in which employment difficulties were found are delineated. The impact of age,
experience, salary and degree attainment on employment
suc-cess are evaluated.
A brief description is given of the successor organi-zation, the Transportation Systems Center of the United States Department of Transportation, and of the employees absorbed by that establishment. Comparisons are made of the two-hundred and ten professional employees offered
employ-ment in the new Center and the employees who had found other employment or were still looking a tthe end of the study. Thesis Supervisor: Donald G. Marquis
ACKNOWLEDGEMENTS 3
The useful suggestions, criticism and abiding patience
of the members of my Thesis Committee, Professors Donald G.
Marquis and D. Quinn Mills, are sincerely acknowledged. The interest shown by Professor Charles A. Myers and other mem-bers of the faculty is also appreciated.
I wish to thank the Personnel Officer of the Electronics Research Center, Mr. John P. McLaughlin, and his entire staff for their splendid cooperation and assistance during the
per-iod of my research
Special thanks go to Mr. Robert T. O'Neil, Head of the ERC Outplacement Team, for his acceptance of this ad hoc mem-ber of his team, the use of his office and other team memmem-bers during the study, his intimate knowledge of the employees of
the Center, and his cooperation in the development of ques-tionnaires and forms which provided the data upon which this disertation is based.
Miss Mary E. Noble and Mrs. Frances 0. Tracy, of the Interview Center, rendered valuable assistance in keeping the myriad records of that activity and preparing and
dis-tributing questionnaires.
Mrs. Patricia R. Shea, Mr. Ernest E. Gaiser, and Miss Ann Wolff, who worked in the Information Center, were very cooperative in recording the results of the many contacts made with prospective employers.
TABLE OF CONTENTS
CHAPTER PAGE
I INTRODUCTION
7
11 STUDY METHODS 11
ill THE ELECTRONICS RESEARCH CENTER
114
IV PERSONNEL POLICIES 24;
V THE ERC OUTPLACEMENT PROGRAM 27
VI THE SEARCH FOR A JOB
52
ViI THE TRANSPORTATION SYSTEMS CEN4TER
1.
ViII
ANALYSIS OF PLACEMENTS 55IX CONCLUSION
BIBLIOGRAPHY
67
APPENDIX
A ERC OUTPLACEMENT SURVEY
69
B INTEREST & EXPERIENCE STATEMENT
73
C ERC OUTPLACEMENT PROGRAM MEMORANDUM
15
D ERC EXIT INTERVIEW QUESTIONNA1RE
77
E TECHNICAL SUPPLEMENT 8
79
5
LIST OF TABLESTABLE PAGE
1 BUILDUP OF PERSONNEL AND FACILITIES, 1964-1969 15 2 CLASSIFICATION OF ERC SCiENTiSTS AND ENGiNEERS 1)
3
SALARIES OF ERC SCIENTISTS AND ENGINEERS 20 4 AGE AND EDUCATION OF ERC SCIENTISTS AND ENGiNEERS 21 5 EXPERIENCE OF ERC SCIENTISTS AND ENGINEERS 226
RANKING OF JOB SEARCH TECHNIQUES-INITIAL34
QUESTIONNAIRE
7
RESPONSES TO INITIAL OUTPLACEMENT SURVEY37
8 INTEREST AND EXPERIENCE STATEMENT SUBMISSIONS39
AND PREFERENCES
9 NUMBER OF iNTERViEWS PER PROFESSIONAL IN THE
41
FIVE ERC ORGANIZATIONS10 RELATiON OF SALARY TO INTERVIEW FREQUENCY
43
AMONG ERC SCIENTISTS AND ENGINEERS
11 RANKING OF JOB SEARCH TECHNIQUES-FiNAL
47
QUESTIONNAIRE12 DiSTRIBUTION OF ELECTRONICS RESEARCH CENTER 54
PROFESSiONALS
13 DISPLACEMENT OF ERC SCIENTISTS AND ENGiNEERS 56
14 PERCENTAGE DISPLACEMENT OF ERC SCIENTISTS AND 57
ENGINEERS
15 DISTRIBUTION OF DEMAND AND PLACEMENT BY BACHELORS DEGREE
16 DISTRIBUTION OF DEMAND AND PLACEMENT BY 61
JOB CLASSIFICATION
17 AGE SALARY EXPERIENCE, AND SUPERVISORY
63
LIST OF FIGURES FiGURE
1 ORGANIZATiON OF THE ELECTRONICGS RESEARCH
CENTER
2 RETURNS FROM INTERVIEW QUESTiONNAiRE
3 ORGANIZATION OF TRANSPORTATION SYSTEMS CENTER
18
45
53
PAGECHAPTER I INTRODUCTION
On December 2, 1969, the Administrator of the National Aeronautics and Space Administration, Dr. Thomas 0. Paine, visited the NASA Electronics Research Center in Cambridge, Massachusetts. Dr. Paine met with the employees of the Cen-ter to announce that, because of changes in NASA priorities, the Center was to be closed.1 The meeting was held in the newly-occupied Auditorium Building, the first of a complex of new facilities being constructed for the Center which was
ready for use.
On January
8,
1970, the employees of the Center, num-bering approximately 900, were notified that they would be separated from service with the National Aeronautics and Space Administration at the close of business on June30,
1970, the date set for closing of the Center.2 The notice of reduction in force indicated that if any of the functions of the Center were transferred to another NASA activity or any other federal agengy, employees identified with such transferred functions would be offered an opportunity to accompany the function.
1Robert Creamer, "NASA Center to Close in '70", Boston Herald Traveler, December
30,
1969, p. 1.2James C. Elms, Director Electronics Research Center
"Reduction in Force Notice",
letter
to employees, Januaryb,
This study was proposed to provide information on a topic of current interest; the reallocation of scientific and engineering personnel as they are displaced from govern-ment-supported aerospace programs. Almost one-half of the employees,
436
in number, were classified as scientists and engineers, and it is this group which provided the data uponwhich this study is based.
The object of the study is to determine the impact of the closing on the individual aerospace professional. The adaptability of employees in various job classification cate-gories and with a wide range of educational and experience levels to find employment in and out of the aerospace field was of primary interest. Fulfillment of the desires of the employees regarding geographical location, employment field, and income maintenance were also of interest. Finally, the techniques used, and the employees ratings of these tech-niques, in the search for new positions were surveyed to provide guidance for others in similar situations.
Because the closing was announced during a period when public support of aerospace goals was declining, it was be-lieved that a study of this nature would provide information
on the adaptability of professionals in that field to trans-fer their skills into new areas. The NASA has long held that much of the aerospace technology developed in its pro-grams is adaptable to other fields. If that hypothesis is true, the employees involved in the production of advances
in the state-of-art should be in demand in other fields.
The more basic research conducted as a prelude to applica-tion in aerospace programs should have even more general adaptability to a number of fields, thus it was assumed that the scientists would have more opportunity to carry on basic work under other sponsorship than engineers involved in ap-plications.
During the period from January 8, to May 11, 1970, the
job search activities of the employees were observed through access to records of the personnel office at the Center and discussions with employees of the Center and employers hold-ing placement interviews at the Center. Information on edu-cational background, job description, salary, and experience was made available from records. Several questionnaires
were used to determine preferences for new jobs and loca-tions, search techniques, and other information not avail-able from the personnel records.
One event had a major impact on the study. After a long period of speculation by employees, based on newspaper
reports and rumor, the Secretary of the United States
Depart-ment of Transportation, John A. Volpe, visited the Center and announced that the facility and a majority of its em-ployees would be taken over by his organization.3 The transfer was announced to be effective on July 1, 1970,
3A.
S. Plgtkin, "Cambridge Center Shiftin Research to Transportation , The Boston Globe, March 26, 1970, p. 1.1 0 the day after the formal closing of the Center by the NASA. The basis for this action by the Department of Transporta-tion kDOT) lay in the need for advanced development support of national transportation goals, the availability of the Center, and the applicability of some of the work being con-ducted to transportation programs. Almost one-half of the professional employees being studied were invited to apply for transfer to the new organization.
11
CHAPTER Il
STUDY METHODS
The location of the Electronics Research Center (ERC) near the campus of the Massachusetts Institute of Technology made it possible to observe first-hand the activity described
in this study. With the full cooperation of the Center's personnel office, the author was provided with office space, clerical assistance, and access to records.
The first survey of employee attitudes was made through a questionnaire distributed to every eigth person on an alpha-betical employment roster effective December
31,
1969. The questionnaire is exhibited in Appendix A. Distribution was made on January 22, 1970, and the return percentage was ap-proximately30
percent. Analysis of the returns is Made in Chapter VI.On January
6,
1970, the Personnel Officer had distri-buted a memorandum to all employees announcing the institu-tion of an outplacement program4 Employees desiring to participate were requested to submit an "Interest and Ex-perience Statement", or short resume, on the form repro-duced in Appendix B. This statement, which was eventually submitted by over 70 percent of the employees, indicated their geographical preference, preference for non-federalhJohn P. McLaughlin, "Job Placement Program", ERC
or federal employment, and through its submission, indicated that the employee was actively searching for employment
through the auspices of the Center-sponsored placement acti-vity. Discussion of the use of information supplied on this statement is found in Chapters V and VI.
A number of organizations expressed interest in hiring
the employees to be displaced by the Center closing. An
information center was established in the personnel office to
handle these inputs. In addition, other organizations were
solicited regarding employment opportunities. An interview center was opened to allow interested employers the oppor-tunity to talk with ERC employees at the Center. Complete records were kept so as to identify the organizations hold-ing interviews, and number of employees interviewed. At a
later date, the interviewing organizations were queried by
mail to determine the results of their meetings. This acti-vity is discussed in Chapter V.
All information regarding employment interviews at ERC was published and distributed to employees. The information was catagorized as being applicable to individuals with: 1) clerical, 2) administrative, or
3)
technical backgrounds. The name, location, and contact individual for each organi-zation was listed with brief descriptions of the existing vacancies. More detailed information was held available for reference in the information center. All opportunities were listed, regardless of plans for on-site interviews, and the13 employees were encouraged to contact organizations directly. Employers who did not conduct on-site interviews were later contacted regarding the results of the listings and these
re-sults are discussed in Chapter V.
The activities of employees who did not file "Interest and Experience Statements" and/or who did not interview at the interview center were surveyed by another questionnaire.
(Appendix C) This information indicated the interviewing frequencies both inside and outside of the Center as well as
offers received, mail solicitation by employees, and comments on the placement program. Discussion of this data may be found in Chapters V and V1.
A final questionnaire was prepared and given to each employee as part of his clearance procedure as he separated from the Center. (Appendix D) Information regarding job
selection, search technique, and employee attitude is dis-cussed in Chapter VI.
Finally, the author spent a great deal of time at the Center in discussions with the employees and in preparation of statistical information included in this study and used by the Center in managing the outplacement activities.
CHAPTER III
THE ELECTRONICS RESEARCH CENTER
During the earliest years of the space program, from 1)57 through 1960, there was a growing recognition that
elec-tronics capability was one of the major pacing items in the
development of the sophisticated systems being planned. In
1961, the Office of Electronics and Control was created in the NASA and assigned the task of coordinating and strength-ening the electronics research being carried out. A study of the NASA's electronics capability reached the conclusions
that: 1) space needs required increased attention by elec-tronics research organizations throughout the nation, and 2) greater electronics research capability and competence was
required within the NASA.
Four alternatives to provide space electronics capa-bility were investigated: 1) more research at existing NASA Centers, 2) concentration of research at one of the existing Centers with major expansion at that site, 3) increased ef-fort at non-NASA installations, and 4) a new Research Center for Electronics. The fourth alternative was selected and, in the budget submitted to the Congress in January 1965, a request for $5,000,000 was made to enable construction of a NASA Electronics Research Center in the Boston area.
Legislation was passed authorizing the establishment of the Center conditional to transmittal to the Congress a study
in detail the geographic location of, the need for, and the nature of, the proposed Center. A report of the study was transmitted to the Congress on January
31,
1)64, and provides the basis for comparison of original planning and actual growth of the Center.5 The Center was officially established in Cambridge on September 1, 1964.Projected and actual buildup of personnel is compared in Table 1. Funding plans and actual expenditures for facil-ities are also shown. It is obvious that the Center had suf-ferred from a stunted growth pattern long before the decision to close was made.
TABLE 1
BUiLDUP OF PERSONNEL AND FACILiTIES, 19-1y69
Fiscal Year tends June 30) 1964 1965 1966 1967 1968 1969 Personnel Planned 50 250 550 1000 1600 2100 (Number) Actual 33 238 555 791 950 893 Facilities Planned $ 5.0 10.0 19.6 13.9 8.5 -0-(Millions of Dollars) Actual $ 2.8 10.5
5.3
7.5
-0-The original plans called for about one-third of the staff to be professional scientists and engineers, supported by technical personnel amounting to
43%
of the complement,5"Electronics Research Center, Report of the National Aeronautics and Space Administration", Committee Print, House Committee on Science and Astronautics, U. . Govt. Printing Office, Washington, D. C., January
31,
194.16
and administrative and general support of 24%. The actual
percentages as of December
31,
1969, were 50% professional, 14% technical support, and36%
other support. These figures are close to those proposed for the earlier years of Center growth and reflect the reduced size of the facility in which most of the technical support personnel would have been em-ployed.Plans for the professional staff called for
54%
to be in the fields of Electrical and Electronic Engineering,32%
in Physical and Classical Sciences, and 14% in other fields. Final figures showed only 27% with Electrical and Electronic Engineering degrees, and 47% having degrees in the Sciences,
while 26% had degrees in other areas of engineering and in
the arts. Advanced degree holders comprised
65%
of the staffat closing, a very large increase over the 26% originally
an-ticipated as desirable., These data indicate that consider-able changes in the research needs of the NASA occurred as
the Center evolved.
The early organization of the Center was horizontal, with ten laboratories, each covering a discipline in elec-tronics.6 These laboratories each had responsibility for de-veloping ideas and putting them into practice, but had tended to concentrate on the former, which led to the high concen-tration of scientists. In 1968, the Center was reorganized
6
James K. Glassman "What's at Stake if NASA is Cut",!~EII
17
into three technical directorates which progressed frombasic to applied research with some development. (Figure 1) Evidently, during the earlier growth of the Center the bias toward scientific personnel was even stronger, as most of the scientists were assigned to the largest of the
director-ates, Research.
Table 2 provides a profile of employees by job classi-fication. Of the
436
scientists and engineers on the staff,418
were classified in the Aerospace Technology field and 18 in supporting areas. Within these classifications, there was a further breakdown into 47 aerospace and7
supporting areas, the support categories shown at the end on the table. These classifications are provided as they are moredescrip-tive of the work performed than information on educational field.
Distributions of the staff within the organizational divisions by salary, age, education, and experience are pro-vided in Tables
3
through5.
The average age of the profes-sional was58.1
years, average salary $18,165, and averageexperience (years since first degree) was 15.1 years. The
oldest df the four operating organizations, in terms of both age and experience, was the Administration Directorate, with
67%
of the professionals over the average age and experience levels. The youngest organization was the Technical Programs Directorate, with only 36 and 29 percent over the age andp
RESEARCH ADVANCED TECHNOLOGY TECHNICAL PROGRAMS
DIRECTORATE DIRECTORATE DIRECTORATE
ORGANIZATION OF THE ELECTRONICS RESEARCH CENTER
OFFICE OF THE DIRECTOR A ADMINISTRATION DIRECTORATE . Figure 1.
TABLE 2
CLASSIFICATION OF ERC SCIENTISTS AND ENGINEERS NUMBER OF EMPLOYEES Flight Systems Space Sciences 1 Aeronomy 1 Ionospheres 1
Fields and Particles 1
Meteoroid Studies 2
Solar Studies
Physiological Studie s Human Performance Studies
Manned Systems Engineering 1
Fluid & light Mechanics 2
Flight Mechanics
6
Control & Guidance Systems
46
Magnetofluidynamics
Basic Properties of Gases 2
Materials & Structures 2
Basic Properties of Materials 55
Aerospace Polymers
Electrical Propulsion & Power 2
Direct Energy Conversion
8
Flight Systems Reliability
Fli ht Systems Test
Quality ssurance 2
Electrical Systems 8
Measurement & Instrumentation
47
Measurement & Inst. Systems
6
Space Optics
33
Measurement Standards & Calibration 1
Control Systems 1
Tracking & Telemetry Systems Electronics Engineer
Telemetry Systems 1
Telecommunications 2
Electronics of Materials 11
Microwave Physics Electronics 25
Data Systems Data Analysis
Theoretical Simulation Technology
Data Equipment 11
Experimental Facilities & Equip.
7
Experimental Tooling & Equipment
6
(Table continued on following TITLE 19
LOW
SALARY* 2J4 15 1513
HI GH SALARY* 226
16 2116
28 1 9 20 17 1 2 2 1 2 2 22 2 1 20 22 22 216
30
22 2014
2 2 22 20 22 27Z 20 page ) 1512
1I
1lTITLE Director Project Manager Technical Management Technology Utilization General Engineer Safety Engineer Architect Civil Engineer Mechanical Engineer Electrical Engineer Industrial Engineer NUMBER OF EMPLOYEES 1 10 1 1 HIGH SALARY* 2 2 18 16 18 18 21 18 17 LOW SALARY* 20 14 18 15 *Salary in thousands of dollars
TABLE 3
SALARIES OF ERC SCIENTISTS AND ENGINEERS ORGANIZATIONAL DIVISION Less than $10 000 $1 0000 to 1 000 1 000 to 000 l1,000 to 16 000 1 000 to 18,000 18,000 to 20,000 20,000 to 2 000 2000 to 2000 2. 000 to 2I 000 More than 2 b000 A D P R T ALL 11
A
-
11
1 12 1 2 1 2 1 8 1910
6
509
20 2 1 8 12 2 27
31 1 TABLE 2 (Continued)TABLE
4
AGE AND EDUCATiON OF SCIENTISTS AND ENGINEERS EMPLOYED AT THE ELECTRONICS RESEARCH CENTER
Organizational Division Age, in years 20 - 25 25 - 30 30 - 35 35
-
4o40
-
45
45 - 50 50 - 5555
-69
60 - 65 Over65
Education A D P R T All - - 4 6 11 21 5 - 18 22 18 63 4 - 21 32 18 75 6 1 20 38 2994
11 1 18 19 - 9 2820
69
1559
7
1 2 12 1032
2 - 16
8 17 - 1 1 1 - 2 103
27 109)25
8 27 Engineering Other Bachelor's Degree Master's Degree Doctor's Degree No Degree3
Total Employees in Division 43
2
64
54
60
205 - 2 2 5 17 136
2952
145
13
3
48
50 41 155 - 1 8 86 37 132 - 15
93
165 130 Science 65 214 --Organizational Division Years since Bachelor's
Degree 0-
5
5 - 10 10 - 15 15 - 20 20 - 25 A D P R T All 17
6
10 - 9 - 23 - 30 1 15 10 2640
36
11 1 10 22 15 26 25 2635
82 101 88 19 63 Over 25Years of Federal Service
0-
3
0- 5 5 - 10 10 - 15 15 - 20 20 - 25 Over 25Years of NASA Service
0-
5
5 - 10 Over 10 25 17 15
3
5
31
1963
16
10 - 152
39
2
34
15 7860
12 1 13 15 - 5 - 1I 2754
57
58 169163
11 527
22 - 13 - 1 1 1 2 703
20 - 3 11349
3
98 32 308 1217
TABLE 5EXPERIENCE OF SCIENTISTS AND ENGINEERS EMPLOYED AT THE ELECTRONICS RESEARCH CENTER
23 organization, the Research Directorate, enjoyed first place, while the Administrative Directorate was lowest, with only
32
percent of its employees receiving more than the average wage.The official announcement that the Center was to close
was made to the employees on December 29, ly69. Dr. Paine
said, "We are being forced to close. . . . We find that we must effect reductions and consolidations across the board if we are to reshape our programs to meet the nation's
fu-ture needs in aeronautics and space. . . . We are simply
faced with the fact that NASA cannot afford to invest broad-ly in electronics research as we have in the past. . . ."7, 8
Dr. Paine also noted that efforts would be made to find some other government use for the Center.
7
Electronics Research Center News Release
69-26,
December 29,CHAPTER IV PERSONNEL POLICIES
The official policy regarding layoffs of federal civil service employees is known as "Reduction in Force".) Under this policy, the employee has a number of rights. In the case where an installation is being reduced in strength, but not
closed, there are procedures which take into account senior-ity, prior military service, area of work or specialty, and other considerations. In the case of the Electronics Research Center, where no employees were to be retained, certain rights to employment elsewhere in NASA and other federal agencies exist.
Separated employees may register for preferential treat-ment in the filling of vacancies at other NASA facilities.
If openings exist in the employee's classification elsewhere in NASA, he must be given preference over other non-NASA ap-plicants. The employee must register for this consideration and is given preference for up to six months from the date of registration. This register is called the "Stopper List".
Employees may also register for preferential
considera-tion by other agencies through the "Displaced Career Employee" program of the Civil Service Commission.
9"Adjustment of the Workforce" NASA Handbook
3250.2,
The minimum notice of separation possible under civil service regulations is thirty days; the maximum, ninety days.
To allow employees additional time to avail themselves of Reduction in Force benefits, an exception to the ninety-day limit was made so that notice of separation could be issued on January
9,
1970, rather than April 1.Severance payments are made to all employees not trans-ferred to other federal positions or eligible for retirement annuities. These payments are made on the basis of length of service and age. One week's pay for each year of service up to ten years, and two weekts pay for each year over ten years are given as the basic allowance. For each year the employee is over forty years of age, the basic allowance is increased by five percent. Payments are made at the employee rate of pay in effect at separation at regular pay periods until the allowance is depleted, regardless of employment status unless another federal job is taken. The maximum al-lowance is one year's pay.
Employees are also eligible for payment for unused va-cation at separation and for refunds of their contribution to the federal retirement plan (if desired, funds may be left in the retirement plan and will pay an annuity at a later date)
Under the provisions of the NASA procedures, any em-ployee with five years of civilian federal service is
2) is age 50 or older and has at least 20 years of service,
3)
has a total of 25 years of service, including Military service, with no age restriction, or4)
is totally disabled.Of the
43
6 professional employees under study, 223 registered for the "Stopper List" within NASA. Only 103 registered for the preferential treatment available through the Civil Service Commission, perhaps because very few em-ployees had long civil service experience records (Table5)
and a number of other federal layoffs were in progress in the local area. Three employees had decided to retire, and only four more were eligible amongst the group that wasstill looking for employment at the end of the study.
In addition to the regularly proscribed placement pre-ference programs discussed above, the Center personnel office undertook to provide the employees with direct assistance in securing employment outside the federal government. These efforts are described in the following Chapter.
27
CHAPTER V
THE ERC OUTPLACEMENT PROGRAM
Center employees were invited to participate in an outplacement program sponsored by the Personnel Office. On January
6,
17O, the employees were provided with the "In-terest and Experience Statement" exhibited in Appendix B, and were informed of the procedures to be followed in the program.10 The Personnel Office was to serve as a clearing house for job information in all fields. The statements submitted by employees were filed in an information center for perusal by interested employees. Later in the program, the statements were used to prepare condensed employeede-scriptions, called "mini-resumes", which were mailed to in-terested employers. Response to the program was enthusias-tic, with thirty percent of the employees submitting
state-ments in the first two weeks. Within a month, over half of
the Center's employees had submitted, and a final count
showed over seventy percent of the initial group of employees
had filed. The professionals under study, as a group, were less active than other employees in their participation, with a final filing percentage of sixty-two percent.
In addition to maintaining information on employee in-terests and experience, the information center compiled lists
28 of prospective employers with existing vacancies. This effort was initiated in response to the influx of inquiries from a
large number of organizations regarding the availability of ERC employees. It grew into a listing service, which pub-lished four periodically updated lists of employment oppor-tunities classified as: 1) clerical, 2) administrative,
3)
technical, and 4) employment agencies. In the technicalarea, which included opportunities for non-degree technicians as well as scientists and engineers, the list eventually grew to include over
300
employers.11 A sample page from thetechnical list is shown as Appendix E. These lists were dis-tributed and posted on bulletin boards and employees were counseled to make direct contact with the employers listed. No absolute count of employee contacts made through the
list-ings was possible, but most employees indicated that they had been used to provide telephone numbers, names, and ad-dresses for direct, telephone and mail contacts.
Prospective employers were requested to provide more detailed information about vacancies than what was included on the published lists. This information was kept on file in the information center for review by employees. The
ma-jority of initial contacts by the information center staff we made by telephone to insure currency of information
listed, using the form shown in Appendix F for recording llFrancis H. Huron, "Revised listing of technical po sitions", ERC Memorandum, February 5, 1970. kwith additions)
2-9 initial contact data. After the early influx of outside in-terest in employee availability had died down, the staff be-gan to solicit employers in the local area and large orbe-gani- organi-zations in the electronics field on a nation-wide basis. ERC employees were also requested to provide information to the staff on known vacancies for use by other employees.
In addition to the information center operation dis-cussed above, an interview center was also established. As prospective employers made contact or were contacted, they were invited to schedule a period during which interested ERC
employees could meet them and discuss employment. A suite of offices in one of the new buildings was used for that pur-pose, and provided many of the employees with their first op-portunity to visit that new facility. Over 70 employers took advantage of the invitations and over 1100 interviews were held during the spring. The professional staff under study provided the majority of the interviewees, and 720 interviews were included in the data for this analysis. Of the
436
pro-fessionals, 244 participated in the interview program. The scheduled interviews were somewhat sensitive to salary range, with 62% of the employees in the less-than-$22,000 rangeparticipating, and only
35%
of the higher paid employeescontacting employers by this method.
The true value of the interview program is difficult to assess because of the number of employees who had received offers as a result of interviews but had not made employment
30 decisions during the period of the study. Employers who
held interviews indicated that approximately 50 offers were made, while employees separating indicated only a fraction
of that number, indicating that a number of offers were still outstanding.
The preparation of "mini-resumes" was mentioned previous-ly. These short, one-paragraph employee descriptions were listed in the same three categories as the lists of employ-ment opportunities. The lists were then mailed to
organiza-tions interested in hiring for posiorganiza-tions in those areas. This effort resulted in requests for further information about 179 of the 271 employees who had filed for that type of assistance. A total of
593
requests were handled for the professional employees. These results only reflect the contacts made through the information center; employers were also informed that they could reach employees directly by mail and through the Center switchboard by telephone. Asthese requests were passed on to the employees for personal follow-up, tangible results of the procedure were only avail-able if employees volunteered the information. The demand for further information is compared by job specialty and de-gree field in Chapter VIII.
The employees that had not filed interes statements were surveyed to encourage participation and determine what
search techniques they were using. The same survey form
31 in the interview program. Results of these surveys are dis-cussed in the next Chapter.
Members of the outplacement staff held counseling ses-sions with the majority of the Center staff. A typical meet-ing would be held in the employee's work area with from fif-teen to thirty employees at a time. Short descriptions of the services available were given, and questions answered on all placement and separation procedures.
The final step in the placement program was a survey of employees ma as they separated. Results of the survey were used to evaluate the programs and to provide
CHAPTER VI THE SEARCH FOR A JOB
The reaction of one employee to the December 29th
meet-in was immediate. He immediately went to the Personnel
Of-fice, located in the same building, and tendered his resig-nation, effective that afternoon. Most employees were not so well prepared for the announcement of closing and attrition
grew slowly. At the end of the period under study, only
99
of the436
professionals under study had been separated or had announced decisions regarding separations. Formalof-fers to join the staff of the new DOT organization taking over the facility had not been issued, but 211 of the em-ployees had just received invitations to apply. Many of the 126 remaining employees had been delaying decisions pending these invitations from the DOT and it was expected that the decision rate would climb almost immediately. Because many employees had feared that offering information regarding job offers might impact their opportunities with the new organi-zation, no attempt had been made to overtly gather this in-formation. The majority of the discussion in this Chapter
is based on data from job search activities and from those employees who had announced employment decisions prior to May 11, 1970.
Several investigatory areas will be discussed. The
33
employee preferences, and preference information from the
resumes filed for the placement program are tabulated. Pub-lic and private interviewing and other methods used by
em-ployees to locate new employment will be surveyed. Finally,
the results of exit interviews will be discussed.
The initial survey of employees was made by the ques-tionnaire exhibited in Appendix A. This form was sent to over one hundred employees; thirty-five returns were receiv-ed. Because of the length of the questionnaire and the poor response by employees, it was decided to gather most of the information desired from the employees as they left the Cen-ter. A second questionnaire(Appendix D) was used during the separation process and is discussed later in this chapter.
The first several questions in the initial question-naire were designed to rate job search techniques. Table
6
shows the response from questions three through seven. The almost overwhelming preference for use of professional as-sociates and friends is evident. This preference has also been noted in other studies of technical placement activity.12 The high rating given the ERG listing service was thought to 1312Leslie Fishman and others, "Reemployment Experiences of Defense Workers: A StAtistical Analysis", U. S. Arms
Con-trol and Dev. Agency, ACDA/E-11, USGPO, December, 1968, pp. 24-27.
13FOlteipr F Hltzsan o "Whit aid Blue ColLars in a
Mill Shutdown , IIR Paperback No.
6,
Cornell University, April, 1968.TABLE
6
RANKING OF JOB SEARCH TECHNIQUES - INITIAL QUESTIONNAIRE
Technique Be st 1 Effectiveness Rating 2
3
45
Worst6
Weighted Average RankTechniques Used to Search
Next Present Previous Position Position Position
Family Friends Profes sional Associates Newspaper Adverti sement Magazine Advertisement ERC Listing Empi oyment Age ncie s Radio Conmercial - - - - 5 5.16
6
6
2
153
- 2 3 - 2 - 1 3 2.61 - - - 1.61 13
4
4.31
- 3 55
9
5
3
3
5
-.10
- )4 2.86 1 13
3.00
- - - 2 3 t 5.22 21 25 18 13 23 10---o-
)-reflect a desire of the employees to use the placement ser-vices provided by the Personnel Office and helped to
sup-port the expansion of that activity. At the time the initial questionnaire was distributed, only a few employees had been successful in finding new positions and it was believed that more valid responses regarding search techniques would be made upon successful completion of the search. A comparison of
the results of the initial survey with the results of the separation questionnaire will be found later in this Chapter.
Response to question 8 showed a majority of employees desiring to remain in the service of the federal government, with
68%
responding in that area, more than half of thatnumber indicating a desire to remain with the IASA. Most of
the other responses indicated a preference for industrial positions, with electronics leading aerospace by a 20% mar-gin. Education received as many responses as Aerospace in-dustry, and, not surprisingly, there were no indications of a desire for military service.
A slight preference was shown for remaining in the aerospace field, with
45%
desiring to stay,55%
desiring to leave, and 20% with no preference. Most of those desiring to stay in the field listed their interest or experience inaerospace, while those desiring to leave indicated that the lack of stability or the existance of higher priorities in
36
in their response to Question 10, employees showed a sensitivity to the shifting emphasis in public demands on the federal government. Over one-third of the responses were in the environmental area, including such fields as airand water pollution, environmental control, oceanography, and earth resources. A slightly smaller response was
elicit-ed for programs in the transportation area. Only three
re-sponses were tallied for the Department of Defense, surpris-ing because of the closely related technical activity
con-ducted in that Department.
Electronics and computers led the response to Question 11. Several listed aerospace and manufacturing, and one re-spondent desired a position as a stock broker. Most of the responses to the education question were in the teaching area, in college or vocational school.
Table
7
lists percentages for the yes and no questionsbeginning with number 15. It is evident that the respon-dents had a higher participation and interest in the ERC placement programs than the average, because even early in the program they had exceeded the participation averages
existing at the end of the study.
Twenty percent of the respondents had lost previous jobs because of layoffs; almost half of them had been fed-eral employees at the time. Only one response to the
QUESTION 13. Do a. b. C. d. TABLE
7
RESPONSES TO INITIAL OUTPLACEMENT SURVEY
PERCENTAGE RESPONSE
YES NO
you have access to:
RC lists of interested employers? ERC interview schedules?
ERC NEWS special editions?
Adequate employment information?
14. Do you know where the Personnel Office is? 15. Do you know where the Interview Center is?
16. Have you prepared your own resume? 17. Have you submitted an Interest and
Experience Statement?
18. Have you submitted a IEASA Outplacement Application?
19. Is your Personal Qualification Statement
updated for application to federal jobs?
20. Do you prefer to:
a. Remain in this commuting area?
b. Remain in Massachusetts?
c. Remain in New England?
d. Move koutside of New England) 21. Have you lost a previous job because
of a general layoff?
57. Do you own your home?
30.
Do you have a college or university degree?97
100 100 8297
80 87 13 81 1961
39)
63
37
73
12
9
'6
19
81
63
37
80 203
0 0 18 20and that was for a three-year phaseout of another federal installation. All respondents were given time off for
terviewing, but only one-third had had the benefit of
in-plant interviews. Most of the respondents were given some severence pay and were paid for unused vacation.
The "Interest and Experience Statement" data on em-ployee preferences is shown in Table 8. As stated before, only 62 percent of the professional employees submitted these resumes and thus showed less interest in the place-ment program than the average employee. With over 70% of the total Center complement completing these statements, it must be assumed that the professionals thought that the pro-gram had less to offer to them. The low submission percen-tage from the personnel of the Administration Directorate may have been due to the fact that this group was oriented more to the general support of the Center than to its
tech-nical mission and felt that employers would be looking for the technical specialties that gave the Center its name.
The high percentage of submissions from the Research group probably reflected the feeling that the association with the Center would be a good drawing card in their search for employment. Research employees also faced the highest probability of displacement because their specialties were less directly applicable to some of the plans under discus-sion for utilization of the Center's facilities.
TABLE 8
INTEREST AND EXPERIENCE STATEMENT SUBMiSSiONS AND PREFERENCES
Organizational
Response A D P Directorate R T Science Engin.Degree
Number of Employees Statements Submitted Percent Submitting Type of Employment Federal Only Federal Preferred Total, Federal Any Employment
43
5
93
165
130
20 2 57 11947
40
21473
143
61 72 62 12 22 17 2 52 118 206 120 16456
8 27167
58 50 627
21 2879
145
16
23 1173
55
30
9 6 168 91 GeographyBoston Area Only
Boston Preferred Total, Boston New England Only
New England Preferred
Tota , New England
103 63 119
Other All Totals%
9
2
246
30 18 38 565
10 15 10 18 286
11 17 18 6 17
11 186
20 268'6
129 2 15 2 6 16 3116
10
241
Any Location7
21979
40 Employees were more loyal to their geographic situation than to their employer. Almost twice as many employees pre-ferred jobs in the New England area as did upon jobs with the
federal government. Both federal employment and local
geo-graphic preference were highest among the employees in Admin-istration, reflecting the age and experience levels of these employees shown in Tables
4
and 5. Theseh-igh levels mayal-so have impacted the total submissions from this group, with employees preferring to conduct their own search on familiar ground.
The most professional organization, the Research Direc-torate, showed the least loyalty to geography, indicating that their specialization might require them to relocate, or, perhaps, that a job in their specialty was more impor-tant than its location. The researchers were also low in
employer loyalty, only being exceeded by the Technical
Pro-grams organization which had a lower average of federal and NASA service.
Fifty-six percent of the professional employees were interviewed at the interview center set up by the Personnel Office. Data indicating the number of interviews per
em-ployee is shown in Table 9. Between 21 and 24 percent of the total had only one interview, with almost no trend evident by organization. The Advanced Technology group kT) fared
somewhat better on an overall basis, with 60 percent of the group having at least one interview and a slightly higher
TABLE 9
NUMBER OF INTERVIEWS PER PROFESSIONAL IN THE FIVE ERC ORGANIZATIONS
Number and Percentage of Employees by Organization Number of Interviews 10 23 5 12 - - 22 24 - - 10 11 21 13 22 27 21 20 16 56 1 2 1 20 2 5 8 8 6 28 - - 5 5
6
4
8
6
21 5 - - - - 2 2 3 2 3 1 2 1 2 - -5
3 6 4 - - - - 1 1 10 More than 10 1 2 1 2 1 2 2 2 123
' -o 1 1 - - 1 1 1 1 3 2 - - 2 2 - - 1 1 3 - - 1 1 2 2 2 80 4245
74
45
52 40 Total Interviews74
Interviews/Employee 1.72#
All % 2213
8 2 None 206
1
1.33 150 1.61 192255
1.5544
238
1.76 7201.65
42 average number of interviews per employee. This slight trend may indicate a better job market for employees in the "T"
group, but it is far from conclusive. Taken together with
the interest expressed in Table 8, the trend indicates some disparity in favor of the "T" organization compared with the
R't group.
A more definite trend is observed when interview fre-quency is compared with salary. Table 10 shows peak activity at the $20,000 level with a sharp reduction above $24,000. This trend indicates either a dearth of opportunity for the
higher-paid employees or a position related hesitancy of
senior employees to apply for normal interviews. The lat-ter is suspected to a certain extent, as a number of the
sen-ior personnel were observed to meet with the interviewers outside of the interview center. Age, related to salary, was probably a factor in the drop-out of senior people, al-though the second-highest average number of interviews was in the oldest organization (A). It should be noted that that group had the highest number of employees not inter-viewing at all, perhaps related to age and salary.
During the period of the study, questionnaires
kAppen-dix C) were sent to employees who had not filed resumes or
attended interviews at the Center. The questionnaires were
meant to stimulate interest in the placement program as well
1
TABLE 10
RELATION OF SALARY TO INTERVIEW FREQUENCY AMONG ERC SCIENTISTS AND ENGINEERS
Salary Number of Employees Percentage Number of Average
Employees Interviewed Interviewed Interviews
$9-10,000 8 4 50 8 1.0 10-11,000 1 1 100 2 2.0 11-12,000 18 10
56
24 2' .3 12-13,00014
9
64
23 2.6 13714,000 22 9 41 22 1.0 14-15,000 28 17 6155
?.0 15-16,000 22 14 63 42 1.9 16-17,000 5031
62 114 2.3 17-18,000 58 37 64 98 1.7 18-19,000 25 13 52 29 1.2 19-20,000 29 19 6657
Z.0 20-21,00031
2374
63
2.0 21-22,00034
2368
76
z.3
22-23,000 145
36
15 1.1 23-24.,00030
1447
39
1.3 24-26,00031
1239
*46
-0.6
26-33,000 213
14
7
0.3 Totals436
24456
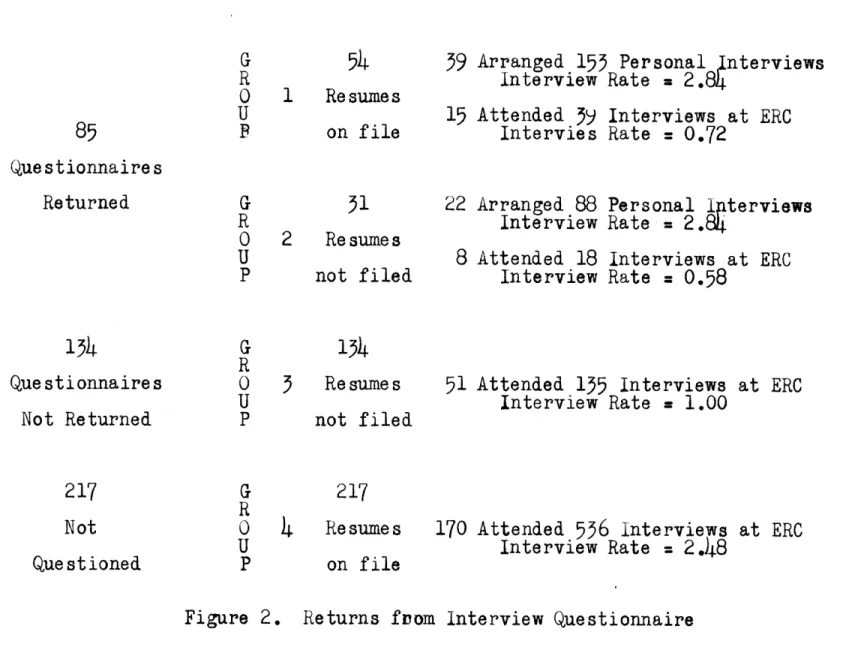
720 1.6made by the employees themselves, without the assistance of the placement program. Figure 2 shows the results of this
survey. The employees who returned questionnaires and had
resumes on file (Group 1) were arranging their own
inter-views at a rate of 2.84 per employee while attending ERC
in-terviews at a very low rate of 0.72. The second group, who had not filed the Interest and Experience Statements, were arranging personal interviews at the same rate as the first group, while appearing at the interview center at an even lower frequency. Over seventy percent of these first groups indicated that they had been arranging their own interviews. Group 3 presented a problem in analysis. Only 38 per-cent were participating in the placement program in any man-ner. It was discovered that this group included over one-third of the Center's supervisors, one-one-third of the employees with announced new positions, and
43
percent of the employees with salaries of $26,000 and above. These explanations forplacement "drop-out" were adequate to alleviate fears that this was a group of hard-core unemployables.
The fourth group brought up the Center average for in-house interviews to the levels shown in Table
9.
If it canbe assumed that Groups 3 and 4 were as active as the first two groups in arranging personal interviews, the average num-ber of interviews per professional employee would be more than twice the Table
9
values.1 Resumes
85
on file Questionnaires Returned 2 Resumes not filed39
Arranged 155 Personal InterviewsInterview Rate = 2.8
15 Attended
39
Interviews at ERC Intervies Rate=
0.7222 Arranged 88 Personal I terviews
Interview Rate = 2.
8 Attended 18 Interviews at ERC
Interview Rate
=
0.58 134 Questionnaires Not Returned 3 Resumes not filed51 Attended 135 Interviews at ERC
Interview Rate = 1.00
217
Resumes 170 Attended
536
interviews at ERCInterview Rate = 2.48
on file
Questioned
Figure 2. Returns from Interview Questionnaire
217
46
Of the ninety-nine employees who had announced decisions at the end of the study, forty-seven had completed exit in-terview questionnaires kAppendix D). Table 11 presents the re-sults of the questions on job search techniques which may be compared to data from the same questions asked early in the study. The ratings of techniques are ordered in the same pri-oritiy as in the first survey with the exception of assistance from family, which moved up in rank. The response to the in-terview program at ERC had not been included in the original questionnaire and was placed fourth in the second survey.
Almost three-fourths of the new positions were found with the help of friends and professional associates compared with expectations of less than fifty percent in the initial survey. A decline in responses is noted in all categories except the
single family response. Newspaper and magazine advertise-ments show the greatest decline, either because of a general tightening of the job market or their replacement by the ERC services, which were somewhat more accessible. Response to the question regarding technique used to find a position at the ERC tally well with the initial responses, with a little higher weight being placed on friends. The response to this question is interesting, as appointment to civil service po-sitions is competitive. it must be assumed that the response reflects lower formal recruiting expenditures by government.
A major change was noted in employee preference for em-ployment in aerospace fields. Less than twenty percent of
TABLE 11
RANKiNG OF JOB SEARCH TECHiNIQUES * FiNAL QUESTIONNAIRE EFFECTIVENESS RATING
Technique Best
1 2
3
5
Worst6
Weighted Average
TECHNIQUES USED TO SEARCH
Rank New
Position PositionERC
- - 1 1 3.25 Friends Professional Associates Newspaper Advertisement Magazine Advertisement ERC Listing ERC Interview Employment Agencies 11 11 17
7
2 2 - 1 - 1 1.79 - - - 1.63 - - 1 3 3.63 - 1 2 3 1 4.25 - 5 5 2 17
3
24
- - 2.70 - 2 1 3.155
- 4 3.44 Radio Comnercial - - - 2 3 2 5.86 Family 19 20 16 NNOW40ONPONMPIM"48
desired to remain in the field as they left the Center,com-pared with
45
percent earlier.65
percent desired to leave the field, with the majority giving reasons of instability and insecurity as their reasons.Thirty percent of the employees leaving took jobs out-side of the New England Area, compared with the
79
percent that had stated that they would work anywhere in Table 8. There did not appear to be major difficulty finding jobs matching preferences to the local area from the results of these early returns. The time required to secureemploy-ment at a distance from one's home may change thes figures in the end result. Of course, all those employees retained in the new Center organization will be added to the local category.
Three-fourths of the employees thought that their new
positions would be better than those they were leaving, while only 12 percent thought they would be worse. The
fact that 70 percent of the respondents reported higher salaries, ranging from $100 to $4000 more than their ERC pay, probably had some impact on that judgement. Only 5 percent reported reduction in salary, but the validity of that response is in question, as many of the employees
signed the questionnaire and may not have desired that in-formation to be known by their peers at ERC.
49
CHAPTER VIITHE TRANSPORTATION SYSTEMS CENTER
The evolution of the Transportation Systems Center from the brightly glowing coals of the defunct space center will justify a detailed study in its own right. An attempt is made here to touch lightly on this evolution because of the
impact it had on the employees of the ERC.
The great public furor over the closing of the ERC soon receded into a determined search for a new tenant for the facility under construction, with little mention of the utilization of the work force. Various local, state, and
federal agencies were suggested for occupancy, with little regard for the specialized nature of the laboratories. The Department of Transportation was mentioned in press reports
less than three weeks after the closing was announced.14 The earliest ties to the new agency were the ongoing NASA projects in the area of air traffic control and navigation and guidance systems which could be considered within the
realm of transportation research.
Before the end of January, The Department had
appoint-ed a committee to study the feasibility of using the Center
14"NASA Cuts 50 000 Workers", Boston Herald Traveler, January