Computations and Modeling of Oil Transport
between Piston Lands and Liner
in Internal Combustion Engines
by
Tianshi Fang
Bachelor of Engineering in Mechanical Engineering
The University of Hong Kong, 2012
M ASSACHUFETPs INSTITUTE
OF TEC. '-24C-_GY
AUG 15 2014
LIBRARIES
A%1CW&VE
SUBMITTED TO THE DEPARTMENT OF MECHANICAL ENGINEERING IN
PARTIAL FULFILLMENT OF THE REQUIREMENTS FOR THE DEGREE OF
MASTER OF SCIENCE IN MECHANICAL ENGINEERING
AT THE
MASSACHUSETTS INSTITUTE OF TECHNOLOGY
June, 2014
2014 Massachusetts Institute of Technology. All rights reserved.
Signature redacted
Signature of Author:
Certified by:
Department of Mechanical Engineering
May 9, 2114Signature
redacted-Dr. Tian Tian
Principal Research Enginqq, Department of Mechanical Engineering
Signature redactedawis
Supervisor
Accepted by:
David E. Hardt
Professor of Mechanical Engineering
Chairman, Committee on Graduate Students
Computations and Modeling of Oil Transport
between Piston Lands and Liner
in Internal Combustion Engines
By
Tianshi Fang
Submitted to the Department of Mechanical Engineering
on May 9, 2014 in partial fulfillment of the requirements for the Degree of
Master of Science in Mechanical Engineering
Abstract
The consumption of lubricating oil in internal combustion engines is a continuous
interest for engine developers and remains to be one of the least understood areas. A
better understanding on oil transport is critical to an optimization of engine designs, and
advanced analytical tools are essential to the achievement of reduced frictions without
compromising oil consumption.
Oil transport from piston lands to a liner, hereafter called "bridging", has been
observed in engine tests. The additional oil transferred to the liner becomes a potential
source of oil consumption through ring-liner interaction. Thus, it is important to develop
more quantitative models to better analyze bridging. The objective of this work is to
obtain a more in-depth understanding on the oil transport between piston lands and liner
and provide quantitative models of the oil transport mechanisms. Multiphase
Computational Fluid Dynamics (CFD) was employed together with analyses of
experimental observations.
Three categories of bridging were identified: assisted bridging, self-sustained
bridging, and reverse bridging. While assisted bridging involves an axial oil flow across
an entire piston land, the other two phenomena are localized and become prominent at
low engine speeds. The mechanisms of each phenomenon were analyzed in this work.
Correlations and theoretical models were developed to associate the risk of bridging with
geometrical designs of a piston and operating conditions of an engine. Particularly, the
theoretical model of self-sustained bridging contributes to the optimization of geometrical
designs of the third land of a piston ring pack.
This work constitutes a major step towards a further quantification of oil transport.
Some findings and models presented in this work can readily contribute to providing
optimal solutions to certain piston regions. Furthermore, the results of this work serve
broader purposes in providing boundary conditions to other interactions in a piston ring
pack.
Thesis Supervisor: Dr. Tian Tian
Title: Principal Research Engineer
Acknowledgements
The research area of oil transport and lubrication in automotive engines was
introduced to me by my advisor, Dr. Tian Tian, without whom this work would by no
means be possible. I consistently benefit from the discussions with him in the last two
years. I highly appreciate his insightful suggestions all through this work and his valuable
comments on a first manuscript of this report.
This work is sponsored by the consortium on lubrication in internal combustion
engines with additional support by Argonne National Laboratory and the US Department
of Energy. The current consortium members are Daimler, Mahle, PSA Peugeot Citroen,
Renault, Shell, Toyota, Volkswagen, Volvo Cars, and Volvo Truck. I appreciate the
useful feedbacks and constructive suggestions from their representatives.
I am gratitude to my laboratory mates for their kind help and friendship. They are
(in alphabetical order of surname): Camille Baelden, Kai Liao, Yang Liu, Mathieu Picard,
Pasquale Pio Totaro, Zachary Westerfield, Eric Zanghi, and Qing Zhao. Special gratitude
goes to Eric, whose experimental study provided supportive reference for my work. I
appreciate my senior office mates Kai, Camille, Mathieu, and Yang for their generous
help and useful discussions.
I would like to express my special gratitude to Yuan Wang, who worked in the
consortium before I came to MIT. It was from him that I took over the modified
multiphase OpenFOAM solver, interFoamPiston. It is the primary computational tool that
I employed all through this work.
I appreciate all my friends at MIT for their help through my two years' stay, both
academic and non-academic. I treasure the enjoyable times with them. And I value the
friendship.
My sincere gratitude goes to my parents, who consistently offered unconditional
supports through video chats from the other side of the earth.
Table of Contents
Abstract ...
3
Acknowledgem ents...
5
Table of Contents... 7 List of Figures...11 List of Tables... 15 1 Introduction ... 171.1 The Piston Assembly ... 17
1.2 One Mechanism of Oil Transport from Piston Land to Liner: Bridging .20 1.3 Scope of This W ork... 24
1.3.1 Background ... 24
1.3.2 M otivation ... 24
1.3.3 Computational Simulations ... 24
1.3.4 Experim ents... 25
1.3.5 Structure of This Report... 26
2 Bridging Caused by Axial Oil Flow on Piston Land... 27
2.1 Introduction... 27
2.1.1 Critical Quantity of Oil for TDC Bridging... 27
2.1.2 Existing Study ... 27
2.1.3 Objectives... 28
2.1.4 Structure of This Chapter ... 28
2.2 Simulation Setup ... 28
2.2.1 Variables to be Studied ... 28
2.2.2 Initial Settings of Sim ulations ... 29
2.3 Observations in Simulations ... 30
2.3.1 At a Low Engine Speed ... 30
2.3.2 At a High Engine Speed... 33
2.3.3 Closure ... 35
2.4 Theoretical Analyses on a Few Sub-Processes ... 35
2.4.1 Early Rise Resulting from Surface Tension...35
2.4.2 Circular Residual Oil ... 37
2.4.3 Oil Junction between Piston Land and Lower Ring Flank ... 40
2.5
Critical Oil Quantity ...
51
2.5.1 Critical Oil Quantity Based on Sim ulations ...
51
2.5.2 Discussions...
54
2.6
Sum m ary ...
55
3
Oil Trapping in Second Ring Hook and Self-Sustained Bridging ... 57
3.1
Introduction...
57
3.1.1 M otivation ...
57
3.1.2 Observations in Experiments...
57
3.1.3 Observations in Sim ulations...
58
3.1.4 Bridging M echanism s ...
61
3.1.5 Structure of This Chapter ...
63
3.2
Oil Trapping in Second Ring Hook...
63
3.2.1 Physics behind Oil Trapping ...
63
3.2.2 A Theoretical Definition of Oil Trapping ...
65
3.2.3 A Heuristic Analysis ...
66
3.2.4 A Theoretical M odel of Oil Trapping ...
71
3.2.5 More Potential Approaches to Decrease Critical Trapping Speed .... 84
3.2.6 Closure ...
86
3.3
Self-Sustained (SS) Bridging ...
86
3.3.1 M odeling M ethod ...
87
3.3.2 Results and Discussions ...
93
3.3.3 Sensitivity Analysis ...
96
3.3.4 Strategies for Elim ination of SS Bridging ...
98
3.4
Com m ents on the Theoretical M odels ...
99
3.4.1 Lim itations of the Theoretical M odels...
99
3.4.2 Comparison with Experiments and Simulations ...
101
3.5
Sum m ary ...
102
4 Reverse Bridging ...
105
4.1
Introduction...105
4.1.1 The Concept of Reverse Bridging ...
105
4.1.2 Observations in Experiments...105
4.1.3 Observations in Sim ulations...106
4.1.4 Fraction of Reverse Bridging ...
108
4.1.5 Structure of This Chapter ...
109
8
4.2
Sim ulation Setup ...
109
4.2.1 Sources of Scraped Oil...109
4.2.2 Computational Domain ... 110
4.2.3 Variables to be Studied ... 111
4.3 Simulation Results...111
4.3.1 An Example: Uniform Scraping by Non-Tapered OCR at 800rpm 112 4.3.2 Uniform Scraping by Non-Tapered OCR ... 116
4.3.3 Scraping of Bridging Oil by Non-Tapered OCR...119
4.3.4 Uniform Scraping by Tapered OCR ... 121
4.3.5 Scraping of Bridging Oil by Tapered OCR...125
4.4 Alternative Traces of Scraped Oil...127
4.4.1 Uniform Scraping: Viscous Dissipation in Corner...128
4.4.2 TDC Scraping: Viscous Dissipation on OCR Flank...128
4.4.3 Profile of Oil-Gas Interface...129
4.5 Sum m ary ... 130
5 C onclusion...131
A ppendix ... 133
Appendix 1: Numerical Scheme for Equation (2.49) ... 133
List of Figures
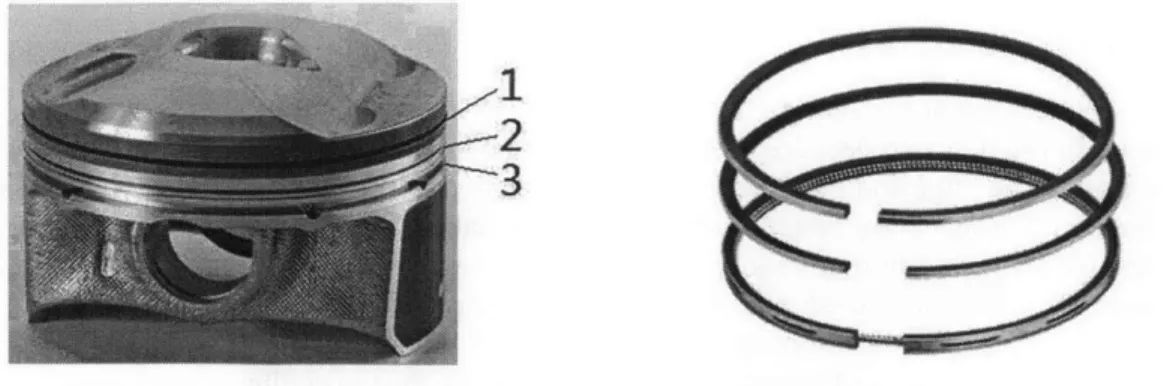
Figure 1.1 Piston and rings (Left: piston; right: rings) ... 18
Figure 1.2 Schematic diagram of radial cross section of piston-ring pack (Not to scale)...18
Figure 1.3 Schematic diagram of oil transport towards combustion chamber (Grey curves illustrate oil paths)... 19
Figure 1.4 Variation of normalized body force field (I= 158mm; r = 44mm) .. 20
Figure 1.5 Schematic diagram of bridging mechanisms in radial cross section 21 Figure 1.6 Detriment of TDC bridging (Not to scale) ... 22
Figure 1.7 Schematic diagram of velocity profile in oil film on piston land ... 23
Figure 1.8 2D LIF experiment demonstrating oil distribution from piston skirt towards crown land. Brighter color indicates more oil (Courtesy of E. Senzor[8])...23
Figure 1.9 Directions of vision in simulations and experiments ... 25
Figure 2.1 Critical oil volume for bridging [6, p. 79]...27
Figure 2.2 Geometry of computational domain...28
Figure 2.3 Initialization of simulation. Red color denotes oil and blue color denotes gas...30
Figure 2.4 Oil distribution with streamlines (left) and velocity field (right) before body force switches to upward direction, 800rpm ... 31
Figure 2.5 Complete evolution of TDC bridging, 800rpm ... 32
Figure 2.6 Pressure field, 800rpm (Gas pressure is almost uniform. It is set to be 10000O Pa.)...32
Figure 2.7 Streamlines (left) and velocity field (right) before body force switches to upward direction, 4500rpm...33
Figure 2.8 Complete evolution of TDC bridging, 4500rpm ... 34
Figure 2.9 Pressure field, 4500rpm (Gas pressure is almost uniform. It is set to be 10000O Pa.) ... 35
Figure 2.10 Schematic diagram of oil-gas interface under variant body acceleration. ... 36
Figure 2.11 Schematic diagram of circular residual oil...37
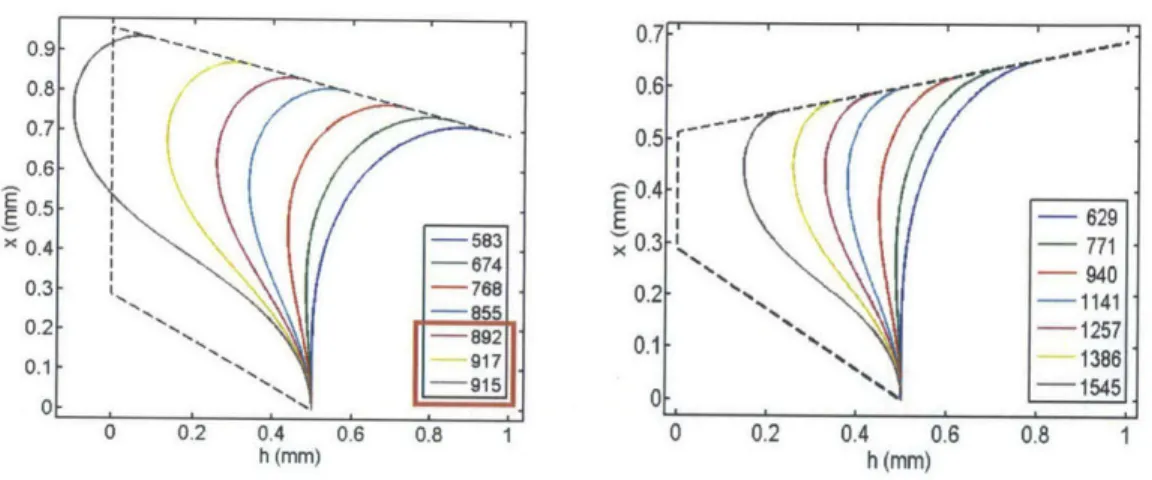
Figure 2.12 Interface profile of circular residual oil, normalized by y...39
Figure 2.13 Height of circular residual oil along piston land (a = 0.02N/n, p = 800kg/m3, r = 44mm, 1 = 158mm)... 39
Figure 2.14 Schematic diagram of rounded oil junction...40
Figure 2.15 Interface profile of rounded oil junction, normalized by yc ... 42
Figure 2.16 Span of rounded oil junction along lower second ring flank (a = 0.02N/n, p = 800kg/m3, r = 44mm, 1= 158mm) ... 42
Figure 2.17 Division of oil along piston third land during oil rises ... 43
Figure 2.18 Schematic diagram of the model for region 2 (Not to scale)...44
Figure 2.19 Schematic diagram of the model for region 1 (Not to scale)...46
Figure 2.20 Schematic diagram of the model for region 3 (Not to scale)...47
Figure 2.21 Results of oil rising model (Left: 800rpm; right: 4500rpm)...50
Figure 2.22 Volume ratio of puddle tail (Left: 800rpm; right: 4500rpm)...50
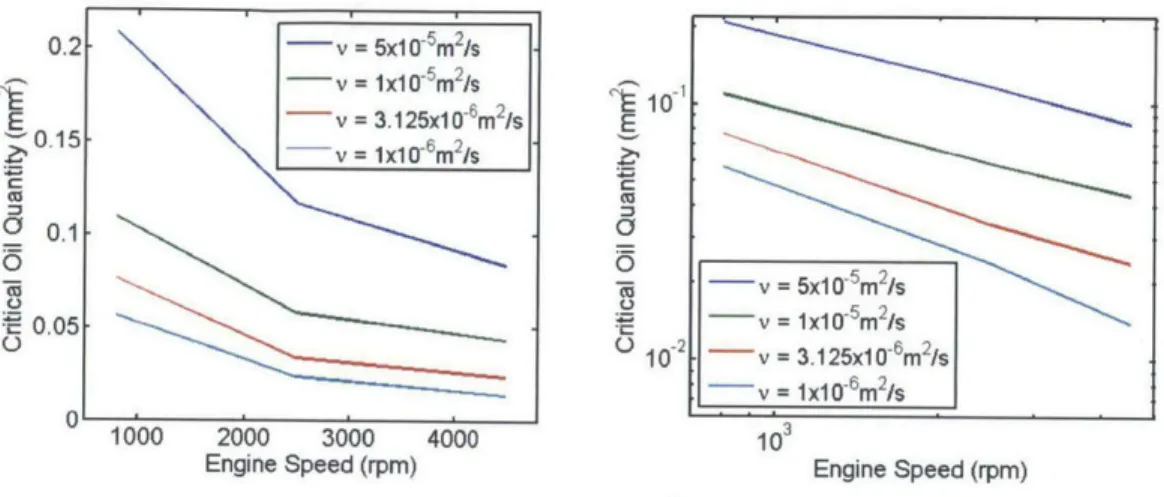
Figure 2.23 Critical oil quantity against engine speed. d = 0.5mm, with different u. (Left: normal scale; right: logarithmic scale)...52
Figure 2.24 Critical oil quantity against engine speed. u = 3.125x1Om2/s, with
different d. (Left: normal scale; right: logarithmic scale) ... 52
Figure 2.25 Critical oil quantity against oil viscosity. d = 0.5mm, with different N. (Left: normal scale; right: logarithmic scale)... 53
Figure 2.26 Critical oil quantity against clearance. U = 3.125x1O~6m2/s, with different N. (Left: normal scale; right: logarithmic scale)...54
Figure 2.27 TDC bridging with a second ring hook and a chamfer on top of piston third land ... 55
Figure 3.1 Bridging and oil trapping in second ring hook observed in experiment at 800rpm, 400mbar intake pressure. (Courtesy of E. Zanghi) ... 58
Figure 3.2 Computational domains for OpenFOAM simulations ... 59
Figure 3.3 Oil trapping in a rectangular hook with a piston chamfer (Red: oil; blue: gas)...59
Figure 3.4 Bridging in a rectangular hook with a piston chamfer (Red: oil; blue: gas) ... 60
Figure 3.5 Oil distribution in a rectangular hook without a piston chamfer (Red: oil; blue: gas)...6 1 Figure 3.6 Oil supply from piston third land to second ring hook (Red: oil; blue: gas) ... 62
Figure 3.7 Schematic diagram of TDC bridging with a second ring chamfer ... 63
Figure 3.8 Pressure fields in trapped oil. (Pressure in Pa. Gas pressure is 10000O Pa.)...64
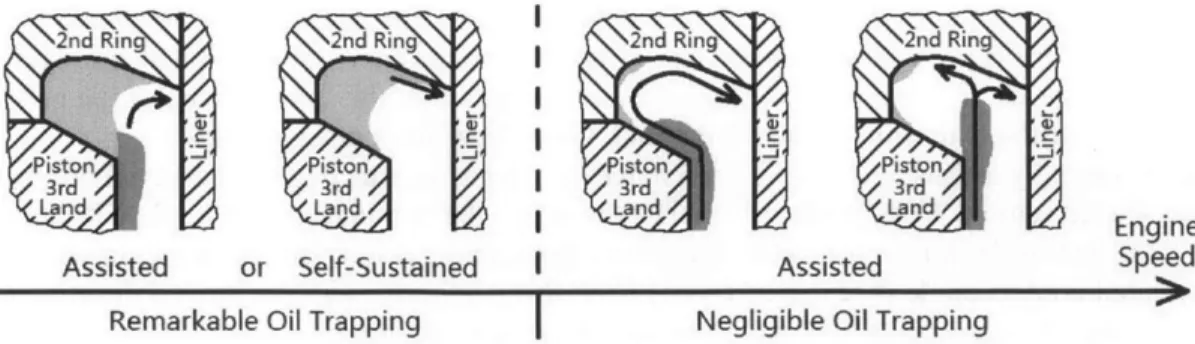
Figure 3.9 "Pinning" of oil contact line at the outer edge of piston chamfer...64
Figure 3.10 Schematic diagram of oil trapped in second ring hook (Left: low speed; Right: high speed) ... 65
Figure 3.11 Coordinate system and geometric parameters in the heuristic analysis (N ot to scale) ... 66
Figure 3.12 Evolution of interface profile at the critical point...68
Figure 3.13 Geometry of tapered Napier ring hook (Left: positive angle; right: negative angle)... 69
Figure 3.14 Oil-gas interface profiles in Napier ring hooks at different engine speeds (Left: +150 tapered angle; right: -10* tapered angle; legend: engine speed in rpm) ... 7 0 Figure 3.15 Conformation of piston chamfer to second ring hook...71
Figure 3.16 Pinning of oil contact line if piston chamfer is larger than second ring hook ... 7 1 Figure 3.17 Geometric parameters in the model for trapping ... 72
Figure 3.18 Boundary condition on top of interface...73
Figure 3.19 B as a function of . (y = 15', y = 00)...75
Figure 3.20 B. as a function of y. (x' = 0*)... 75
Figure 3.21 Bm as a function of y. (a = 900) ... 76
Figure 3.22 Geometric indication of D and de ... 76
Figure 3.23 Critical k value against tapered hook angle y. (left: w = 1mm, c = 0.5mm, d = 0.6887mm, see Figure 3.2 (a); right: w = 1mm, c = 0.5mm, d = 0.4mm, see Figure 3.2 (b))... . . 80
Figure 3.24 Critical speed against height of hook region d. (w = 1mm, c =
0.5m m , y = 100)...80
Figure 3.25 Critical engine speed for oil trapping in typical designs ... 81
Figure 3.26 A larger cut on top of piston third land ... 84
Figure 3.27 Double cuts on top of piston third land ... 85
Figure 3.28 Effect of rounded edge. (Left: contact line pinned at a sharp edge; right: contact line moves smoothly through a rounded edge.)...85
Figure 3.29 Oil passage in the vicinity of outer edge of piston chamfer ... 86
Figure 3.30 Geometric parameters in the model for SS bridging...87
Figure 3.31 Breaking-up of oil-gas interface (Left: at the moment of breaking-up; right: separation at TDC)...92
Figure 3.32 Oil-gas interface at TDC after it breaks-up ... 93
Figure 3.33 Modeling results for Design 1 (R = 0.2mm, d = 0.69mm, w = 1mm, c = 0.5mm, s = 0.29mm, 0 = 30') (Left: modeling by distance; right: modeling by volume) ... 94
Figure 3.34 Ranges of engine speed in which a risk of SS bridging exists (Light colour: model by distance; dark colour: model by volume)...95
Figure 3.35 Oil trapping and self-sustained bridging modeled by volume (light colour: trapping without self-sustained bridging; dark colour: trapping and self-sustained bridging) ... 95
Figure 3.36 Sensitivity of oil volume that is needed for SS bridging to advancing contact angle ( ... 96
Figure 3.37 Sensitivity of oil volume that is needed for SS bridging to receding contact angle
X...97
Figure 3.38 Sensitivity of critical speed to advancing contact angle P (y = 15*) ... 97
Figure 3.39 Oil trapping and SS bridging in a transient condition...98
Figure 3.40 Circumferential distribution of oil in second ring hook and piston cham fer ... 10 1 Figure 3.41 Dimensions of the test engine...101
Figure 4.1 Reverse bridging observed in experiments at 1500rpm, 600mbar intake pressure. (Courtesy of E. Zanghi)...106
Figure 4.2 Reverse bridging in simulation, 800rpm, 0.4mm piston-liner clearance, 80pm initial film ... 107
Figure 4.3 Reverse bridging in simulation, 4500rpm, 0.5mm piston-liner clearance, 30pm initial film ... 107
Figure 4.4 Alternative traces of oil scraped by upper OCR flank ... 108
Figure 4.5 Computational domain of simulations of reverse bridging ... 110
Figure 4.6 Tapered angle p of upper OCR flank (Not to scale)...111
Figure 4.7 Uniform scraping and reverse bridging, non-tapered OCR, 800rpm, V scraped 1500 pm2 .. ... . . . .. . . .. . .. .. . . .112
Figure 4.8 Cusp in oil-gas interface near the corner bounded by upper OCR flank and liner ... 114
Figure 4.9 Effect of cusp (Grey: oil without cusp; dashed black curve: oil surface w ith cusp)...114
Figure 4.11 Two regions of oil as oil accumulates ... 115 Figure 4.12 Uniform scraping and reverse bridging, non-tapered OCR, 4500rpm,
Vscraped ~ 1500 pm2 . . . . 117 Figure 4.13 Fraction of reverse bridging y against quantity of scraped oil, uniform scraping, non-tapered OCR flank ... 118
Figure 4.14 Fraction of reverse bridging y against engine speed N, uniform scraping, non-tapered OCR flank...119 Figure 4.15 TDC scraping and reverse bridging, non-tapered OCR, 800rpm,
Vscped 1500 p 2.m . . . . 119 Figure 4.16 scraping and reverse bridging, non-tapered OCR, 4500rpm, Vscraped
S 1500 pm 2 .... ... . . . .. .. . . .120
Figure 4.17 Fraction of reverse bridging y against engine speed N, TDC scraping, non-tapered OCR flank...121
Figure 4.18 Components of body force. (a): downward body force; (b) upward body force ... 12 1
Figure 4.19 Uniform scraping and reverse bridging, 180 tapered OCR, 800rpm,
V scrape d 1500 pm 2 ... . . . .. . . .122 Figure 4.20 Uniform scraping and reverse bridging, 180 tapered OCR, 4500rpm,
V sraped -- 1500 pm2 ... . . . .. . . .124 Figure 4.21 Fraction of reverse bridging y against engine speed N, uniform scraping, 18' tapered OCR flank ... 125
Figure 4.22 TDC scraping and reverse bridging, 18' tapered OCR, 8 0 0rpm,
V scrape d 1500 pm2 ... . . . .. . . .126 Figure 4.23 TDC scraping and reverse bridging, 18* tapered OCR, 4500rpm, V scrape d " 1500 pm2 ... . . . . .. . . .. . . .126
Figure 4.24 Fraction of reverse bridging y against engine speed N, TDC
scraping, 18' tapered O CR flank ... 127
Figure 4.25 Possible flow patterns of scraped oil... 127
Figure A. 1 Figure of 12(1). (a): schematic diagram; (b) & (c): examples of com puted results...134
List of Tables
Table 2.1 Index of power law between critical oil quantity and engine speed
..52
Table 2.2 Index of power law between critical oil quantity and engine speed
..53
Table 2.3 Index of power law between critical oil quantity and oil viscosity.... 53
Table 3.1
Comparison of modeling results (Tp
=
30*) with experiments and
sim ulations...102
1
Introduction
Vehicle is one major contributor to the global energy consumption in modern
society. In the past two decades, energy consumed by vehicles has been substantially
increasing. The huge and increasing demand of energy necessitate comprehensive studies
on the energy conversion system in vehicles
-
internal combustion engine. Any increase
in the efficiency of automotive internal combustion engines will result in a considerable
decrease in global fuel consumption, which in turn improves automotive economy,
contributes to sustainable development, and reduces greenhouse gas (CO
2) emission.[1]
Among all types of internal combustion engines, piston engine is most widely
applied in automobiles. Among the total energy consumed in automotive engines,
roughly 15% is employed to overcome friction in piston assembly.[1] Thus, a decreased
friction in piston assembly will considerably increase engine efficiency, and hence
significantly reduce the global energy consumption. As a common practice to decrease
friction, lubricating oil is supplied to piston assemblies. A systematical understanding of
lubrication in piston assemblies is crucial to the achievement of a decreased friction.
1.1 The Piston Assembly
In a typical piston engine, fuel combusts in a cylindrical combustion chamber,
which is mostly bounded by a cylinder head, a liner and a piston. While the first two are
usually fixed in position in a vehicle except for vibrations and distortions, the piston
reciprocates. The combustion of fuel in the combustion chamber results in an increase in
pressure, which pushes the piston and exports mechanical energy. The crank shaft
connected to pistons eventually converts reciprocating motion into rotational motion.
To maintain the proper functioning of a piston engine, the combustion chamber
must be properly sealed to prevent gas leakage. It requires that the diameter of the piston
should be roughly the same with the bore, which is the inner diameter of combustion
chamber, cylinder, or liner. On the other hand, a tight contact between piston and liner
will result in a considerable friction, which remarkably decreases engine efficiency.
The common practice to resolve this dilemma is described as follows. The
diameter of piston is slightly smaller than the bore, leaving a clearance of roughly 200pm
to 600pm between the piston and the liner. A few, typically three, circumferential
grooves are cut on the piston surface, as demonstrated in Figure 1.1 left. In engine
operations, three rings (Figure 1.1 right) are inserted in the grooves, one for each. The
rings are in closer contact with the liner so that the combustion chamber can be better
sealed despite the relatively large clearance between the piton and the liner. A schematic
diagram of a radial cross section of a piston-ring pack is illustrated in Figure 1.2. The ring
grooves divide the surface of piston into four parts. From combustion chamber (top in
Figure 1.2) to crankcase (bottom in Figure 1.2), they are named crown land, second land,
third land, and piston skirt. The three rings are usually named first ring (compression
ring), second ring, and oil control ring (OCR).
Figure 1.11 Piston and rings (Left: piston; right: rings) Crown Land I 1st Ring 2nd Land 2nd Ring Liner 3rd Land 0 C R Piston Skirt
Figure 1.2 Schematic diagram of radial cross section of piston-ring pack (Not to scale)
For the purpose of mere lubrication, lubricating oil is expected on every rubbing surface in a piston-ring pack. A thin oil film is expected on the liner in order to lubricate the contacting surfaces of rings and liner. Lubricating oil may also be expected in the clearance between a ring flank and its groove because there will also be relative motions there. A desirable lubrication effectively reduces friction and enhances engine efficiency. It also alleviates wear on engine components and elongates life time of an engine.
On the other hand, the amount of oil that enters the combustion chamber must be strictly controlled. When lubricating oil enters the combustion chamber, it may be consumed by way of evaporation, carbonization, or combustion. The consumption of lubricating oil lessens engine economy and customer satisfaction. Moreover, some chemical elements in lubricating oils, for instance, phosphorous and sulfur, can poison
1 Sources of pictures: left: http://www.cleanmpg.com/forums/printthread.php?t=41627 right: http://www.jitiegroup.com/detail_16.html
the catalysts in after treatment devices [1], which leads to undesirable emission of pollutants. Thus, one primary challenge in the design of piston-ring systems is the compromise between reduction of friction and suppression of oil consumption. The ultimate goal is to supply exactly irredundant amount of oil to each site, so that friction is satisfactorily reduced while oil consumption is minimized. To achieve this goal, an in-depth understanding of oil transport in every part of the piston-ring pack is necessary.
In a typical piston engine, lubricating oil is supplied from below the piston skirt, usually by splashing from the connecting rod. The oil supply is extremely redundant compared to that needed by a first ring. Thus, besides the sealing of combustion chamber, the rings also function to control oil leakage to the combustion chamber. Conventionally, it is deemed that a first ring primarily seals the combustion chamber, an OCR mostly controls oil supply to the upper piston-ring pack, and a second ring plays an auxiliary role in oil control.
Combustion
Chamber
Oil Supply
Figure 1.3 Schematic diagram of oil transport towards combustion chamber (Grey curves illustrate
oil paths)
A thorough study on oil transport in a piston-ring pack has been conducted by Thirourd & Tian [2, 3]. They systematically identified oil transport mechanisms in different parts of the piston-ring pack. To briefly summarize their model, oil supplied from below the piston skirt leaks to the combustion chamber through two major paths: 1) through the clearances between rings and liner; 2) through clearances between ring flanks and grooves, behind grooves, and along piston lands. The two paths are illustrated in Figure 1.3. Sometimes oil can interchange between these two paths. One of such mechanisms is termed "bridging", which will be explained in detail in the next section.
1.2 One Mechanism of Oil Transport from Piston Land to Liner:
Bridging
In certain cases, oil on a piston land can spread along a ring flank and reach the
liner. This process is termed "bridging". The phrasing comes from the fact oil film on the
liner connects, or bridges, to the oil on a piston land. A practical consequence of bridging
is that additional oil is supplied to the liner, which contributes to friction reduction but
possibly increases oil consumption. [4], [5]
0.06
'w 0.04--0.02 0 - ---0.02 0 '0 180 270 30Crank Angle (Degree)
Figure 1.4 Variation of normalized body force field (1= 158mm; r = 44mm)
A typical scenario in which bridging occurs is described as follows. The
description here is focused on the space bounded by a piston third land, the lower flank of
a second ring, a liner and the upper flank of an OCR. If the piston is taken as the
reference frame, there is a body force field associated with the acceleration of the piston.
This body force filed, or body acceleration, can be calculated with:
r2 cos(20) r4 sin2 E cos2 e)
a = w2 rcos 0 + _ + (1.1)
1-r2 sin2e ( 12 - r2 sin2 )
where a is body acceleration, o is engine speed in radians per second, r is crank radius, 1
is connecting rod length, and 0 is crank angle with 0* at top dead center (TDC) and 180*
at bottom dead center (BDC). The positive direction is upwards, or towards the
combustion chamber. A typical example of body acceleration normalized by o2 is plotted
in Figure 1.4. At roughly 285*, most oil is accumulated at the bottom of the space near
the upper flank of OCR because body force was downward before this moment. Then, the
body force switches direction and oil will flow upwards along the piston third land. If the
oil flows sufficiently fast to reach the lower flank of the second ring, and if the oil has
sufficient time to spread along the lower second ring flank and reach the liner before
TDC, then, oil will attach to and move with the downward moving liner. In this case, oil
on the piston land connects to the liner, and bridging occurs. Such a bridging process has
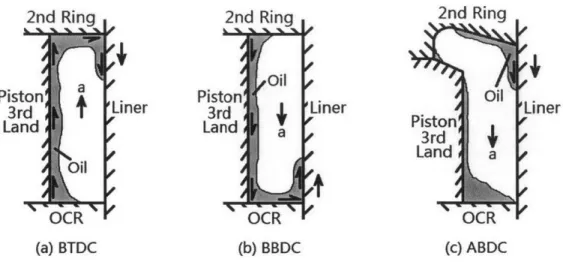
been reported in [4, 6]. An illustration of this mechanism is shown in Figure 1.5 (a).
2nd Ring
2nd Ring
2nd Ring
Oil
Piston a .1 Piston .i Oil O
3rd t L1iner 0ner
Piston
3rd LinerLine
L1inerLand Land a Piston ;J
OF
3rd
Land Oil
OCR OCR OCR
(a) BTDC
(b) BBDC
(c) ABDC
Figure 1.5 Schematic diagram of bridging mechanisms in radial cross section
Similar to BTDC bridging described in the last paragraph, bridging can also occur
on the upper flank of the OCR before BDC. The only difference is that the oil flow and
the body force driving it are in the opposite direction. BBDC bridging has been reported
in [4]. An illustration of this mechanism is presented in Figure 1.5 (b).
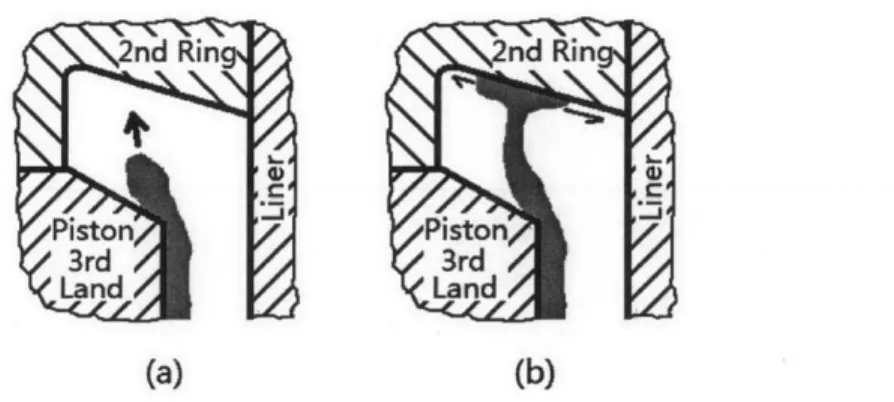
As reported in [2, 7], bridging can also occur after BDC. As illustrated in Figure
1.5 (c), there is usually a tapered hook on the lower outer edge of a second ring. One
reason behind such a design will be explained shortly. At BDC, although the body force
is downward, some oil can still stay in the hook of the second ring, which will be
explained in Chapter 3. Under the downward body force, a slight amount of oil can flow
down along the upper surface of second ring hook and approach the liner. When an
upstroke starts, this part of oil will attach to the liner, which is moving downward in this
reference frame. This bridging mechanism is illustrated in Figure 1.5 (c).
While the first and the second scenarios are complementary, the complement of
the third mechanism has not been found in literature. It is because there is no hook in an
OCR. However, a phenomenon which appears similar to "ATDC bridging" has been
discovered and will be described in Chapter 4.
Occurrence of bridging means that OCR partially loses control of oil film
thickness on the liner, which is an undesirable situation in engine operations. Thus,
bridging is an undesirable phenomenon to the reduction of oil consumption. As explained
by Przesmitzki et al. [4], TDC bridging increases oil consumption, while BDC does not.
This is explained as follows. Because of bore distortion, at the beginning of an intake
stroke, the clearance between the second ring and the liner can be relatively large at some
sites. If bridging occurs before TDC, the oil film on the liner is thickened as illustrated in
Figure 1.6 (a). When the liner reverses direction after TDC, the additional oil on the liner
can leak though the large clearance instead of being scraped by the second ring. It may
even leak though the clearance between the first ring and the liner. The oil leakage is
illustrated in Figure 1.6 (b). Then, the liner will come back to the TDC at the end of the
successive compression stroke. Because of the combustion happening in combustion
chamber, the gas pressure in it is high at this time. The high pressure can push the first
ring downward, leaving a clearance between its upper flank and its groove. Thus, the
space behind the first ring is connected with the combustion chamber, and the pressure
there is increased. The high pressure behind the first ring will push it towards the liner,
resulting in a better conformation between the first ring and the distorted liner. Thus, only
a little oil can escape through the ring-liner clearance. Much oil will be scraped by the
upper flank of the first ring towards the combustion chamber, eventually contributing to
oil consumption. The upward scraping is illustrated in Figure 1.6 (c). On the other hand,
since the pressure in the combustion chamber will not be significantly different at two
consecutive BDC's, there will not be a significant difference in ring-liner conformation.
Resultantly, BDC bridging will less probably result in upward scraping towards the
combustion chamber. Thus, TDC bridging is deemed more detrimental in terms of oil
consumption, and the study of TDC bridging is therefore of more practical interest.
High
P
Rin
Rin
p
Rin
Piston
Liner
Piston
Liner
PistonLiner
Oil
Oil
(a) Exhaust Stroke
(b) Intake Stroke
(c) Compresstion Stroke
BTDC
ATDC
BTDC
Figure 1.6 Detriment of TDC bridging (Not to scale)
As a common practice to avoid TDC bridging, a tapered hook is usually cut in the
lower outer edge of a second ring. This type of rings is named "Napier rings". It isusually utilized in conjunction with a chamfer on the top of a third land. The hook,
together with the chamfer, provides a buffer for oil when it reaches the top of piston third
land under upward body force. It is expected that oil will reside in this hook instead of
bridging to the liner or leaking through the second ring groove.
Bridging occurs only if oil flows sufficiently fast along a piston land. A detailed
analysis on the oil flow will be presented in Section 2.4.4. Here, a final solution derived
from lubrication theory is presented:
v = (X2 - 2hx) (1.2)
2u
where v is oil velocity along a piston land, a is body acceleration, u is kinematic viscosity
of oil, h is local oil thickness, and x is the coordinate perpendicular to the piston land.
(See Figure 1.7.) Equation (1.2) indicates that oil flows faster if the oil layer on the piston land is thicker. When bridging occurs, oil on the piston land must flow sufficiently fast.Thus, oil thickness on the piston land must be sufficiently large. In other words, oil supply to this space must be sufficient.
Piston
Land
'
Oil
Layer
Figure 1.7 Schematic diagram of velocity profile in oil film on piston land
Figure 1.8 2D LIF experiment demonstrating oil distribution from piston skirt towards crown land. Brighter color indicates more oil (Courtesy of K Senzor[8])
As demonstrated in Figure 1.8, the amount of oil decreases from piston skirt
towards the crown land because of the oil control by each ring. Thus, TDC bridging is
most probable in the vicinity of a piston skirt and a third land where oil supply is
sufficient. It rarely occurs in the vicinity of a second land, though it has been reported in
[9]. In the vicinity of piston skirt, oil supply is usually ample and it is almost impossible
to avoid bridging in this region. However, since the spring behind OCR will result in a
good ring-liner conformation, bridging below the OCR may not result in oil consumption.Thus, it is not that meaningful to suppress bridging in this region. Since there is no spring
behind a normal second ring, a study on TDC bridging in the vicinity of third land is of most practical interest.
1.3 Scope of This Work
1.3.1 Background
This work was originally motivated by a set of experiments conducted by Zanghi [10]. In the experiments, TDC bridging was observed at low engine speeds, which contradicted the existing theory [2], [4], [6] that is reviewed in Section 1.2. In order to figure out the reasons behind low speed bridging, computational simulations of oil flow
near a piston third land were conducted.
In a preliminary examination of the simulation results, three mechanisms of oil transport from a piston land to a liner have been identified. Based on the natures of these
mechanisms, the one that was described in Section 1.2 was named "assisted bridging", and the two newly-discovered mechanisms were named "self-sustained bridging" and "reverse bridging", respectively. The definition of "assisted bridging" and "self-sustained bridging" will be presented in Chapter 3, and that of "reverse bridging" in Chapter 4. The experiments conducted by Zanghi [10] indicated that the three mechanisms indeed occur in real engine operations.
1.3.2 Motivation
The primary objective of this work is to understand the three oil transport
mechanisms in the vicinity of a piston third land, namely, the cavity bounded by a piston third land (including the chamfer on both ends), the lower flank (including the surface of a hook) of a second ring, a liner, and the upper flank of an OCR.
Since oil consumption at city driving speeds, for instance, from 600 to 1800 rpm, has been receiving increasing attention in the automotive industry, special attention will be paid to the oil transport at low engine speeds.
1.3.3 Computational Simulations
Computational simulations were conducted all through this work. They facilitated an observation of oil flow in a radial cross section as is shown in Figure 1.9. Because the focus of this work was oil flow in the axial direction driven by body force, all simulations were two-dimensional. Variations in the circumferential direction, including the effects of circumferential gas flow [2], [3] and instabilities on oil-gas interfaces, were beyond the focus of this work. Furthermore, the oil and gas leakage through the clearances between ring flanks and grooves and through the clearances between ring lands and a liner were neglected. That is, the cavity was assumed to be perfectly sealed. The dynamics of rings were also neglected. That is, the boundaries of the computational domains were
-Experiments
Simulations
Figure 1.92 Directions of vision in simulations and experiments
The computational tool that is employed in this work was OpenFOAM, an open
computational fluid dynamics (CFD) software. A standard multiphase solver, interFoam,
was utilized in order to simulate both oil and gas flow in the cavity. The solver has been
modified by Wang [6] to accommodate the time-variant body force field. It utilizes thevolume of fraction (VOF) method to trace the interface of oil and gas. The governing
equations in this solver are [6]:
VU
0
(1.3)a(
1
-U)(14
at
pU -
VU
= -Vppah -
(Ca
-
)Vp
+ V -
T
+ O1m
(1.4)
at
-+ V-(ai) =
(1.5)where U is velocity vector, p is fluid density, t is time, pp, is pressure minus hydrostatic pressure (ppah = p - pa -x), a is body acceleration, x is coordinate of a point, T is shear stress, a is surface tension of oil and gas, K is curvature of interface, ii is the normal vector of interface area, and a is fraction of oil in a computational cell. Equation (1.3) and Equation (1.4) are continuity equation and Navier-Stokes equation, which are the
fundamental equations for all problems in fluid mechanics. The last term in Equation (1.4) addresses surface tension in a multiphase problem. Equation (1.5) is a unique equation for the VOF method. It calculates the fraction of oil (a) in a computational cell.
For simple rectangular computational domains, blockMesh, which is a simple meshing tool enclosed with OpenFOAM, was employed. For geometries containing fillets, tapered angles, ANSYS Meshing was employed.
1.3.4 Experiments
Results of 2D LIF experiments conducted by Zanghi [10] were taken as supportive verifications of the simulation results. Different from 2D simulations in a radial cross section, the experiments facilitated an observation of oil flow from outside
the piston. The difference in vision direction is illustrated in Figure 1.9. Details of the experimental set-up can be found in [7], [10].
Figure 1.8 is an example of pictures taken in experiments. Lubricating oil is mingled with fluorescent dye, and a laser source illuminates the oil. A camera is
employed to receive the light reflected by the fluorescent dye. Regions with more oil are marked with a brighter color (white) in a picture, while regions with less oil are marked with a darker (black) color.
1.3.5 Structure of This Report
Chapter 1 is a brief introduction of this work. The concept of bridging has been introduced and the motivation of this work has been explained.
Chapter 2, 3, and 4 are the three major chapters of this report. Each chapter is focused on one mechanism of oil transport from a piston land to a liner. The physics behind oil transport processes will be explained based on simulation results, and theoretical analyses will be presented.
Chapter 2 will be focused on assisted bridging, of which the definition is presented later in Chapter 3. Simulations of oil re-distribution in the vicinity of a piston third land will be introduced, with a focus on TDC bridging caused by axial oil flow driven by body force. Some physics behind the complete process will be described and modeled.
In Chapter 3, self-sustained bridging will be introduced. It results from surface tension, and is more pronounced at low engine speeds. A quantitative model aiming at preventing this phenomenon by way of optimizing second ring design will be presented.
In Chapter 4, reverse bridging will be introduced. It appears similar to bridging and can be equally detrimental to TDC bridging. The physics behind reverse bridging will be explained based on simulations. It will be shown that this phenomenon is more detrimental at low engine speeds.
Chapter 5 will summarize this work. Future work will also be proposed in this chapter.
2 Bridging Caused by Axial Oil Flow on Piston Land
2.1 Introduction
2.1.1 Critical Quantity of Oil for TDC Bridging
As explained in Chapter 0, bridging occurs when axial oil flow on a piston third
land is sufficiently fast. One essential condition of it is that sufficient oil exists in the
vicinity of a piston third land. A critical quantity of oil can be expected at a certain engine
speed. When the actual amount of oil in this cavity exceeds the critical value, bridging
occurs. Otherwise, bridging will not occur. Given that circumferential variation is not to
be considered in this work, the critical value in a two-dimensional simulation is measured
by the cross sectional area of oil.
Equation (1.2) implies that oil velocity is proportional to body acceleration, which
is proportional to the square of engine speed. On the other hand, the time interval allowed
for axial oil flow is inverse proportional to engine speed. Oil velocity increases with
engine speed at a more rapid rate than the time interval decreases. Thus, TDC bridging
caused by axial oil flow on a piston land is more probable at a higher engine speed. It is
expected that the critical volume decreases with engine speed.
2.1.2 Existing Study
3a - Rectangular -iIf Rectangular -5" 25 - - --- -.-..- ... -.-. --- Rectangular 0" -Rectangular sO Rectangular 10 Rectangular 15" 8 20 -Rectangular 20f -- look -Charnter 1 200 2500 3000 3500 4000 4500 50 rpmFigure 2.1 Critical oil volume for bridging [6, p. 79]
Wang [6] has conducted a numerical study on the correlation between the critical
volume and engine speed. Two classes of designs were studied: 1) plain rectangular
second rings with different twist angles; 2) a Napier ring together with a chamfer on top
of piston third land. Figure 2.1 shows his results. The abscissa is engine speed in rpm,
and the ordinate is the critical volume, measured by the percentage of space filled with oil.
As expected, the critical volume decreases with engine speed in all designs studied. The critical volume does not vary significantly with the twist angle of a plain second ring, while a hook together with a chamfer substantially increases the critical volume. It confirms the argument that a hook in a second ring can effectively suppress TDC bridging.
2.1.3 Objectives
Wang's [6] study primarily focused on the high speed range (above 2000rpm). However, as explained in Chapter 1, oil consumption at low speeds has been receiving increasing attention. Therefore, one objective of this study is to extend Wang's study to lower engine speeds.
Besides, a more in-depth understanding of the complete oil re-distribution process, especially the axial oil flow along a piston third land, is another objective of this study.
2.1.4 Structure of This Chapter
This chapter will mainly introduce a computational study on TDC bridging resulting from axial oil flow near a piston third land. In Section 2.2, background information of the computational simulations will be briefly described. Then, observations in the simulations will be explained in Section 2.3. Based on the
observations, a few theoretical models on different phenomena have been developed. They will be presented in Section 2.4. Section 2.5 is focused on the critical oil quantity for TDC bridging estimated form simulation results. Section 2.6 will briefly summarize this chapter.
2.2 Simulation Setup
2.2.1 Variables to be Studied
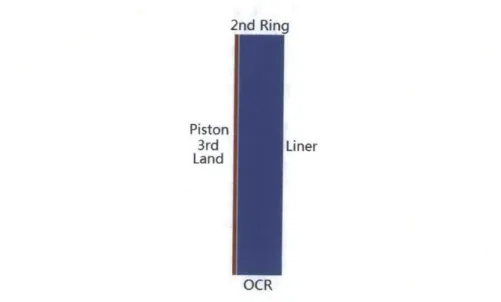
2nd Ring
2nd Ring
Piston d Liner Piston d
3rd L 3rd L Liner
Land
Land
OCR OCR
(a) Complete Geometry (b) Simplified Geometry
A complete re-distribution process is dependent of six categories of parameters: 1. Oil properties including density and viscosity.
2. Gas properties including density and viscosity;
3. Surface tension in an oil-gas interface;
4. Engine configuration including crank radius and connecting rod length;
5. Engine speed;
6. Geometric parameters including clearance between piston land and liner (d),
axial height of piston land (L), dimensions of chamfers on piston and OCR, and all the geometric parameters of second ring hook. (See Figure 2.2 (a).)
The large number of relevant parameters will substantially complicate this study and prevent one from identifying the effect of each individual parameter. Thus, for simplicity, only a few of them will be studied in this work.
First, because the density and viscosity of gas are small compared to those of oil, the effects of gas are to be neglected. Second, since oil flow along a piston land is regarded the most significant sub-process, the hook and all the chamfers are to be neglected. That is, the computational domain is simplified to a rectangular cavity as shown in Figure 2.2 (b). Third, in this work, only the characteristics within the
rectangular cavity will be focused on. For simplicity, the effects of engine configuration are not to be studied, though it will determine the body acceleration, which is the driving force of oil flow.
Then, six parameters are within the focus of this work: oil density, oil viscosity, surface tension, engine speed, piston-liner clearance and height of piston land. If one applies dimensional analysis, only three of them need to be varied in a computational simulation. In this work, kinematic viscosity of oil (u), engine speed (N), and piston-liner clearance (d) are selected as the variables to be studied.
In this study, simulations were conducted at five engine speeds: 800, 1500, 2500,
3600, and 4500rpm. Four kinematic viscosities of oil were attempted: 1x10⁻⁶, 3.125x10⁻⁶
(datum), x 10-5, and 5x 10- m2/s. Three clearances were attempted: 0.5 (datum), 0.4, and
0.3mm. Oil density was kept constant at 800kg/M3, surface tension was fixed at 0.02N/m,
and height of piston third land was kept at 2.5mm.
2.2.2 Initial Settings of Simulations
The simulations were conducted in the following steps.
First, all the variables were fixed. An oil film with a uniform thickness was laid on the piston land, as shown in Figure 2.3. A simulation started from TDC and lasted for three revolutions. In all simulations, the oil flow pattern had reached a realistic periodical flow pattern within two revolutions. Thus, the result in the third revolution is considered reliable.
If TDC bridging was observed in one simulation, the initial film thickness would
be decreased by 1 Opm and a new simulation was to be conducted with the same parameters; if not, the initial film thickness would be increased by 10tm. This was repeated until the smallest oil thickness with which TDC bridging occurs and the largest thickness with which TDC bridging does not occur were found. The critical volume lies
within this range of 1 Opm. Estimation was made based on the severity of TDC bridging
in simulations.
Then, one parameter was changed, and another set of simulations were conducted.
Piston 3rd
Land Liner
OCK
Figure 2.3 Initialization of simulation. Red color denotes oil and blue color denotes gas.
2.3 Observations in Simulations
In this section, observations in computational simulations will be explained.
Simulations with d
= 0.5mmand u
=3.125x10m
2/s are to be presented as examples.
The crank radius is 44mm and the connecting rod length is 158mm. With this engine
configuration, body force switches direction at roughly 2850 crank angle. Simulation
results from
2700
to 360' crank angle will be presented to demonstrate the complete
process of TDC bridging.
Simulations at 800rpm and 4500rpm will be shown as examples to reveal the oil
re-distribution at a low engine speed and a high engine speed, respectively. Figure 2.4 to
Figure 2.6 show simulation results at 800rpm with an 80pm initial oil film, which is the
thinnest with which TDC bridging occurs at 800rpm. Figure 2.7 to Figure 2.9 show
simulation results at 4500rpm with a 30prm initial oil film, which is the thinnest with
which TDC bridging occurs at 4500rpm. In these figures demonstrating oil distribution,
red color denotes oil and blue color denotes gas.
2.3.1 At a Low Engine Speed
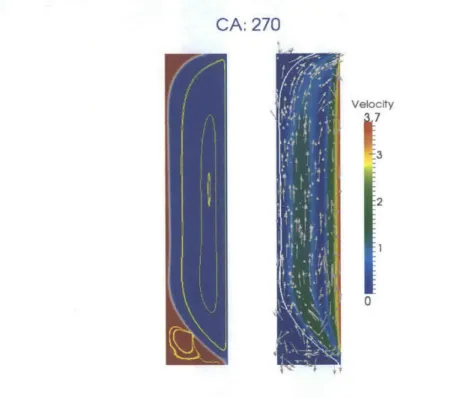
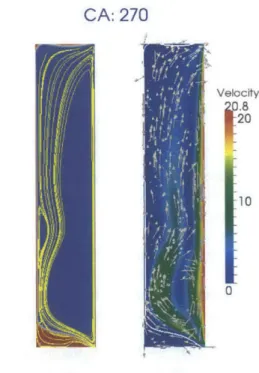
Figure 2.4 shows the streamlines and velocity field at 2700 crank angle, 800rpm.
The arrows in the right figure signify only the direction of velocity, while its magnitude is
indicated by color. There are two primary vortices, one in the gas and one in the oil
accumulated at the bottom. The vortex in the gas is in the clockwise direction in Figure
2.4. It results from a lid driven cavity flow. The vortex in the oil is in the
clockwise direction in Figure 2.4. At this moment, body force is still downward.
Therefore, the oil close to the piston land flows downward. However, because of the gas
flow, oil on the interface flows upwards and towards the piston land. The difference in
the velocity direction results in the vortex in oil. It is interesting to note that oil close to
the interface starts to rise even when the body force is still downward. Another reason
behind the early rise is surface tension, which adjusts the oil-gas interface profile to
varying body force. The effect of surface tension will be discussed in Section 2.4.1.
CA: 270
Velocity
J7
2
0
Figure 2.4 Oil distribution with streamlines (left) and velocity field (right) before body force switches to upward direction, 800rpm
Early rise also occurs in the thin base layer on piston land. Since the interface
profile is almost flat there, it is caused dominantly by gas flow. Upward velocity first
occurs in the layer at 277* crank angle, when the body force is still downward.
Figure 2.5 shows the complete oil re-distribution process before TDC bridging
occurs. The body force switches to the upward direction at roughly 2850 crank angle.
However, by comparing the oil-gas interface at 276* and 285* crank angle, it can be
found that the oil accumulated at the bottom has already crawled upward slightly when
the body force is still downward. As will be explained in Section 2.4.1, this is caused by
surface tension. After 285' crank angle, the oil cluster continues to adjust its shape under
the effect upward body force and surface tension. Such adjustment continues until a thin
film flow initializes on the piston land at 315' crank angle.
Then, oil rises along piston land in the form of a slender puddle. Details about this
process will be explained in Section 2.4.4.
CA: 276 CA: 285 CA: 296 CA: 315 CA: 330 CA: 340 CA: 343 CA: 345 CA: 350
Figure 2.5 Complete evolution of TDC bridging, 800rpm
CA: 343 CA: 345 CA: 350
00050 100040 100000 99960 99920 99900
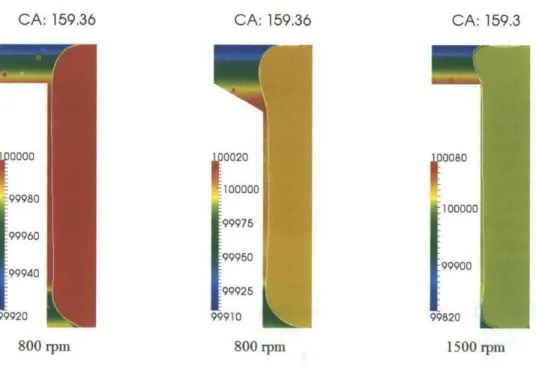
Figure 2.6 Pressure field, 800rpm (Gas pressure is almost uniform. It is set to be 100000Pa.)
After the puddle head reaches the lower flank of the second ring (340' crank angle), the oil will spread along the ring flank (3430 and 345' crank angle). The pressure field during the spreading process is shown in Figure 2.6. The impact of oil generates a high pressure in the top left corner. The high pressure diverts the upcoming oil and drives the spreading oil. When the oil front reaches the liner, bridging occurs (350' crank angle). As shown in Figure 2.6, the pressure in the corner formed by second ring flank and liner
is low because of surface tension. Resultantly, an inverse pressure force exists in the oil
layer on the liner, which prevents bridging. Thus, the bridging process is governed by the
competition between viscous force caused by the liner motion and Laplace pressure
associated with surface tension.
As can be observed in Figure 2.5 (after
3300
crank angle), as the oil puddle rises
along the piston land, there is always some oil left in the corner bounded by the upper
OCR flank and the piston third land. The upward body force fails to drive it. The
interface of this residual oil is in a circular shape. Actually, in the leftmost figure of
Figure 2.5, there is a circular-shaped oil in the corner bounded by the lower second ring
flank and the piston third land. This is the residual oil that the previous downward body
force failed to drive. In real engine operations, the lower residual oil can possibly be
drained through the clearance between an upper OCR flank and the OCR groove, which
contributes to reduce oil consumption. However, the upper residual oil can possibly leak
though a second ring clearance, which potentially increases oil consumption. A
quantitative model on the circular residual oil will be presented in Section 2.4.2.
2.3.2 At a High Engine Speed
CA: 270
Velocity 0.8 20 10 0Figure 2.7 Streamlines (left) and velocity field (right) before body force switches to upward direction, 4500rpm
Figure 2.7 shows the velocity field at 270' crank angle, 4500rpm. While the
vortex in gas is still present, vortex occupying the bulk of oil is not observed. Instead, themajority of oil is flowing upwards and towards the piston land. Since the quantity of oil is
smaller than that at 800rpm, a larger portion of oil is affected by the drag force of gas.
Furthermore, body force varies more rapidly at higher engine speed, which results in a
more rapid interface evolution. It indicates that the early rise is a more pronounced
phenomenon at higher engine speeds.
Early rise in the base layer, which is dominated by gas flow, initiates at roughly
2770 crank angle.CA: 276 CA: 285 CA: 290 CA: 297 CA: 312 CA: 326 CA: 327 CA: 331 CA: 339
Figure 2.8 Complete evolution of TDC bridging, 4500rpm
Figure 2.8 shows the complete oil re-distribution process before TDC bridging
occurs. It is qualitatively similar to that at a low speed (800rpm). The initialization of thin
film flow takes less time, though the quantity of oil is smaller. Unlike the low speed case,
oil spreads on the lower flank of second ring in the form of a thin film flow. This is
because the radius of oil-gas interface in the vicinity of the top left corner is small
compared to the piston-liner clearance. This will be explained in Section 2.4.3. The
pressure field is demonstrated in Figure 2.9.
A circular residual oil also exists in the lower left corner. However, the quantity is
remarkably smaller than that in the low speed case. Besides, there is also a small quantity
of oil residing on the upper OCR flank. As can be observed in Figure 2.8
(2970
crank
angle), when a thin film flow initializes on the piston land, there is also a thin film flow
on the upper OCR flank. The latter one is driven by pressure gradient, which is
considerably weaker than body force. At this high engine speed, body acceleration is
large, and therefore oil rises rapidly along the piston liner. The oil film on the OCR flank,
driven by a weaker force, is not able to follow the rapid bulk flow on the piston land. As
a result, a bottleneck between these two films forms on the OCR flank, as shown in
Figure 2.8 (312' crank angle). The thin film on the OCR flank is eventually isolated by
the bottleneck. After that, the shape of the residual oil layer is determined by the balance
between surface tension and body force.
CA: 327 CA: 331 CA: 339 0600 -100400 100200 100000 99800 99700
Figure 2.9 Pressure field, 4500rpm (Gas pressure is almost uniform. It is set to be 100000Pa.)