IX. COMMUNICATION RESEARCH
A. MULTIPATH TRANSMISSION
Prof. L. B. Arguimbau Dr. C. A. Stutt G. M. Rodgers
Dr. J. Granlund E. E. Manna R. D. Stuart
R. A. Paananen
1. Speech and Music. Transatlantic Tests
Tests are in progress on 11.6575 Mc/sec. The interference from broadcast and code stations has been so severe that special regenerative band elimination filters have had to be made. They have resulted in an improvement of 30-40 db in the resultant signal-to-interference ratio. We now have a margin of 20-30 db between the minimum signal and maximum interference as averaged on a fast pen recorder. Pulse patterns indicate spreads of as much as 4 msec in transmission time over the various effective ionospheric paths. The few tests carried out, using peak deviations of + 10 kc, compare favorably on intelligibility with commercial telephone circuits, but are not of good enough quality for broadcast relaying. The possibility of improvement by the use of diversity receptions is being considered.
J. Granlund, C. A. Stutt, L. B. Arguimbau
2. Television
The nature of the resultant signal produced by two-path transmission has been discussed in earlier reports. When the two signals are nearly equal in strength the frequency of the resultant signal is near the average frequency most of the time but is widely different for short periods. These "frequency spikes" occur at the difference frequency and are such that the average frequency of the resultant is exactly that of the larger signal (Interference in Frequency-Modulation Reception,
Technical Report No. 42, p. 6, Research Laboratory of Electronics, M. I. T. January, 1949). In the case of sound transmission these spikes usually occur at a supersonic rate and can be averaged out. For picture transmission this is no longer the case and the spikes appear as a number of black or white lines following any sharp transition.
The effects of the spikes can be reduced by the use of de-emphasis, the video signal being pre-emphasized before transmission. The pre-emphasis of a video waveform gives rise to overshoots which must be removed with clipping circuits to prevent band-width limitations from being exceeded. The removal of these overshoots results in a deterioration of picture quality. The present investigations are directed towards pro-ducing the best compromise which is to be compared with pictures obtained using amplitude modulation.
R. D. Stuart, E. E. Manna, G. M. Rodgers
-36-(IX. COMMUNICATION RESEARCH)
3. Simplified FM Receiver
The typical requirements of a commercial FM receiver are being studied. For this purpose the Massachusetts area has been mapped to find the normal and also the worst interference conditions met for FM broadcasts. This is being done as a practical example of the selectivity requirements that a receiver should meet. The receivers we have been using on the multipath project have differed from commercial models in many ways. In particular the linear i-f amplifiers have had less variation in transmis-sion within the passband than is usual. This renders the selectivity problem more difficult. An effort is being made to meet both the flatness and selectivity problems without getting a prohibitively elaborate design.
It should be noted that this project is being carried on with the objective of narrowing the gap between the complex laboratory receiver we have been using and the home-type and communication-type receivers now commercially available. We are not trying to produce a completed commercial design but rather to study the appli-cability of the laboratory techniques to receivers that are within the reach of commer-cial practice.
R. A. Paananen
-37-(IX. COMMUNICATION RESEARCH)
B. STATISTICAL THEORY OF COMMUNICATION
Prof. J. B. Wiesner B. A. Basore P. E. Green, Jr. Prof. W. B. Davenport, Jr. R. S. Berg B. Howland Prof. R. M. Fano J. J. Bussgang L. G. Kraft
Prof. Y. W. Lee M. Coufleau A. J. Lephakis
Prof. J. F. Reintjes C. A. Desoer R. M. Lerner
Dr. P. Elias L. Dolansky M. J. Levin
B. M. Eisenstadt
1. Multichannel Analog Electronic Correlator
The design of the five-channel correlator has been nearly completed. Pulse distri-bution circuits and the circuits comprising the A sampling-pulse channel have been
constructed. The remainder of the equipment is now being built. Various direct coupled integrators are being investigated in order to obtain a simple circuit that is acceptably drift-free and has a time constant of approximately 250 seconds.
Y. W. Lee, J. F. Reintjes, M. J. Levin
2. Analog Electronic Correlator for Second-Order Correlation
If fl(t) is a member function of a stationary random process, the second-order auto-correlation function is defined as
T
11112) lim fl( ) fl(t + T1) f1(t + T2) dt . (1) -T
This expression is a time average for 9111 and the equivalent ensemble average is
1 1 1 (T1, T2) =
f
f
f
yly23
p(y 1,y2'y 3 ; i,T 12)
dyldy2dy3 (2)-00 -00 -00
where p(yl'Y2'Y3 ; T1,T 2) is the second joint probability distribution density of the random process.
If at times t, t + T 1, and t +
7
1 + T2 the values of the ensemble are al , a Z, a3 ... blb 2,b 3 ... ; and c1 ,c 2, c3,... respectively, then Eq. 2 may be expressed asN
11 T2)= lim
abn cn.
(3)N-00 T ,T
Nolg n= 1T 1 2
For large values of N, the approximate expression is
-38-(IX,
COMMUNICATION RESEARCH)
N
1 ll(1 , 2") ^ anbncn (4)
n=l T1' 2
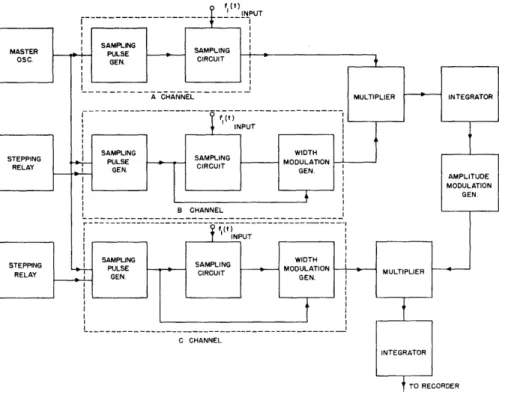
Equation 4 may be evaluated electronically by means of a device employing analog-computer techniques. The waveforms in Fig. IX-l show the method of carrying out the computation. Sections of the wave in Fig. IX-la, each of duration T, form an ensemble of random waves. During each T period, three samples of the signal amplitude are taken. Thus if the sampling pulses are separated by intervals
7
1 and T2 as indicated in Fig. IX-ib, the corresponding signal amplitudes at the instants of sampling are al, bl , and c1 for the first sampling period, a2,b2, arnd c2 for the second sampling period, and so on (see Fig. IX-la).In order to obtain the product of the a, b, and c samples as required by Eq. 4, a rectangular pulse of amplitude proportional to a and width proportional to b is first generated. The area under this pulse is therefore proportional to the product ab (see Fig. IX-1c). A second pulse is then generated so that its amplitude is proportional to the product ab and its width is proportional to c (see Fig. IX-1d). The area under this pulse is the product abc.
The areas under the abc-product pulses resulting from N sets of samples may be summed by applying the product pulses to an integrator. The integrator output voltage after N sets of samples is then proportional to the second-order autocorrelation function of the signal for the particular delay intervals T1 and T 2. A three-dimensional family of the correlation functions may be obtained by repeating the above steps for various values of
72,
with T1 held constant at different values.Figure IX-2 shows a block diagram of the circuits required to carry out the com-putations. It may be noted that the unit is similar to the single-channel analog elec-tronic correlator now being used in the laboratory to compute first-order correlation functions. (See J. F. Reintjes: An Electronic Analog Correlator, Technical Report No. 189, Research Laboratory of Electronics, M. I. T., to be published). The import-tant difference is that for the second-order computation, a third channel (the C channel in Fig. IX-2) is necessary in order to obtain three samples of the input signal during each sampling period.
Y. W. Lee, J. F. Reintjes
3. Cathode Ray Tube Display of Correlator Output
In order to improve on the usual graphic-recorder display of the correlator output, display on a cathode ray tube was tried. All the experiments were conducted on the analog electronic correlator (J. F. Reintjes: An Analog Electronic Correlator, Technical Report No. 189, Research Laboratory of Electronics, M. I. T., to be
39-I (t)
(a) SIGNAL WAVE
T
1 iTT 2 t
(b) SAMPLING PULSES
(c) MULTIPLICATION OF a AND b SAMPLES
1 b t
(d) MULTIPLICATION OF a,b AND c SAMPLES
(e) SUMMATION OF a,b,c PRODUCTS
Fig. IX-1
Computation of second-order
corre-lation functions by method of
dis-crete sampling.
Fig. IX-2
Block diagram of an analog computer for evaluating
second-order correlation functions.
I
~
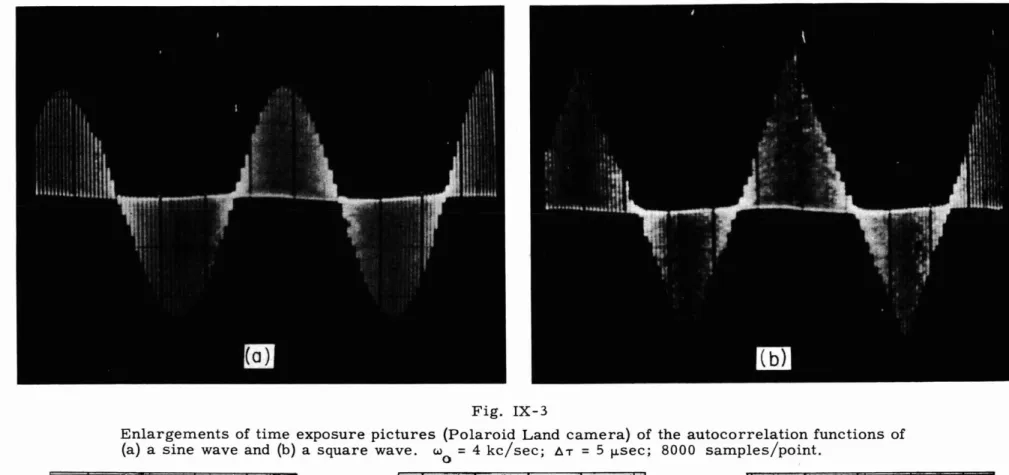
..-IFig. IX-3
Enlargements of time exposure pictures (Polaroid Land camera) of the autocorrelation functions of
(a) a sine wave and (b) a square wave. w =4 kC/ sec; h. T = 5 /-Lsec; 8000 samples/point.
o
( C
)_~_"--"'--"
Fig. IX-4Graphic records (Esterline-Angus recorder) of the autocorrelation functions of (a) a sine wave with bias added,
(b) a square wave with bias added, (c) a sine wave with no bias added. w = 4 kc/sec; h.T = 5 /-Lsec; 8000 samples/point.
(IX. COMMUNICATION RESEARCH)
published), of which the performance was being checked.
A horizontal sweep for the cathode ray tube was obtained from the stepping voltage generated within the correlator to control the trigger delay of the phantastron. The correlator output was d-c coupled to the vertical deflection plates. Figure IX-3 shows time exposure photographs taken with a Polaroid Land camera from the screen of a Tektronix Mod. 512 oscilloscope. A comparison of these correlation curves with the Esterline-Angus records in Fig. IX-4 is of interest.
1. A presentation in linear coordinates has been achieved with the cathode ray tube display.
2. On the cathode ray tube the display abscissa and the actual delay (T) are controlled in synchronism, while on the graphic recorder the time base is driven com-pletely independently of T. The latter system is thus liable to errors if the stepping
voltage or the drive speed varies irregularly. For example, the long T step taken by the correlator every 10 points cannot be detected on the graphic records while it is immediately noticeable on the photographs.
3. Mechanical friction, inertia effects, pointer backlash and inking errors inherent to recorders have no counterpart in the cathode ray tube display method. The electron beam deflects faithfully in either direction. Sensitivity is increased since no bias is necessary.
4. The use of a Polaroid Land camera permits a picture to be developed within one minute of the end of a correlation run which lasts about 18 minutes. Resolution on the enlargements of the original picture is excellent.
5. Careful study of the photographs discloses the presence of switching transients between steps and of variations in the speed of writing. An effort is being made to perfect the machine performance on the basis of this information.
J. F. Reintjes, J. J. Bussgang, M. Coufleau
4. Crosscorrelation Functions Relating to Amplitude Clippers
Some interesting results concerning crosscorrelation functions of input and output
412(T)
of a symmetrical two-level clipper (no delay) have been computed in terms of the input autocorrelation function 11 (T).In the case of a sinusoidal input
12
21(
T11(0)
22(0
).()
(1)
In the case of gaussian noise input
12() = 21 (T) T 411(0) 22( 0 ) ) ((0
-42-(IX. COMMUNICATION RESEARCH)
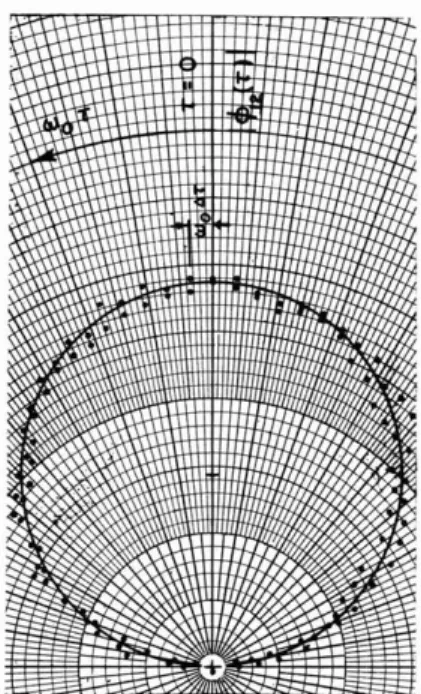
Fig. IX-5
Polar plot of one period of the crosscorrela-tion funccrosscorrela-tion <V
12
(T)
of a sine input and theclipper output. AT
=
5 J.Lsec; w=
2000 cps;o 8000 samples/point. \
)
JI
AThe above theoretical results have been confirmed experimentally within the accuracy of the electronic analog correlator (see above).
In evaluating <V
12
(0)
for a sine wave input to the clipper, polar diagrams were usedand the radius of the circle interpolated (see Fig. IX-5). In this way we used all the
points of the curve instead of using just the peak points and taking their average.
J. B. Wiesner, J. J. Bussgang
5. SYnthesis of Speech from Short Time Autocorrelation Function
An experiment has been performed to establish the possibility of speech synthesis
from a short time autocorrelation function. Available for this purpose was the M.I. T.
short time speech correlator
(1, 2)
which provides an analysis of the speech signal intoa thirteen-point representation of the autocorrelation function. Since no machine has
yet been built to perform the corresponding synthesis operation directly in the time
domain the following indirect method was employed. The cosine transformation of the
short time correlation function was generated giving the short time power spectrum
(3),
which was then combined using the synthesizer section of an eight-channel Bell
Tele-phone Laboratories vocoder (4) to form speech. The cosine transformation, which in
this case amounts to a linear transformation .of the correlator output signals with con-stant coefficients, was derived by means of a resistance matrix or weighting circuit.
Each resistance Rmn in the 8 by 13 array was chosen to correspond to a particular
delay T in the corresponding correlator channel, and the particular center frequency
m
-43-(IX.
COMMUNICATION RESEARCH)
ELECTRONIC COMMUTATOR
BELL TEL LAB. TAPE RECORDER VOCODER
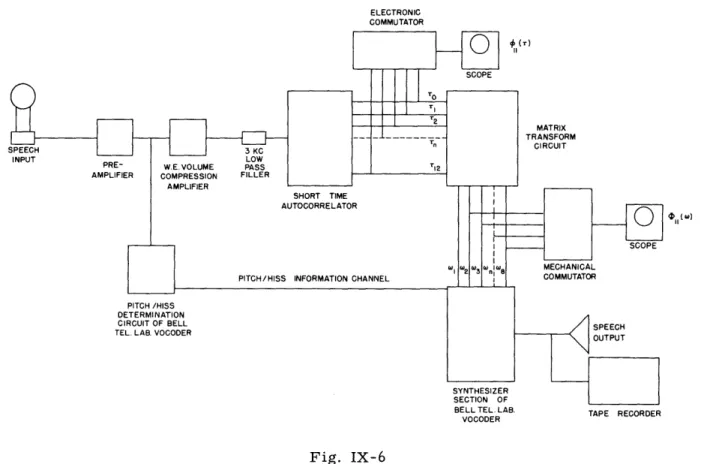
Fig. IX-6
Block diagram of experiment for synthesizing speech
from short time autocorrelation function.
W(n of a vocoder channel as follows:
Rmn
=
1
l/(cos r m W )
I(Negative coefficients
were effected by means of phase inverters in each of the correlator channels and the
resistances were connected to the appropriate polarity signal. ) A block diagram of the
whole setup is shown in Fig. IX-6; a further complication necessary for the experiment
was the pitch/hiss channel input to the synthesizer which was supplied from the
corre-sponding section of the vocoder analyzer.
This additional information about the speech
signal was found to be essential for producing intelligible speech output.
Electronic
and mechanical commutators were used to monitor the correlation function and
fre-quency spectrum signals, respectively, at the input and output of the matrix, and to
facilitate alignment of the system. The speech output of the synthesizer was recorded
on a magnetic tape and records of preliminary tests are on file.
Two tests of the system performance were made: First we tested the frequency
response of the correlator and matrix transform circuit for sine-wave input to the
correlator shown in Fig. IX-7.
Here the output voltage of several of the frequency
channels is plotted against the frequency.
It will be noted that this curve is a sin W/W
curve displaced by the amount of the center frequency; it is acutally just the Fourier
(IX.
COMMUNICATION RESEARCH)
M 0 00 4 I 0 (D 1 a_ INPUT FREQUENCYFig. IX-7
Frequency response curves for
autocorre-lator and matrix transform circuit.
transform of the boxcar-type weighting function in the time domain implicit in the use
of only thirteen points to represent the correlation function. These response curves
can be modified by giving different weight to the different delay channels; this would
permit reduction of the spurious negative responses at the sacrifice of sharpness of
the resonance peaks; however, no measurements of the effect of different weighting
functions on the over-all speech intelligibility of the system have been made.
The
second was an over-all test with speech passed through the whole system; the word
articulation score was not measured but was estimated at 30 percent, enough to enable
understanding of simple sentences and other highly redundant text. There was some
indication in these tests that the response of the integrating filters in the correlator
output channels, approximately 20-cycle cutoff, was too slow to follow rapid speech
articulation; further tests should be made with faster integrating circuits and other
refinements.
The main purpose of this experiment was to show that the essential information
required to convey speech intelligibility is contained in the short time correlation
function, in particular as derived by the present model speech correlator, with the
possible necessary addition of an extra channel to convey information concerning the
excitation function, i. e. whether the sound was voiced or unvoiced.
The test described
above was imperfect in realizing the full information content of the correlator output
signals: (a) information is certainly lost in the linear transformation from the thirteen
correlator signals to the eight channels of the synthesizer and (b) the frequency
response characteristics of the synthesizer did not match exactly those of the correlator
matrix combination; indeed it would require some sort of different weighting function
(IX. COMMUNICATION RESEARCH)
to give a realizable, i. e. nonnegative, frequency response for the correlator matrix
combination.
It is believed possible to build a much better synthesizer than the one described
above, with all thirteen channels using direct synthesis in the time domain and with an
exact match of frequency response characteristics which would perhaps give a much
higher articulation score; it would show much better the true possibilities of the
correlation-function representation of the speech wave (5).
Such a system would be the exact analog of the vocoder system which uses frequency
band analysis, and might prove to be more practical to instrument, using timing and
switching circuits in place of frequency filtering.
B. Howland, B. A. Basore, R. M. Fano, J. B. Wiesner
References
1.
P. E. A. Cowley: Master's Thesis, Dept. of Electrical Engineering, M. I. T. 1949
2.
Quarterly Progress Report, Research Laboratory of Electronics, M. I. T. p. 68,
January 15, 1950
3. R. M. Fano: J. Acous. Soc. Am. 22, No. 5, 546, 1950
4.
H. Dudley: J. Acous. Soc. Am.
11,
169, 1939
5.
Quarterly Progress Report, Research Laboratory of Electronics, M. I. T. p. 70,
January 15, 1950
6.
Information Theory
a.
Energy limitations in information theory
An attempt has been made to reconsider some fundamental physical facts in the
light of the information theory. Taking into account only the basic sources of noise
some physical consequences were obtained from the fundamental theorem of the
information theory (1, 2).
Starting from Nyquist's theorem and the definition of the channel capacity, we have
found that an amount of energy of at least kT log 2 must be spent in order to transmit
one bit of information.
Reasoning on Szilard's one-molecule engine (3) has shown that given one bit of
in-formation about the system an amount of energy kT log 2 can be extracted from the
heat reservoir at temperature T which is assumed to be surrounding the engine.
It
has further shown that kT loge2 is the maximum amount of energy that can be obtained
from one bit of information.
The above results are valid only in the range hv << kT.
-46-(IX. COMMUNICATION RESEARCH)
We have analyzed a specific system operating in the range hv >> kT and found that the limit is essentially kT loge2 ergs/bit.
This work will be published in the near future.
C. A. Desoer, R. M. Fano
References
1. C. E. Shannon: Mathematical Theory of Communications, p. 39, University of Illinois Press, 1949
2. R. M. Fano: Transmission of Information II, Technical Report No 149, p. 14, Research Laboratory of Electronics, M. I. T. Feb. 1950
3. L. Szilard: Zeit. f. Physik 53, 840, 1929
b. Transmission of information through channels in cascade
This work is a first step in the generalization of information theory towards a general theory of communication through an arbitrary network.
It was first assumed that there is no storage decoding and recoding between two consecutive channels in order to approximate the situation occurring in practice.
Discrete and continuous channels have been considered. Theoretical developments were carried out to enable study of the variation of the channel capacity with respect to the number of channels. Numerical results have been obtained for binary channels.
A pulse code modulation system has been compared to a continuous type of trans-mission; the great difference in performance tends to show that even the rough form of coding of the former can considerably improve the behavior of the system.
C. A. Desoer, R. M. Fano
-47-(IX. COMMUNICATION RESEARCH)
C. HUMAN COMMUNICATION SYSTEMS
Dr. R. D. Luce F. D. Barrett J. B. Flannery J. Macy, Jr. D. G. Senft
A. G. Simmel
P. F. Thorlakson
The work of this group will be reported at a later date.
-48-(IX.
COMMUNICATION RESEARCH)
D. PARALLEL CHAIN AMPLIFIER
The parallel chain amplifier is a very wide band one that overcomes the basic gain bandwidth limitation of conventional amplifiers. The method is to divide the band into
parts small enough so that each may be amplified by a conventional chain. These chains are then paralleled to produce an amplifier of arbitrary gain and bandwidth.
As was mentioned in the Quarterly Progress Report, July 15, 1951, a frequency-scaled model has been built to demonstrate the theory involved. Work has continued in the direction of building a full-scale model. The 6AK5 pentode was chosen and its input
and output admittance measured as a function of frequency in a variety of circuits. The circuit which gave the best results was used to build a four-tube, stagger-tuned chain. A minimum of 16-db gain over the band 130-260 Mc was obtained.
The reason for the difficulty in amplifying in the uhf region is a loading produced by the transit time effect and the lead inductance of the tubes. Attention was focused on the
grid circuit admittance, where this loading is most pronounced. Measurements were made with a G. R. admittance meter and associated equipment, including the AN/APR-1 as a null detector. This setup gave repeatable, consistent results and was simple to operate. The grid terminals were connected to the meter by a coaxial cable and hence a Smith chart was needed to correct the readings. The results were obtained as a plot on the Smith chart and proved useful as a comparative device between different connec-tions.
Some of the circuits used are shown in Fig. IX-8. The main difference lies in the connections made to the two cathode leads. In Fig. IX-8a, one cathode lead is used for the grid return and the other for the plate and screen return. This connection minimizes the inductance common to the grid and plate circuits. The Smith chart plot of the input
admittance has a loop which goes deep into the heavy conductance area of the chart and appears unusable much above 200 Mc.
In the circuit of Fig. IX-8b, the plate and screen return is made to ground and the second cathode lead is unused. This circuit resulted in a plot which had a cusp at about 280 Mc which protruded into the heavier conductance region. The protrusion was not so severe as to make the tube unusable in this region (that is, to have a maximum gain less than unity). The plot above the cusp showed good results up to about 350 Mc.
The circuit of Fig. IX-8c is a combination of the previous two circuits in that the plate and screen return is made to both the cathode and ground. This connection gave a
smooth plot with no loops or cusps and appeared useful to 300 Mc.
The circuit of Fig. IX-8d differs from Fig. IX-8c in that an interstage network of the type to be used has been inserted in the plate circuit. This interstage consists of the three coils shown plus the interelectrode capacitances which shunt the end coils (the
series capacitor is used for blocking) and has two resonant frequencies. When these
-49-6AK5 COAX B+ PIN2 PIN7 -4000 3000 2000 6AK5 COAX PIN2 PIN7 DISTANCE BETWEEN GROUNDS 1-1/2" GRID OF ANOTHER 6AK5 1000 500 400 300 200 (c) (d) GRID OF ANOTHER 6AK5 6AK5 COAX SB+
ACTUALLY THESE LEADS ARE VERY SHORT
(e)
Fig. IX-8
Circuit connections.
All resistors are 200 ohms;
all capacitors are 0. 001 f.
B+ is 122 volts.
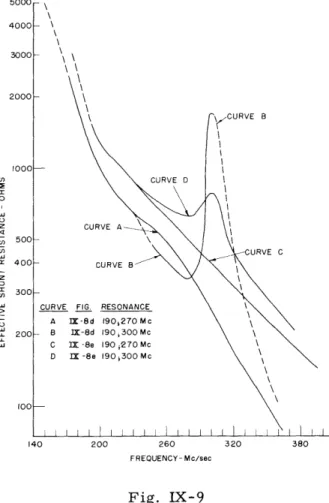
\\ \\\ CURVE A-CURVE 8 CURVE A - B C D FIG. IX-8d IX-8d rl -8e I -8e RESONANCE 190O270 Mc 190 300 Mc 190 270 Mc 190 300 Mc 140 200 260 320 380 FREQUENCY- Mc/sec
Fig. IX-9
Effective input shunt resistance
-
6AK5.
LL1 1 1 I I I I I CT\I\~ E F 0
I
I' ' ' ' ' ' i' L' ' ' ' '
II(IX.
COMMUNICATION RESEARCH)
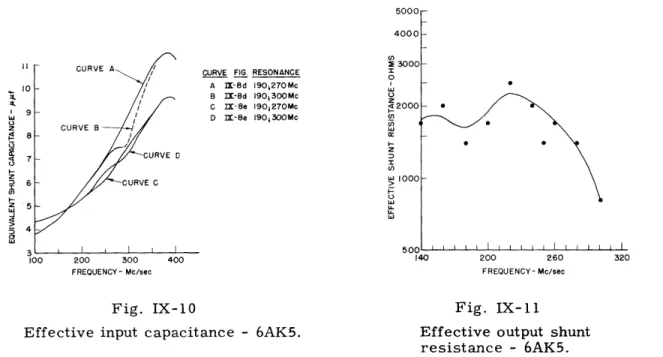
5000 4000 0 4 Z I-5 o 3000CURVE FIG. RESONANCE T o A 3I-8d 190,270Mc B X-8d 190300Mc C IX-8e 190270Mc <2000 D IX-8e 190300Mc z I cn LL LL I 140 200 260 320
FREQUENCY- Mc/sec FREQUENCY- Mc/sec
Fig. IX-10
Fig. IX-11
Effective input capacitance
-
6AK5.
Effective output shunt
resistance - 6AK5.
two resonant frequencies are set at 190 and 270 Mc the admittance plot is essentially the
same as that for Fig. IX-8c.
However, for resonances at 190 and 300 Mc a pronounced
hump was noticed around 300 Mc in the direction of smaller conductance.
This change
gives hope of using the tube at 300 Mc and above.
The data obtained for these two
con-ditions are plotted in Figs. IX-9 and IX-10 as equivalent shunt resistance and equivalent
shunt capacitance, respectively, as functions of frequency.
The connections of Fig. IX-8e are a result of discussing the problem with an
engi-neer of the RCA Application Engiengi-neering Department.
He mentioned that minimizing
the cathode lead inductance was more important than minimizing the lead inductance
common to the grid and plate circuits.
The circuit of Fig. IX-8e minimizes the cathode
lead inductance by effectively paralleling the two leads, at the expense of greatly
in-creasing the common inductance.
His advice proved sound and results better than those
from Fig. IX-8d were obtained. These are plotted in
8-
Figs. IX-9
and IX-10.7-
The output admittance (between plate and ground) for
S6 the connection of Fig. IX-8c is indicated in the plots in Figs. IX-11 and IX-12.
.4
The chain which was built was simply a succession of
3 I I four circuits like that of Fig. IX-8e terminated in another
100 200 300 400
FREQUENCY-Mc/sec
6AK5 which served a dual role as a load and an isolation
Fig. IX-12
for the measuring equipment.
The coils were all
slug-Effective output shunt
tuned, with the slugs isolated from ground to avoid
ex-capacitance
-
6AK5.
cessive stray capacitances.
Gain measurements were
-51--^^^
5
(IX.
COMMUNICATION RESEARCH)
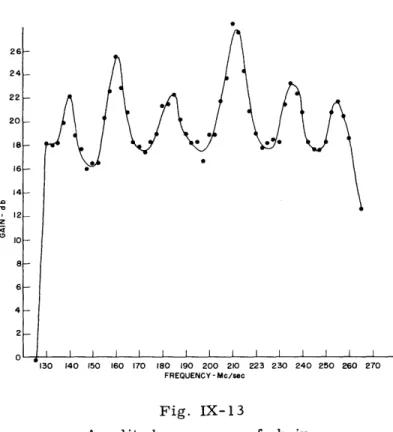
z
o
FREQUENCY- Mc/sec
Fig. IX-13
Amplitude response of chain.
made by the substitution method using a G. R. 1021 AV signal generator and the APR-1
as a detector. An accuracy of better than 1 db is expected.
The amplitude
character-istic is plotted in Fig. IX-13.
No attempt to smooth off the peaks was made, although
this could be done by resistive padding with a sacrifice in gain. When considering these
results, it should be noted that additional stages would be tuned to fill in the valleys so
that it is reasonable to take the gain of these four stages as its average, say 20 db.
The
gain per stage then is 5 db, assuming at least several stages.
This compares favorably
with the maximum theoretical gain using two terminal pair interstages, without any
shunt conductance, which is 6. 1 db per stage. This is based on the following
capaci-tances:
Tube Input
6 [±f
Includes socket capacitances
Tube Output
5
(see Figs. IX-10 and IX-12).
Stray
4
It is hoped that in the near future another chain to cover the range 0-130 Mc will be
built and the two combined.
A penalty of the order of 10 db is expected for paralleling.
Our consolation is that this penalty need be paid only once, no matter how many tubes
are used.
R. K. Bennett, J. G. Linvill
(IX.
COMMUNICATION RESEARCH)
E.
EXPERIMENTAL APPROXIMATION AND NETWORK ALIGNMENT
In the Quarterly Progress Report, July 15, 1951, a method was described to
facili-tate the alignment of a network to bring its response to a standard signal into
corres-pondence with a desired response.
The method involves application of the fact that small
changes in the parameters of the network result in changes of the response which are
linearly related to the amount of element change.
The technique suggested employs the
generation of the functions which represent the change in response with small unit
changes in each of the elements.
A further experimental step generates a family of
nor-mal orthogonal functions which are linearly dependent upon these functions.
The
orthog-onal functions are then used essentially to analyze a misaligned network to prescribe the
changes in it to bring its response to that desired.
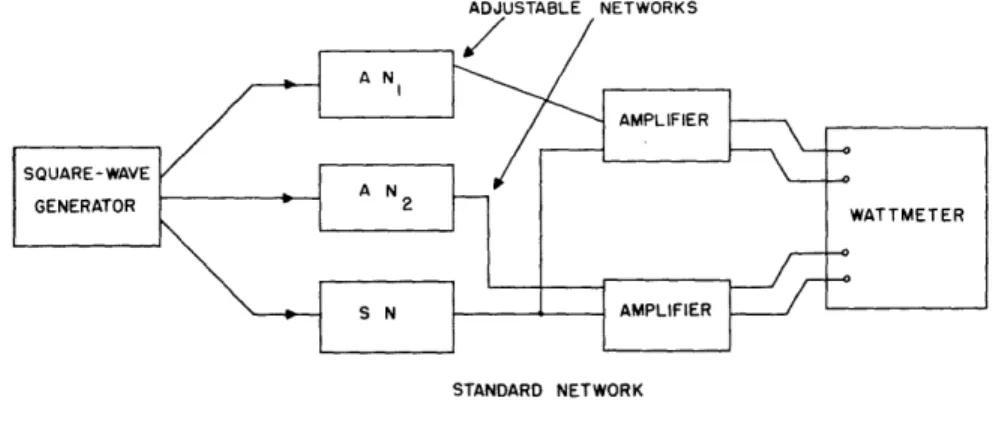
A simple laboratory test has been run which checked the practicability of the
align-ment technique with affirmative results. A block diagram of the experialign-mental setup is
shown in Fig. IX-14. The networks used were simple low-pass filters, one constructed
of fixed elements and two with adjustable elements.
The network configuration and
approximate element values are given in Fig. IX-15.
The network with fixed elements
is the standard network and its response to the square wave is the standard or desired
response.
The adjustable networks are used for multiple purposes. If in one of them all
elements but one are adjusted to the standard values, with the one element a unit
differ-ent, the connected amplifier of Fig. IX-14 receives a voltage which is the change in
response corresponding to a unit change in that element.
By setting a number of the
elements of the adjustable network in the proper manner (see Quarterly Progress
Report, July 15, 1951) one can cause the amplifier to receive a voltage which is one of
the orthogonal functions mentioned. Finally, one of the networks can simulate a network
being aligned, while the companion adjustable network is successively adjusted to present
STANDARD NETWORK
Fig. IX-14
Block diagram of test setup.
-53-(IX. COMMUNICATION RESEARCH)
1000 n 3.0 HENRYS the family of orthogonal functions to the
ampli-fier. The corresponding succession of
watt-1.6 f
meter readings shows the changes which should
be made to bring the misaligned network into
alignment. Ine wattLeter is a simple Iorm of
Fig. IX-15
instrument which shows the average product of
Configuration and approximate
two variables fed to it.
The amplifiers of
element values of networks
Fig. IX-14 are used as differencing circuits.
used.
The square wave has a repetition rate of 30 cps;
this frequency is chosen to make the wattmeter most effective as an averaging multiplier.
The experimental results will be covered fully in a forthcoming technical report.
It is clear from results observed with this simple example that the method is practically
workable, and that a wattmeter is a very effective averaging multiplier in this frequency
range.
It is proposed to make further study of the technique in practical instances at
higher frequency ranges.
As indicated earlier, the same technique of adjustment can be applied in the
approxi-mation problem solution by successive approxiapproxi-mations.
The question of designing
suitable model networks for such a device is being investigated by W. I. Wells.
J. G. Linvill
F.
NEW METHODS OF NETWORK SYNTHESIS
Technical Report No. 201 has been prepared and is scheduled for publication. This
report presents synthesis procedures that realize practical RLC and RC networks. The
RLC networks are practical in that they contain no mutual inductance and no perfect
coils, i. e. every inductance has an associated series resistance.
New techniques
employed in the procedures are first discussed in detail and then applied to various
synthesis problems.
Included among the procedures for synthesizing RLC networks are
those for realizing unbalanced structures and lattices whose arms possess identical
poles. Reduction of the lattices to unbalanced forms is considered, and it is shown that
if real transformers are allowed, i. e. transformers with winding resistance,
magne-tizing inductance and a coupling coefficient smaller than one, then the lattice realization
for a transfer admittance is always reducible.
Unbalanced networks are realized directly by the RC synthesis procedure.
The
number of elements required is smaller than that required by the Guillemin method of
RC synthesis.
Finally, two new synthesis procedures are presented for realizing a Darlington
network without any ideal or unity coupled transformers, where a Darlington network
is considered to be composed of lossless elements plus only one resistance.
In one
-54-(
(IX. COMMUNICATION RESEARCH)
of the two procedures the single resistance appears not as a termination but within the network.
L. Weinberg, E. A. Guillemin
G. TRANSIENT PROBLEMS
1. Basic Existence Problems
The report on this work will be resumed in the Quarterly Progress Report of January 15, 1952.
2. Network Synthesis for Prescribed Transient Behavior
This problem has been completed and will be presented in T echnical Report No. 209. W. H. Kautz