HAL Id: hal-01464834
https://hal.archives-ouvertes.fr/hal-01464834
Submitted on 24 Apr 2020
HAL is a multi-disciplinary open access archive for the deposit and dissemination of sci-entific research documents, whether they are pub-lished or not. The documents may come from teaching and research institutions in France or abroad, or from public or private research centers.
L’archive ouverte pluridisciplinaire HAL, est destinée au dépôt et à la diffusion de documents scientifiques de niveau recherche, publiés ou non, émanant des établissements d’enseignement et de recherche français ou étrangers, des laboratoires publics ou privés.
Distributed under a Creative Commons Attribution - NonCommercial| 4.0 International
Enterococcus faecalis.
Nicolas Innocenti, Monica Golumbeanu, Aymeric Fouquier d’Hérouël, Caroline
Lacoux, Rémy A Bonnin, Sean P Kennedy, Françoise Wessner, Pascale Serror,
Philippe Bouloc, Francis Repoila, et al.
To cite this version:
Nicolas Innocenti, Monica Golumbeanu, Aymeric Fouquier d’Hérouël, Caroline Lacoux, Rémy A Bon-nin, et al.. Whole-genome mapping of 5’ RNA ends in bacteria by tagged sequencing: a comprehensive view in Enterococcus faecalis.. RNA, Cold Spring Harbor Laboratory Press, 2015, 21 (5), pp.1018-30. �10.1261/rna.048470.114�. �hal-01464834�
Whole-genome mapping of 5
′
RNA ends in bacteria
by tagged sequencing: a comprehensive view
in Enterococcus faecalis
NICOLAS INNOCENTI,1,2,3MONICA GOLUMBEANU,4,5AYMERIC FOUQUIER D’HÉROUËL,1,6 CAROLINE LACOUX,2,3RÉMY A. BONNIN,7SEAN P. KENNEDY,8FRANÇOISE WESSNER,2,3 PASCALE SERROR,2,3PHILIPPE BOULOC,7FRANCIS REPOILA,2,3and ERIK AURELL1,9
1Department of Computational Biology, KTH Royal Institute of Technology, AlbaNova University Center, SE-10691 Stockholm, Sweden 2
INRA, UMR1319 Micalis, Domaine de Vilvert, F-78352, Jouy-en-Josas, France
3AgroParisTech, UMR Micalis, Domaine de Vilvert, F-78350, Jouy-en-Josas, France 4
Department of Biosystems Science and Engineering, ETH Zürich, CH-4058, Basel, Switzerland
5SIB Swiss Institute of Bioinformatics, University of Basel, CH-4056, Basel, Switzerland 6
Luxembourg Centre for Systems Biomedicine, University of Luxembourg, L-4362, Esch-sur-Alzette, Luxembourg
7Institut de Génétique et Microbiologie, Université Paris-Sud, CNRS, UMR8621, F-91405, Orsay, France 8
INRA, MetaGenoPolis US1367, Domaine de Vilvert, F-78350, Jouy-en-Josas, France
9Department of Information and Computer Science, Aalto University, FI-02150 Espoo, Finland
ABSTRACT
Enterococcus faecalis is the third cause of nosocomial infections. To obtain the first snapshot of transcriptional organizations in this bacterium, we used a modified RNA-seq approach enabling to discriminate primary from processed 5′RNA ends. We also validated our approach by confirming known features in Escherichia coli. We mapped 559 transcription start sites (TSSs) and 352 processing sites (PSSs) in E. faecalis. A blind motif search retrieved canonical features of SigA- and SigN-dependent promoters preceding transcription start sites mapped. We discovered 85 novel putative regulatory RNAs, small- and antisense RNAs, and 72 transcriptional antisense organizations. Presented data constitute a significant insight into bacterial RNA landscapes and a step toward the inference of regulatory processes at transcriptional and post-transcriptional levels in a comprehensive manner. Keywords: primary RNA; processed RNA; promoter; RNA degradation; Enterococcus faecalis
INTRODUCTION
Enterococcus faecalis is a ubiquitous Gram-positive bacterium and one of the first colonizers of the human gastro-intestinal tract after birth. It belongs to the core-microbiota and lives in the guts during the entire human life, suggesting a contribu-tion of the bacterium to intestinal homeostasis (Campeotto et al. 2007; Adlerberth and Wold 2009; Qin et al. 2010). In contrast to this potentially beneficial role, E. faecalis is also the third cause of nosocomial infections and may carry and transfer various antibiotic resistances to other bacterial spe-cies, making its presence in the medical environment a
seri-ous concern (Arias and Murray 2012). The opportunism of E. faecalis, i.e., the transition from commensalism to patho-genicity in response to environmental cues, underlines its ca-pacity to adapt to and survive in harsh conditions. Thus, deciphering the regulatory pathways that enable E. faecalis to undergo the transition from commensalism to pathogeny is a key component in the understanding the dual lifestyle of this microorganism (Gilmore and Ferretti 2003). The V583 strain was one of the first discovered vancomycin-resistant clinical isolates of E. faecalis (Sahm et al. 1989). Its genome, a circular chromosome (3218 kbp) and three circular plas-mids pTEF1 (66 kbp), pTEF2 (57.7 kbp), and pTEF3 (18 kbp), contains at least 3264 annotated protein-coding genes (Paulsen et al. 2003). Although partial transcriptomic
Abbreviations: asRNA, antisense RNA; BHI, brain-heart infusion; dRNA-seq, differential RNA-seq; IGR, intergenic region; ORF, open reading frame; ppRNome, primary and processed transmission; PSS, processing site; PTS, phosphor-sugar transfer systems; RNA-seq, RNA sequencing; Sdh, serine-dehydratase; sRNA, small RNA; TSS, transcription start site; UTR, untrans-lated region
Corresponding authors: [email protected], [email protected] Article published online ahead of print. Article and publication date are at http://www.rnajournal.org/cgi/doi/10.1261/rna.048470.114.
© 2015 Innocenti et al. This article is distributed exclusively by the RNA Society for the first 12 months after the full-issue publication date (see http://rnajournal.cshlp.org/site/misc/terms.xhtml). After 12 months, it is available under a Creative Commons License (Attribution-NonCommercial 4.0 International), as described at http://creativecommons.org/licenses/ by-nc/4.0/.
analyses have been performed (Vebø et al. 2009, 2010; Aakra et al. 2010; Opsata et al. 2011), a comprehensive and dynamic view of the RNA landscape of V583 is missing.
Whole-transcriptome studies of prokaryotes via tiling ar-rays and RNA sequencing (RNA-seq) have unveiled a plethora of actively transcribed RNAs, and highly complex transcrip-tional organizations due to numerous promoters nested in open reading frames (ORFs), antisense (asRNAs) and small RNAs (sRNAs) genes (among other reviews Toledo-Arana and Solano 2010; Georg and Hess 2011). These global studies have been extremely valuable in determining transcribed re-gions in bacterial genomes and comparing RNA expression levels between different physiological states. Yet, their func-tional and regulatory insights remain incomplete as primary and processed RNAs cannot be distinguished and hence tran-scriptional (RNA synthesis) and post-trantran-scriptional process-es (RNA procprocess-essing and stability) cannot be separated. The use of differential RNA-seq (dRNA-seq), an astute method that enriches an RNA population for primary transcripts, partially overcomes these limitations and gives access to the primary transcriptome (Albrecht et al. 2010; Bohn et al. 2010; Irnov et al. 2010; Sharma et al. 2010; Conway et al. 2014; Thomason et al. 2015). Yet, a major limitation of dRNA-seq is that all transcripts cannot be detected in a single experiment as they are degraded by a 5′-phosphate-dependent exonuclease, and thus information on post-transcriptional events is lost (Sharma et al. 2010). Global scale analysis of RNA stability has been performed in a few bacterial species, e.g., Bacillus ce-reus (Kristoffersen et al. 2012), Bacillus subtilis (Hambraeus et al. 2003), Escherichia coli (Selinger et al. 2003; Mohanty and Kushner 2006; Esquerré et al. 2013), Mycobaterium tuberculosis (Rustad et al. 2013), Lactococcus lactis (Redon et al. 2005), and Prochlorococcus (Steglich et al. 2010). These stability analyses have highlighted the broad and crucial con-tribution of RNA stability to gene
expres-sion reprogramming when bacteria face stresses, adapt to novel nutrient condi-tions, or grow at different rates. Those analyses consider transcribed regions as unique entities, where different sorts of RNA molecules can be present and can-not be seen.
We previously described a method that enables us to differentially tag 5′ends of primary and processed RNAs (Fouquier d’Hérouël et al. 2011). In the present work, we have coupled this method to RNA-seq, yielding novel insights into the bacterial RNA landscape where the primary and the processed transcrip-tomes (ppRNome) are unveiled within a single experiment. We have sorted tran-scription start sites (TSSs) and processing sites (PSSs) and validated the method by reproducing known results for E. coli.
The presented data provide a first snapshot of the RNA land-scape of the human pathogen E. faecalis.
RESULTS AND DISCUSSION
Global view of the E. faecalis RNA landscape
Bacterial native (or primary) transcripts undergo cleavage that can be maturation or degradation processes (Rochat et al. 2013). Without the ability to identify and discriminate primary from processed transcripts, we have only partial in-formation of gene expression control at the genome scale.
We have developed a method combining our previously introduced 5′ RNA end tagging (Fouquier d’Hérouël et al. 2011) with deep sequencing technologies and termed it “tagRNA-seq” to visualize the primary and processed tran-scripts of E. faecalis in a genome-wide manner (Fig. 1; Supplemental Table SA and“The ppRNome browser” web-site, see“Visualization of Results” in Materials and Methods). TagRNA-seq was performed on total RNAs extracted from bacteria grown in static (S) and respiratory (R) conditions, providing transcriptomes coined“St” and “Rt,” respectively (Supplemental Section S2, Table S1). In parallel to these, and as control, three other RNA libraries from E. faecalis and one from E. coli were sequenced on different next-gener-ation sequencing platforms (see Materials and Methods; Supplemental Section S2). Globally, St and Rt show that significant transcription occurs in a limited portion of the E. faecalis genome. Out of the 3.34 Mbp long genome, 1.65 Mbp appears to be transcribed in each condition (coverage >2×), including 90 kbp due to antisense transcription and 470 kbp made up by nonannotated and/or noncoding por-tions, i.e., 5′- and 3′-untranslated regions (UTRs), unanno-tated ORFs, and as- and sRNAs (see below). These data are
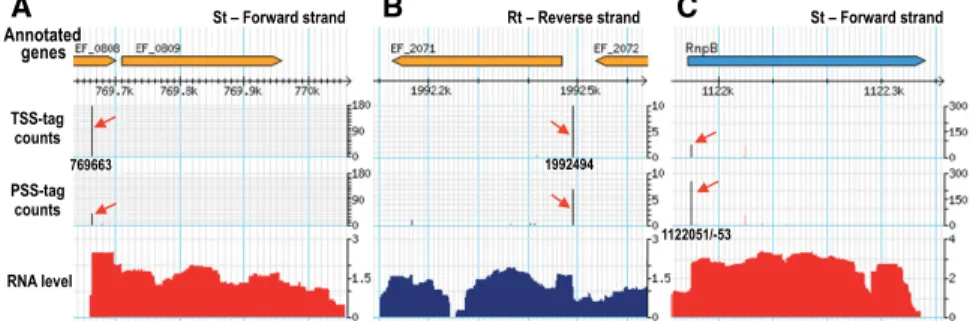
TSS-tag counts PSS-tag counts RNA level Rt A B C Annotated genes 769663 1992494 1122051/-53
FIGURE 1. Three examples of 5′RNA ends viewed by tagRNA-seq on the E. faecalis V583 chro-mosome from the“ppRNome” browser. Below the line “Annotated genes,” coordinates are those of the chromosome. The location of tags detected is indicated by the black vertical lines and the red arrows. TSS-tags are shown in the upper line, PSS-tags in the line below.“RNA levels” show the RNA signal detected; in red from St, in blue from Rt. Accurate values obtained for TSS- and PSS-tag counts and RNA levels are provided in Supplemental Table SA. (A) Transcription start site mapped at 769663/-5 for ef0809. This TSS could be easily predicted from the signal coverage. (B) TSS mapped at 1992494 for ef2071. This TSS is internal to the signal provided by the transcrip-tion of ef2072 and would be difficult to predict. (C ) Processing site mapped at 1,121,951/-53 for the RNA RnpB. This PSS is a dozen nucleotides downstream from the previously mapped TSS (see“Processing sites”).
in line with previous reports highlighting that the informa-tion provided by annotainforma-tions of bacterial genomes on their gene content remains incomplete (Toledo-Arana et al. 2009; Albrecht et al. 2010; Irnov et al. 2010; Sharma et al. 2010; Mitschke et al. 2011; Wurtzel et al. 2012; Conway et al. 2014; Thomason et al. 2015).
The calling of TSS and PSS from tagRNA-seq
We compared deep-sequencing data obtained with tagged and untagged RNA libraries prepared from E. faecalis grown in S conditions. Predictions of 5′ edges based on sequence coverage signals from both libraries show good agreement, indicating that the tagging procedure does not alter the allo-cated coverage nor the location of putative transcription starts (Supplemental Section S3, Figure S3; the ppRNome browser). Several TSSs mapped previously by other methods were retrieved by tagRNA-seq at near-identical locations (±2 bp) attesting to the reliability of the method. For example, we find the TSSs of sodA (ef0463), coding for the superoxide dis-mutase, ptb (ef1663), coding for the phosphotransbutyrylase, fsrB/D (ef1821), coding for the cysteine protease-like process-ing enzyme FsrB and the autoinducprocess-ing propeptide FsrD of the fsr system, a homolog of the accessory gene regulator (agr) of Staphylococcus aureus, and gelE (ef1818), coding for a gelati-nase (Qin et al. 2000, 2001; Ward et al. 2000; Nakayama et al. 2006; Verneuil et al. 2006) (see below; Supplemental Table SB).
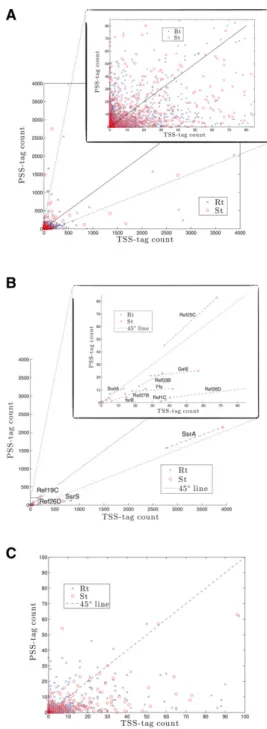
In the ideal case, the procedure should identify unambig-uously TSSs and PSSs. In practice, a fraction of 5′ ends at-tached to a TSS-tag were also ligated to a PSS-tag. Indeed, in vivo, 5′triphosphate RNA ends are enzymatically convert-ed to monophosphate, often as a first step of RNA degrada-tion (Bail and Kiledjian 2009, and references therein). Therefore, a fraction of TSSs are expected to be associated with the PSS-tag. This effect may be further strengthened by spontaneous hydrolysis of 5′triphosphate RNA ends dur-ing the ligation step of the PSS-adaptor and preceddur-ing RNA treatments, generating 5′ ends opened for ligation. On the other hand, the first step of the tagging procedure using the T4 RNA ligase is certainly not complete and acts with differ-ent efficiency on differdiffer-ent RNA molecules (Zhuang et al. 2012; Raabe et al. 2014). Therefore, at the second ligation step, 5′ monophosphate ends (i.e., PSSs) that have escaped the first tag can be ligated to the TSS-adaptor and appear as false TSSs. For each 5′ RNA end mapped in this study, Figure 2A presents the number of each tag counted. The dis-tribution of 5′termini extends continuously between the two axes and hence does not give an immediate way to distinguish TSSs from PSSs. However, the distribution can be sorted by additional arguments, paying the price of discarding infor-mation on a fraction of mapped positions. (1) PSSs (i.e., 5′monophosphate groups) for which the first ligation step was partial and also tagged with the TSS-tag sequence at the second step, should not give more TSS-tag counts than
PSS-tag counts since the enzyme should act with the same ef-ficiency on the same RNA end at each step. Therefore, points (i.e., 5′RNA ends) above the diagonal may be either TSSs or partially ligated PSSs, but 5′RNA termini falling below the diagonal in Figure 2A should be TSSs. Obviously, such a cut-off eliminates true TSSs that would exist in vivo mainly as 5′monophosphate ends. (2) In accordance with the previous
FIGURE 2. Scatter plot showing TSS-tag counts versus PSS-tag counts. (A) At each position of the genome. (B) At genomic locations within 2 bp of previously experimentally mapped transcription start sites. (C ) At genomic locations within 2 bp of 5′RNA edges of transcribed regions (see Materials and Methods; Supplemental Section S3). About 80% of predicted 5′RNA ends fall below the diagonal.
argument, all other TSSs known from the literature fall below the diagonal with one exception (Fig. 2B), the ncRNA Ref25C (RNA in E. faecalis 25C), which we discuss in more detail in Supplemental Section S4. (3) We considered separately 5′ edges of transcribed regions that feature an absence of detect-able expression upstream and should therefore be a signature of a TSS. As expected for those selected RNA ends, and in ac-cordance with the two first arguments, a clear distribution below the diagonal appears (Fig. 2C). (4) A motif search in DNA regions between 0–30 and 20–40 nt upstream of 5′ RNA ends located below the diagonal shows that >80% of them contain at least one canonical sequence featuring a pro-moter region (−10 and/or −35 boxes). In contrast, the same search performed for 5′ RNA ends above the diagonal does not retrieve any sequence reminiscent of a canonical promot-er region (see below). The presence of promotpromot-er motifs in one area delineated by the diagonal is a very strong argument in favor of the location of true TSSs <45° in the plot presented in Figure 2A. Considering these rules and in order to err on the side of caution, in this work we will only consider points (i.e., 5′RNA ends) below 30° as“TSSs,” and >60° as “PSSs”; for points in between, 5′RNA ends cannot be assigned with certainty and will be considered as undetermined. Compared with other single nucleotide resolution RNA-seq methods, tagRNA-seq provides, for the first time, an accurate mapping of TSSs buried in transcribed regions and of RNA cleavage sites at a comprehensive scale in a single view, without requir-ing comparison between transcriptomes (Sharma et al. 2010; Nicolas et al. 2012; Wurtzel et al. 2012) (Fig. 1; the “ppRNome” browser; Supplemental Table SA).
Transcription start sites in E. faecalis
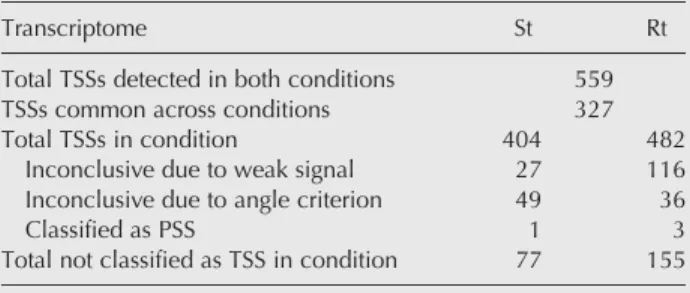
Within the area <30° in Figure 2A, we mapped a total of 559 TSSs on the V583 E. faecalis genome, combining both St and Rt (Supplemental Table SA,SB). A total of 327 TSSs were common to both transcriptomes. Among candidates classi-fied as TSSs in St but not in Rt, 49 were classiclassi-fied as inconclu-sive due to a location between the 30° and 60° lines in Figure 2A, 1 was classified as PSS and 27 were inconclusive due to a weak (TSS-tag + PSS-tag) signal (i.e., <3.2× per million of tagged reads aligned). For the corresponding candidates in the Rt conditions, those numbers are respectively, 36 between the 30° and 60° lines, 3 classified as PSSs and 116 were incon-clusive due to low signal in St (Table 1).
Motif detection and promoter features in the E. faecalis genome
Up to date, <50 TSSs have been experimentally characterized in E. faecalis (Fouquier d’Hérouël et al. 2011, and references therein). In order to better define promoter regions in this species, we took advantage of our 5′ends mapping and per-formed a blind search for common sequences nested in DNA regions preceding RNA extremities using the MEME suite
(Bailey et al. 2009). By doing so, this search also enabled us to challenge our classification of 5′RNA ends based on the tagging method as presented in Figure 2A. We defined four groups of DNA regions: two groups below the diagonal, one from 0° to 30° (called as TSSs), a second from 30° to 45° (called as undetermined, but expected to contain mainly TSSs), and two groups above the diagonal, one from 45° to 60° (called as undetermined but with a few TSSs, e.g., Ref25C) (see Supplemental Section S4), and a second group from 60° to 90° (called as PSSs). DNA sequences used as in-put for MEME and a detailed list of the motifs discovered are presented in Supplemental Table SC. For groups below 30°, the analysis reveals motifs with strong statistical significance (E-values below 10−30) and consensus sequences: Within the region [−30 … 0] and centered around position −9.7 ± 2.6, we found GnTATAAT, the canonical −10 box; in the [−40 … −20] region, the motif TTGACAA was found cen-tered at−31.5 ± 2.3, the canonical −35 box. The −10 box ap-pears with a high frequency (83.5%) and ends 5–9 bp from the 5′ RNA ends mapped. The −35 box was found in 20.6% of input sequences. At least 90% of the sequences where a−35 box is detected also have a canonical −10 box. Boxes defined as −10 and −35 are spaced by a 16–22 bp long sequence. Thus, the most significant motifs discovered correspond to the canonical −10 (TATAAT) and −35 (TTGACA) sequences of promoters recognized by the vege-tative RNA polymerase loaded with the transcription initia-tion factor SigA (RpoD, σA or σ70) in the most studied bacteria E. coli and B. subtilis (Harley and Reynolds 1987; Helmann 1995). The presence and the location of−10 and −35 boxes on DNA regions upstream of 5′RNA ends falling
in the area defined by the angle between 0° and 30° in Figure 2A, reinforces our previous conclusion that these RNA ex-tremities are TSSs. In line with this conclusion, for features with an angle between 0° and 45°,−10 and −35 canonical boxes are still the most frequently found motif but the num-bers fall to 80.8% and 14.7%, respectively, which indicates that the density of true TSSs is indeed higher for signals cor-responding to a low angle in the plot (≤30°). Within the two groups of sequences above 45°, the most significant motif dis-covered is AACGA/TAC/GA/G, found in <10% of sequences.
To our knowledge, this purine-rich motif does not resemble
TABLE 1. Summary of the numbers of TSSs reported in R and S conditions
Transcriptome St Rt
Total TSSs detected in both conditions 559 TSSs common across conditions 327
Total TSSs in condition 404 482
Inconclusive due to weak signal 27 116 Inconclusive due to angle criterion 49 36
Classified as PSS 1 3
any canonical sequence of bacterial promoter described pre-viously. One might speculate that this sequence represents a frequent RNA motif targeted by an endoribonuclease, but further experiments will be required to confirm this hypoth-esis. Nonetheless, this observation reinforces our conclusion that the majority of TSSs do not locate >45° in Figure 2A.
In addition to SigA, three other sigma factors have been predicted in E. faecalis V583, SigH (Ef0049, the heat-shock factor), SigV (Ef3180, an “extracytoplasmic” factor) and SigN (Ef0782, aσ54-like factor) (Paulsen et al. 2003). ORFs coding for SigH and SigV are not expressed in S and R growth conditions (Supplemental Table SD; the ppRNome browser), hence we did not expect to find TSSs whose promoter regions would carry consensus sequences recognized by either one of these factors. In contrast, the sigN encoding sequence is transcribed and we sought manually for the consensus se-quence of SigN-dependent promoter ahead of TSSs mapped (−24/−12; TTGCCACNNNNNTTGCT) (Buck et al. 2000; Héchard et al. 2001; Iyer and Hancock 2012). Only six corre-sponding locations were found across the whole genome: upstream ORFs coding for components of phosphor-sugar transfer systems (PTS), ef0019, ef1012, ef1017, ef1954, ef3210, and fabF-2 coding for an enzyme involved in fatty acid and biotin metabolism. Out of those six locations, the TSS for ef1012 is detected and a tag signal below our selection threshold is found upstream of ef1017.
Processing sites in E. faecalis
PSS-tags are found∼50% more abundant than the number of total TSS-tags detected (Supplemental Table SA, Section S2). In contrast to TSS-tags that appear with a discrete distri-bution at 5′edges or nested within transcribed regions, PSS-tags, in addition to colocalize with TSS-PSS-tags, also tend to spread out over RNA signals. Although we cannot rule out experimental RNA breaks, such a distribution of PSS-tags is expected as they label any type of 5′ monophosphate RNA ends, including processing sites, degradation products and hydrolyzed 5′ triphosphate ends. To pinpoint major PSSs within the transcriptome, we only considered 5′ends lo-cated within the area delineated by the 60° angle in Figure 2A and above our acceptance threshold in both St and Rt. Ignoring rRNA and tRNA loci we mapped a total of 352 PSSs candidates (Supplemental Table SE).
Up to now, most of bacterial transcriptomic studies have focused on TSSs, RNA levels and the discovery of unannotat-ed genes (e.g., Tolunannotat-edo-Arana et al. 2009; Sharma et al. 2010; Nicolas et al. 2012). In addition to these aspects, tagRNA-seq allows to visualize RNA processing sites and shows that the “processed RNA landscape” is an important part of the total transcriptome that has been less studied up to now. For ex-ample, the well-known ubiquitous sRNA RnpB, the ribo-zyme element of RNase P (Frank and Pace 1998), provides an illustration of the information accessible via tagRNA-seq. We previously mapped the rnpB TSS at location
1,121,939 in the E. faecalis V583 chromosome (Fouquier d’Hérouël et al. 2011), which is not detected by tagRNA-seq, most likely due to the higher amplification of the signal via the RACE-derivative method compared with the SOLiD procedure. The functional RnpB molecule, also termed M1, originates from a series of maturation processes conserved across the three domains of life that we may reasonably spec-ulate to also operate in E. faecalis due to the high degree of structural and functional conservation of RnpB (Li et al. 1998; Mann et al. 2003; Griffiths-Jones et al. 2005, and refer-ences therein). TagRNA-seq data enables us to map locations 1,121,951/-53 with high tag counts corresponding to PSSs (Supplemental Tables SA, SE; the ppRNome browser). The RnpB upstream-most 5′end predicted in the Rfam data-base allocates a position at 1,121,944 in the chromosome (Griffiths-Jones et al. 2005), a location spaced by 4 and 7 nt from the TSS and PSS we have mapped, respectively.
Further experiments will be necessary to shed light on the details of the processed transcriptome and its complex orga-nization. Nevertheless, to our knowledge, this is the first study mapping PSSs at a global scale in bacteria.
Transcription start sites and processing sites in E. coli
Unlike in E. faecalis, transcription start sites in E. coli have been extensively studied and TSSs have been mapped in ge-nome-wide manner in at least three separate contributions: Mendoza-Vargas et al. (2009) reported TSSs for ∼1000 (∼23%) of the ∼4500 ORFs in E. coli MG1655, Conway et al. (2014) mapped with high accuracy about 2100 promot-ers, and Thomason et al. (2015) detected over 14,000 TSSs using dRNA-seq.
In order to challenge the tagRNA-seq method and our analysis, we applied the same procedure for the E. coli tran-scriptome as we applied for E. faecalis with a significance threshold set to five reads. We were thus able to retrieve 397 TSSs in the U00096.3 reference genome (Supplemental Table SB). This lower number compared with E. faecalis can be ex-plained by the smaller number of reads obtained from this se-quencing experiment (see Supplemental Material, Section S2) and the 40% larger genome of E. coli, out of which ∼33% (1.55 Mbp) appear to be transcribed in our experi-ment (coverage higher than 2×). Out of those 397 TSSs, 314 (79%) were found within 2 bp of a TSS reported in at least one of the three contributions described above (113 in Mendoza-Vargas et al. [2009], 218 in Conway et al. [2014], and 285 in Thomason et al. [2015]).
In contrast, relatively few RNA processing sites (PSSs) have been mapped with single nucleotide accuracy in E. coli in standard growth conditions. Supplemental Section S5 and Table S4 provides 16 examples of PSSs reported in the liter-ature and how they appear in our results of E. coli: (i) 11 PSSs are clearly recovered and fall in the area >60°, albeit three car-ry tag counts below the chosen threshold of five reads; (ii) five
PSSs reported elsewhere are found within the area called“undetermined” (Fig. 2). These examples support that the tagRNA-seq method enable us to map PSSs within the bacterial RNA landscape. Nonannotated genes, small RNAs, and particular transcriptional organization
Up to now, transcriptomic studies in E. faecalis have used microarrays de-signed to examine expression of annotat-ed ORFs (Aakra et al. 2005; Solheim et al. 2007; Makhzami et al. 2008; Vebø et al. 2009, 2010; Abrantes et al. 2011; Mehmeti et al. 2011; Vesić and Kristich 2013), or custom-made tiling arrays con-taining a limited number of intergenic regions (IGRs) to search for sRNAs (Shioya et al. 2011). Although informa-tive, these approaches provide partial information on the bacterial transcrip-tome compared with RNA-seq methods (Sittka et al. 2008; Rasmussen et al. 2009; Toledo-Arana et al. 2009; Sharma et al. 2010; Chao et al. 2012; Nicolas et al. 2012). We took advantage of our 5′RNA end mapping for a detailed
tran-scriptional analysis, looking for previously nonannotated genes in the genome of E. faecalis V583. Among other tran-scripts, sRNAs were primarily identified as stand-alone sig-nals, whose length is up to 500 nt, located in “empty” regions (i.e., nonannotated regions), or transcripts antisense to annotated ORFs. In addition to the sRNAs previously identified (Fouquier d’Hérouël et al. 2011; Shioya et al. 2011), we unveiled a total of 85 novel sRNAs (Fig. 3; Sup-plemental Table SF). Continuing on our previous nomencla-ture (Fouquier d’Hérouël et al. 2011), these new sRNAs were named from “Ref47” to “Ref120” when present in the chromosome, and for sRNAs encoded by plasmids pTEF1 and pTEF2, from“RefA1” to “RefA9” and “RefB1” to“RefB12,” respectively. Among the 45 sRNAs previously reported in Fouquier d’Hérouël et al. (2011), 18 are con-firmed by tagRNA-seq. For the remaining 27, we detect some low and inconclusive signals for about half of them, and do not detect anything for the rest. Four among the 11 unnamed sRNAs reported in Shioya et al. (2011) were con-firmed and named Ref57 (IGR ef0408-9 in the chromosome), Ref78 (IGR ef1368-9), RefA9 (IGR efa0080-1 in pTEF1), and RefB12 (IGR efb0062-63 in pTEF2) (Supplemental Table SF). Additionally, comparison with Table S3 in the supplemen-tary material of Shioya et al. (2011) confirmed six sRNAs in our list (Ref81, Ref115, RefA3, Ref93A,B, RefA8, and RefB11), as well as the antisense to RefA7 observed in our
ex-periment but unnamed due to absence of tags, and the long 3′ UTR of ef3249.
sRNAs have important regulatory functions. Generally, regulatory RNAs not embedded in a transcriptional antisense organization (stand-alone) modulate the activity of proteins or affect translation (up or down) by pairing to mRNAs; a class of sRNAs also named“trans-acting sRNAs” (Repoila and Darfeuille 2009; Waters and Storz 2009). Although not functionally characterized so far, many sRNAs found in E. faecalis are likely trans-acting regulators, e.g., Ref50, Ref52, Ref72, Ref78, Ref79, Ref95, Ref102, RefA1, RefA4 (Supplemental Table SF). Some sRNAs have been shown to carry a dual function since they can exert their regulatory role via different mechanisms or can also encode peptides (Wadler and Vanderpool 2007; Loh et al. 2009; Livny and Waldor 2010; Jørgensen et al. 2012; Sayed et al. 2012). Some of the sRNAs predicted here may also encode for pep-tides as previously predicted for other sRNAs in E. faecalis (Fouquier d’Hérouël et al. 2011). Another category of sRNAs are antisense RNAs (asRNAs), transcribed from the complementary DNA strand of genes, and thereby forming transcriptional antisense organizations. As regulatory con-sequence, the expression of an asRNA can potentially im-pact the transcription initiation efficacy of the opposite gene (promoter interference), may provoke premature arrest of transcription elongation, and/or possibly modulate the
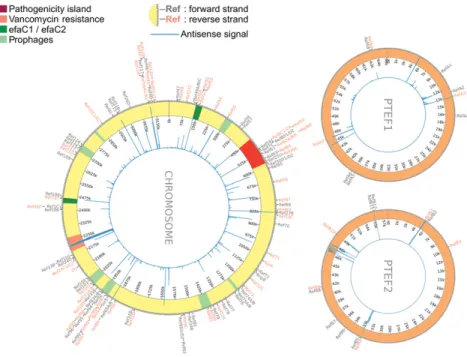
FIGURE 3. Global view of sRNAs and antisense organizations currently known in E. feacalis V583 (the chromosome and plasmids pTEF1 and pTEF2). All the sRNAs from Supplemental Table SF are represented, in“gray” on the forward strand and “orange” on the reverse strand. The inner plot visually describes with vertical blue lines the location and importance of antisense organizations detected (see the ppRNome browser for details). On the chromosome, the patho-genicity island (red) and other mobile genetic elements are annotated on the chromosome, i.e., efaC1/C2 (dark green), vancomycin resistance region (orange), and the six prophages (bright green) (Lepage et al. 2006; Matos et al. 2013).
translation and the stability of the cognate RNA (Georg and Hess 2011; Brantl 2012; Sesto et al. 2013). Many of the novel Ref sRNAs appear to form antisense transcriptional organiza-tions, e.g., Ref89 and RefB4 are antisense to sRNAs Ref90, RefB5, respectively; Ref94, Ref114, and Ref115 are antisense to transcripts bearing ORFs ef2025, ef3087, and ef3088, re-spectively (Supplemental Table SF).
Also, long 3′UTRs have been reported in several bacterial species and in a few cases their involvement in RNA-mediat-ed regulation has been demonstratRNA-mediat-ed (Sittka et al. 2008; Chao et al. 2012). In Supplemental Section S6, we present several cases found in the genome of V583.
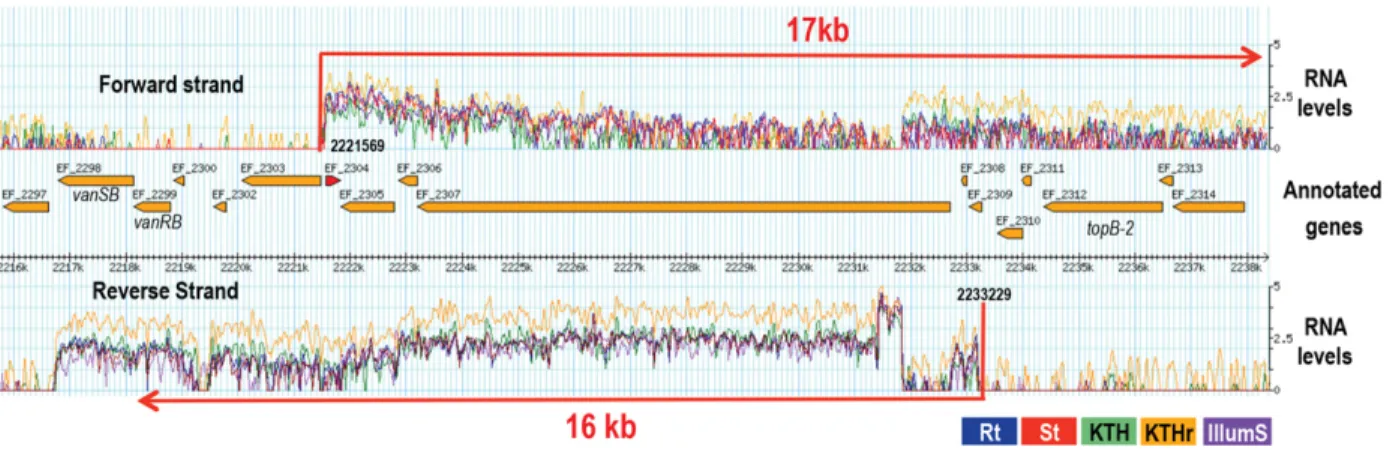
In addition, antisense transcriptional organization also results from overlapping mRNAs and may involve coding se-quences as well as 5′or 3′UTRs (e.g., Rasmussen et al. 2009; Toledo-Arana et al. 2009; Sharma et al. 2010; Nicolas et al. 2012; Wurtzel et al. 2012). For instance, the 5′UTR ef0282 ( fabI) overlaps the 5′ UTR ef0283 ( fab-F1); ORFs ef0479, and ef0480 are embedded in a long opposite transcript orig-inating 3000 bp upstream; and the transcript that contains ef0522–ef0523 in an operon is antisense to a transcript carry-ing ef0524. Similar examples are observed on plasmids pTEF1 and pTEF2 (the ppRNome browser and Supplemen-tal Table SF). However, one of the most striking antisense or-ganizations was found in the region spanning from ef2298 to ef2324 (Fig. 4). It is clearly visible in all of the E. faecalis tran-scriptomes, regardless of the growth condition, tagging, or sequencing protocol. It encompasses∼22 kbp on the chro-mosome and involves two transcribed regions of 16 and 17 kbp long that overlap by 11.5 kbp. In the positive direction, the transcribed RNA originates 265 bp upstream of ef2304, the unique predicted ORF contained within this 16 kbp long RNA, and would code for a putative transcriptional regulator (Paulsen et al. 2003). In addition, this RNA is
antisense to ef2312 and ef2314 that code for the DNA topo-isomerase III (TopB-2) and a putative bacteriocin, respective-ly. On the negative strand, the second RNA originates 225 bp upstream of ef2308, and carries ef2298 and ef2299 (Fig. 4). These later ORFs encode the two-component regulatory sys-tem VanRB/SB, a vital element for E. faecalis V583 to resist to vancomycin, a major clinical antibiotic against Gram-pos-itive infections (Huycke et al. 1998; Arias and Murray 2012). Experimental validation will be required, but it is tempting to speculate that this antisense regulation may control vancomy-cin resistance in E. faecalis V583.
Differential gene expression in static and respiratory growth
We performed a standard differential expression analysis be-tween the R and S conditions for E. faecalis (see Materials and Methods; Supplemental Table SD). Annotation and gene on-tology information show that most of the differentially ex-pressed genes in Supplemental Table SD are involved in the central metabolism associated with the consumption of sug-ars and amino acids as sources of carbon and nitrogen, main-ly centered on gmain-lycomain-lysis, pyruvate metabolism, and citrate cycle (TCA) (http://www.genome.jp/kegg/pathway.html and Fig. 5). For instance, operons celAB, ef1017–ef1020, and ef2959-ef2961 have a higher expression in S compared with R conditions, and are predicted to code for phosphor-sugar transfer systems (PTSs) of cellobiose and ribose uptake, and degrading enzymes, respectively. These transporter sys-tems allow the entry and the phosphorylation of specific sug-ars that are catabolized via the glycolytic pathway. In R, compared with S conditions, an increased expression is de-tected for operons ef0097–ef0100 that code for the subunits
FIGURE 4. Long antisense organization in the chromosome of E. faecalis V583. The transcriptional antisense organization encompasses 22 kbp. Note that only a single ORF, ef2304, is predicted in the transcript originated from the positive DNA strand at coordinate 2221569. ORFs, ef2312 and ef2314 encode the DNA topoisomerase III and a putative bacteriocin; they are not transcribed in the growth conditions used but are“covered” by the an-tisense RNA (17 kb). vanRB and vanSB, encoding the two-component regulatory system of the vancomycin resistance locus, are contained at the end of the transcript originated at coordinate 2233229 from the minus DNA strand. The two antisense RNAs overlap by 11.6 kb. Coordinates mapped for TSSs of each corresponding transcript are noted at the corresponding location. The color boxes denoted by“Rt,” “St,” “KTH,” “KTHr,” and “IlluminaSt” applied to RNA levels of corresponding transcriptomes. RNA levels shown are normalized.
of the serine-dehydratase (Sdh) that converts serine into py-ruvate (or the reverse reaction), the end product of glycolysis, and ef1657–ef1663 coding for enzymes that feed or make part of the TCA cycle and glycolysis, and participate to amino acid metabolism (valine and serine) from pyruvate. We also ob-served an increased expression in R for operon glpFOK (ef1927–ef1929) coding for enzymes enabling glycerol catab-olism via glycolysis in aerobic conditions (Bizzini et al. 2010). The results of this standard differential expression analysis are in line with previous reports on metabolic and transcrip-tomic studies performed on E. faecalis and closely related spe-cies such as Lactococcus lactis (Garrigues et al. 1997; Redon et al. 2005; Pedersen et al. 2008). Under S conditions (anaer-obic growth) and, in the growth medium used in this study, E. faecalis adopts fermentation, a physiological state charac-terized by a high rate of sugar consumption in comparison to respiration, and employs the glycolysis pathway for glucose catabolism, ending up in pyruvate formation (Garrigues et al. 1997; Pfeiffer et al. 2001). In E. faecalis, the respiratory chain is complete but not functional as genes encoding en-zymes required for heme synthesis are absent. However, if oxygen and heme are supplied as in R growth conditions, E. faecalis switches from homolactic fermentation to respira-tion and under respirarespira-tion, pyruvate conversion is not ex-clusively catalyzed by Ldh-1, but also by Als (Ef1213), Pdh (Ef1353/Ef1354), Pfl (Ef1612/Ef1613), and AdhE (Ef0900), ending in the production of various products (acetate,
etha-nol, formate), and regenerate NAD+ from NADH (Winstedt et al. 2000; Yama-moto et al. 2006; Pedersen et al. 2008).
In summary, with the caveats of high expected false negative rate when com-paring few samples, it can be checked that all the reported variations in Figure 5 and Supplemental Table SD are con-sistent with previously reported features of E. faecalis biology with and without respiration.
CONCLUSION
In this work, we have introduced a new method to distinguish primary and pro-cessed RNA ends and achieved the first RNA-seq transcriptome of E. faecalis. The discovery of numerous sRNAs and antisense organizations in E. faecalis tran-scriptomes highlights, as in many other species, the importance of RNA-depen-dent regulatory processes. The associa-tion of the RNA-seq method with the differential labeling of 5′RNA ends, en-abled us to provide the two “faces” of a bacterial RNA landscape. We mapped 559 TSSs and predicted promoter motifs at the genome-wide scale in a species where <50 were previ-ously known, and 352 major PSSs, providing a first snapshot of a bacterial processed RNA landscape. As TSS- and PSS-tags hallmark transcription initiation and processing, the next step in the exploitation of our technology allowing identifica-tion of 5′ ends of primary and processed transcripts will be to perform quantitative studies in order to pinpoint the contribution of RNA synthesis and RNA stability in gene ex-pression reprogramming accompanying physiological adap-tation. This study constitutes a significant advance in the understanding of the organization and the expression of the genetic information of the human pathogen E. faecalis, and a key improvement of the functional analysis of bacterial transcriptomes.
MATERIALS AND METHODS
Bacterial growth and RNA preparation
E. faecalis V583 (VE14002 in our laboratory collection) was grown in brain–heart infusion (BHI) medium at 37°C in static (S) or respi-ratory (R) conditions. Briefly, one fresh bacterial colony was used to inoculate 5 mL BHI and grown at 37°C in S conditions for 20 h. A 1/500 dilution was then made in prewarmed BHI medium to obtain the test culture. In S growth conditions, the culture was not shaken. In R growth, hemin (SIGMA) was added to the test culture at 10μM final concentration and culture was shaken at 200 rpm. Bacterial
FIGURE 5. Metabolic pathways deduced from functions assigned to RNAs differentially ex-pressed in S and R growth conditions. Transcriptomes St and Rt both show significant expression of genes involved in central metabolism. Differential expression analysis indicates that groups of enzymes specifically involved in sugar uptake systems (PTSs) and nucleotide bases metabolism pathways are induced in static growth conditions (S). Similarly, in respiration (R), the formation of acetyl-CoA from pyruvate, formate, and ethanol is enhanced, as well as the citrate cycle (TCA) and amino acids metabolism. Genes with up-regulated expression in each condition are rep-resented by thick arrows in the corresponding plot. The names on the arrows correspond to gene names as given in Supplemental Table SD, which also contains their assigned functions from the KEGG database.
growth was followed by measuring the optical density at 600 nm (OD600). Total RNAs were prepared from bacterial cultures grown to an optical density (OD600) ranging between 0.7 and 0.85, as pre-viously described (Fouquier d’Hérouël et al. 2011). In the course of this work, we discovered that our laboratory strain did not contain the plasmid pTEF3 (Paulsen et al. 2003); although we used the ap-pellation of“V583” throughout the text, data presented are those obtained for our strain VE14002.
E. coli strain MG1655 was grown in LB medium at 37°C under ag-itation (200 rpm) until an OD600 of 0.5. Bacteria were pelleted and total RNA prepared as previously described (Fouquier d’Hérouël et al. 2011).
RNA tagging and sequencing
In bacteria, transcriptional start sites (TSSs, or“+1”) are character-ized by the presence of a 5′triphosphate group. In contrast, 5′RNA ends created by endonucleolytic cleavages (PSSs) are 5′ monophos-phate. We exploit this chemical difference by labeling differentially mono- and triphosphate 5′RNA ends with two short RNA oligonu-cleotides, the“tags” (Fouquier d’Hérouël et al. 2011).
5′RNA ends were differentially labeled with two short and differ-ent RNA oligonucleotides (tags) (Fouquier d’Hérouël et al. 2011; Supplemental Section S1). Briefly, primary transcripts contain 5′ ends with a triphosphate group which is brought by the first nucle-otide triphosphate used by the RNA polymerase to initiate RNA syn-thesis at TSSs. In contrast, RNA processing events generate, at cleavage sites (PSSs), 5′ends with monophosphate groups. RNAs with PSS and hydrolyzed 5′triphosphate RNA ends were tagged by a first ligation step with the PSS-RNA adaptor (PSS-tag). Subsequently, RNAs were treated with the tobacco alkaline phos-phatase (TAP) to transform triphosphate groups into monophos-phate groups and were then tagged by a second ligation step with a TSS-RNA adaptor (TSS-tag). TSS- and PSS-tag sequences were adapted to RNA-seq in such a way that they cannot be mistaken with any regions of the V583 reference genome (Supplemental Section S1).
In order to account for variations in total number of reads and to be able to compare experiments, RNA levels are reported normal-ized to the total number of reads mapped, as commonly done in RNA-seq (Robinson and Oshlack 2010). Additionally, the ligation procedure introduces a new variability in the experiment that is cor-rected for by normalizing the number of tagged reads mapped at a given position to the total number of tagged reads mapped for the entire V583 genome (Supplemental Table SA).
Two RNA libraries were obtained from total RNAs prepared from E. faecalis grown in S and R conditions. They were tagged with PSS-and TSS-tags according to our 5′RNA end discriminative method, treated according to SOLiD manufacturer’s protocols for sequenc-ing (Applied Biosystems, Life Technologies Corporation), and se-quenced on a SOLiD 5500 platform (MetaGenoPolis, INRA). The corresponding transcriptomes were named“St” and “Rt,” respec-tively (Supplemental Table SA).
Additionally, as control, three other RNA libraries prepared from two independent growths in S conditions were sequenced. In one ex-periment, the bacterial culture was grown at Karolinska Institute, Sweden, as previously described in Fouquier d’Hérouël et al. (2011), and sequenced on a SOLiD v3 platform (Viiki) without ap-plying our tagging procedure. Two libraries, denoted as “KTHr”
and“KTH” respectively, were prepared from this experiment. For one of them, ribosomal RNAs (rRNAs) were removed using Ambion MICROBExpress Bacterial mRNA Enrichment Kit; in the other, rRNAs were retained. In the second S growth culture, bacteria were grown at INRA and RNAs where prepared as described here. Sequencing was done on a Hi-seq platform (IMAGiF, CNRS) follow-ing the Illumina Trueseq protocol, resultfollow-ing in the“IlluminaSt” tran-scriptome. Due to technicalities in the ligation, the tagging in this sample was ineffective leading to a sample that here has been used only as standard RNA-seq.
A single RNA sample was prepared from E. coli total RNA, tagged using the same RNA adaptors (TSS- and PSS-tags) and sequenced on the SOLiD Wildfire platform (MetaGenomPolis, INRA). The re-sulting transcriptome was named“Coli.”
Alignment and coverage
Reads were aligned to the E. faecalis v583 and E. coli K12 substrain MG1655 reference genomes (respectively, GenBank Accession IDs [GenBank:AE016830.1] (chromosome), [GenBank:AE016831.1] (pTEF2), and [GenBank:AE016833.1] (pTEF1); [GenBank: U00096.3]) using Bowtie 1.0.0 (Langmead et al. 2009) with default options, but allowing for multiple matches (-a best command line option). The coverage is calculated by counting the number of reads mapped at each position on the genome for each strand. In case of multiple matches, the number of matches correspondingly divides the contribution to the read count. In cases mentioned explicitly in the text where repeated regions are excluded from the analysis; those multiply matched reads are ignored in the count. Similarly, when rRNAs and tRNAs are excluded, we impose a zero coverage over the corresponding regions. In order to reduce the effect of fragment bias (reads that are not uniformly distributed within the transcripts they represent) (Roberts et al. 2011), we define a quantity called “cov-erage density” similar to the coverage, except that reads mapped so that they start at the same genomic position are counted only once. The resulting signal is thus less sensitive to the specific amplifi-cation of the different fragments at the cost of losing dynamic range. The coverage density signal has the useful and exploitable feature that edges of an expressed region are always staircase-shaped. We use the coverage density signal as a means to predict tran-script edges from our RNA-seq data. Supplemental Section S2 com-piles the raw sequencing output for the various transcriptomes performed.
Gene expression level
We calculated gene expression levels of annotated genes of the E. fae-calis genome and performed differential expression analysis between R and S growth condition using Cuffdiff from the Cufflinks suite v2.1.1 (Trapnell et al. 2010). Cuffdiff was run on the Bowtie output files with the command line option -u–library-type fr-secondstrand using the genome of E. faecalis V583 and its annotation. Regions corresponding to rRNA in the annotation were masked using the -M option.
Comparing Rt and St, we obtained a list of 31 ORFs that displayed significant variation of RNA levels between the two tagged RNA-seq (Supplemental Table SD). We assessed the false positive rate by comparing to the results including in the analysis data from the“IlluminaSt” transcriptome in the S growth condition. This
improves the prediction quality of some called genes (decreases P-values for 16 ORFs), adds 16 more called genes to the list (moves their P-values below threshold), and still calls 23 ORFs in the list. For the nine ORFs that are removed from the list, the P-value, on the other hand, increases above threshold. Results from the analysis are available in Supplemental Table SD and discussed in the Results and Discussion section.
Predictions of transcription start sites
Starting from the coverage density signal, we developed an iterative algorithm to detect transcribed regions, filtering out signals of low quality originating from sequencing errors or misalignments. The algorithm is inspired by the edge thinning operation in image pro-cessing (Davies and Plummer 1981). All regions where the signal is greater than a given but arbitrary confidence threshold are marked as“strong” signal. The signal in the immediate vicinity of this strong signal is recursively annexed to the strong signal region. All signals not marked as strong are discarded (Supplemental Section S3). The algorithm discriminates low signals within transcribed regions and eliminates those likely caused by noise. The orientation of the aligned reads and the edges of signals enable us to assign TSSs.
Detection of transcription starts and processing sites using 5′tags
The addition of tags allows to readily map 5′ends of RNA molecules and to discriminate primary transcripts (ligated to TSS-tags) from processed transcripts (ligated to PSS-tags). Prior to alignment, reads are sorted according to tag sequences or their absence and, when present, tag sequences are removed from reads, leaving only se-quences from bacterial RNAs. Both operations are performed simul-taneously with Flexbar—Flexible Barcode and adapter removal for sequencing platforms—v2.4 (Dodt et al. 2012) allowing for up to two mismatches in the 13 nt of the tags (command line parameters –barcode-trim-end LEFT –barcode-threshold 1.6 –barcode-unas-signed–barcode-min-overlap 9 –min-read-length 35). After align-ment, reads with tags are classified into TSS or PSS candidates according to the rules described in the Results and Discussion sec-tion“The calling of TSS and PSS from tagRNA-seq.”
For transcriptomes obtained from the Illumina Hi-seq and SOLiD Wildfire, standard removal of 3′sequencing adapters is per-formed using Flexbar in an additional preprocessing step. This step is not needed for SOLiD v3 and 5500 where the insert size is typically much longer than read length (Innocenti and Aurell 2013).
As a 5′RNA end can be tagged by both TSS-tag and PSS-tag se-quences (see below), we considered a 5′end to be present in the se-quenced RNA population when at a given location, the sum of TSS-tags and PSS-TSS-tags have counts of at least 3.2× per million of tagged reads aligned in E. faecalis transcriptomes. Such a threshold corre-sponds to a total of 5 tags (TSS- + PSS-tags) detected at the con-cerned position for the St transcriptome and seven tags for Rt. For the “Coli” transcriptome, this threshold was kept at 5 tags, or 4.06× per million of tagged reads aligned.
On one hand, a careful examination of the transcriptomes reveals many instances of one or two isolated reads in isolated positions. It is reasonable to assume that many of these are noise and thus setting the limit above this level was chosen to eliminate them. On the other
hand, as described in detail in Supplemental Section S7, there seems to be no natural threshold in the data and a lower threshold simply leads to more candidates. The threshold values given above are sim-ply one reasonable choice.
It is well known that transcription initiation at a transcription start site is not always initiated with single nucleotide accuracy (Schlüter et al. 2010; Sharma et al. 2010; Cortes et al. 2013; Morton et al. 2014). To take this into account, when locations dis-tant by 4 bp or less from each other have mapped reads with TSS-tags and at least one of them is classified as a TSS candidate, the mul-tiple tag signals are grouped in a single region that encompasses all those locations (Supplemental Tables SA, SB). The location with the highest tag signal is taken to be the most probable location of the TSS, and the total tag signal for the region is taken as the sum of the signals at all locations in the group. Although the length of such a“TSS region” can reach 6 bp or more in rare cases, many TSSs are detected with single nucleotide resolution (Supplemental Figs S8a,b in Section S8). Furthermore, an analysis of the average signal around retrieved TSSs shows that most of the signal concen-trates within a region of ±2 bp around the most probable location (Supplemental Fig. S8c in Section S8).
As much less is known about the accuracy of the different ribonu-cleases, PSSs are reported in the text as point location on the genome and neighboring nucleotides with tag signal classified as PSSs are counted as different PSS sites.
Motif detection
We performed unbiased de novo motif search using MEME v4.9.1 (Bailey et al. 2009) upstream of genomic positions with TSSs and PSSs. The search was limited to the 10 most significant motifs with a width between 4 and 8 bp (command line arguments -nmo-tifs 10 -minw 4 -maxw 8). Short DNA sequences were extracted from the reference genome between [20–40 bp] and [0–30 bp] up-stream of locations of interest and classified according to their ratios of PSS to TSS tag signals (as described in the Results and Discussion section“The calling of TSS and PSS from tagRNA-seq”). Those se-quences were used as input to MEME without any filtering. When the feature was a TSS region as defined in the previous section, the most probable location was used as reference position for the se-quence. The list of input sequences and results of the analysis are available Supplemental Table SC.
Visualization of results
All coverage information and tag signals resulting from our experi-ments and analysis can be visualized in a user-friendly and interactive manner online at the address http://ebio.u-psud.fr/eBIO_BDD.php (select the entry called“The ppRNome browser”). The visualization uses the Genome Browser (GBrowse) (Supplemental Section S9; Stein et al. 2002). The data presented online are also available in a nu-merical format in Supplemental Tables SA and SD for the Rt and St transcriptomes.
DATA DEPOSITION
The data are available in NCBI SRA repository, reference number PRJNA272574.
SUPPLEMENTAL MATERIAL
Supplemental material is available for this article.
ACKNOWLEDGMENTS
We thank the eBIO computing platform of Orsay, particularly C. Drevet and C. Toffano-Nioche, for hosting the “ppRNome browser.” We thank Ingemar Ernberg at Karolinska Institutet for his hospitality by providing laboratory space and equipment for A. F.d’H., and V. Cantoni for the suggestion to use edge detection al-gorithms. We are grateful to the “CPE team,” A. Gruss, and D. Halpern for comments and discussions, and to S. Gaubert, L. Girbal, T. Esquerré, and M. Cocaign-Bousquet for communicat-ing results prior to publication. Many thanks to our colleagues, P. Palcy, V. Bourgogne, N. Eberlin, and P. Régent for invaluable ad-ministrative, IT, and equipment-related support. This research was supported by the Swedish Science Council through grant 621-2012-2982 (E.A.), and by the Academy of Finland through Finland Distinguished Professor Programme and the Center of Excellence COIN (E.A.), and grant ANR-12-BSV6-0008 (ReadRNA) from the Agence Nationale pour la Recherche.
Authors’ contributions: N.I., A.F.d’H., F.R., and E.A. designed the research. N.I., M.G., A.F.d’H., and E.A. developed and performed the computational analysis and visualization on website. A.F.d’H., C.L., R.A.B., F.W., P.S., and F.R. performed bacterial manipulation, RNA extractions, and tagRNA libraries preparation. S.P.K. per-formed the SOLiD tagRNA sequencing. N.I., A.F.d’H., P.S., P.B., F.R., and E.A. analyzed data and wrote the paper. All authors read and approved the final manuscript.
Received October 7, 2014; accepted December 22, 2014.
REFERENCES
Aakra Å, Vebø H, Snipen L, Hirt H, Aastveit A, Kapur V, Dunny G, Murray BE, Nes IF. 2005. Transcriptional response of Enterococcus faecalis v583 to erythromycin. Antimicrob Agents Chemother 49: 2246–2259.
Aakra Å, Vebø H, Indahl U, Snipen L, Gjerstad Ø, Lunde M, Nes IF. 2010. The response of Enterococcus faecalis v583 to chloramphenicol treatment. Int J Microbiol 2010: 483048.
Abrantes MC, Lopes Mde F, Kok J. 2011. Impact of manganese, copper and zinc ions on the transcriptome of the nosocomial pathogen Enterococcus faecalis v583. PLoS One 6: e26519.
Adlerberth I, Wold AE. 2009. Establishment of the gut microbiota in Western infants. Acta Paediatr 98: 229–238.
Albrecht M, Sharma CM, Reinhardt R, Vogel J, Rudel T. 2010. Deep se-quencing-based discovery of the Chlamydia trachomatis transcrip-tome. Nucleic Acids Res 38: 868–877.
Arias CA, Murray BE. 2012. The rise of the Enterococcus: beyond vanco-mycin resistance. Nat Rev Microbiol 10: 266–278.
Bail S, Kiledjian M. 2009. Tri- to be mono- for bacterial mRNA decay. Structure 17: 317–319.
Bailey TL, Boden M, Buske FA, Frith M, Grant CE, Clementi L, Ren J, Li WW, Noble WS. 2009. MEME Suite: tools for motif discovery and searching. Nucleic Acids Res 37: W202–W208.
Bizzini A, Zhao C, Budin-Verneuil A, Sauvageot N, Giard JC, Auffray Y, Hartke A. 2010. Glycerol is metabolized in a complex and strain-dependent manner in Enterococcus faecalis. J Bacteriol 192: 779–785.
Bohn C, Rigoulay C, Chabelskaya S, Sharma CM, Marchais A, Skorski P, Borezée-Durant E, Barbet R, Jacquet E, Jacq A, et al.
2010. Experimental discovery of small RNAs in Staphylococcus au-reus reveals a riboregulator of central metabolism. Nucleic Acids Res 38: 6620–6636.
Brantl S. 2012. Acting antisense: plasmid- and chromosome-encoded sRNAs from Gram-positive bacteria. Future Microbiol 7: 853–871. Buck M, Gallegos MT, Studholme DJ, Guo Y, Gralla JD. 2000. The
bac-terial enhancer-dependentσ54(σN) transcription factor. J Bacteriol 182: 4129–4136.
Campeotto F, Waligora-Dupriet AJ, Doucet-Populaire F, Kalach N, Dupont C, Butel MJ. 2007. Establishment of the intestinal microflo-ra in neonates. Gastroenterol Clin Biol 31: 533–542.
Chao Y, Papenfort K, Reinhardt R, Sharma CM, Vogel J. 2012. An atlas of Hfq-bound transcripts reveals 3′UTRs as a genomic reservoir of regulatory small RNAs. EMBO J 31: 4005–4019.
Conway T, Creecy JP, Maddox SM, Grissom JE, Conkle TL, Shadid TM, Teramoto J, San Miguel P, Shimada T, Ishihama A, et al. 2014. Unprecedented high-resolution view of bacterial operon architec-ture revealed by RNA sequencing. MBio 5: e01442–e01414. Cortes T, Schubert OT, Rose G, Arnvig KB, Comas I, Aebersold R,
Young DB. 2013. Genome-wide mapping of transcriptional start sites defines an extensive leaderless transcriptome in Mycobacterium tuberculosis. Cell Rep 5: 1121–1131.
Davies ER, Plummer APN. 1981. Thinning algorithms: a critique and a new methodology. Pattern Recognit 14: 53–63.
Dodt M, Roehr JT, Ahmed R, Dieterich C. 2012. FLEXBAR—flexible barcode and adapter processing for next-generation sequencing plat-forms. Biology 1: 895–905.
Esquerré T, Laguerre S, Turlan C, Carpousis AJ, Girbal L, Cocaign-Bousquet M. 2013. Dual role of transcription and transcript stability in the regulation of gene expression in Escherichia coli cells cultured on glucose at different growth rates. Nucleic Acids Res 42: 2460–2472. Fouquier d’Hérouël A, Wessner F, Halpern D, Ly-Vu J, Kennedy SP, Serror P, Aurell E, Repoila F. 2011. A simple and efficient method to search for selected primary transcripts: non-coding and antisense RNAs in the human pathogen Enterococcus faecalis. Nucleic Acids Res 39: e46.
Frank DN, Pace NR. 1998. Ribonuclease P: unity and diversity in a tRNA processing ribozyme. Annu Rev Biochem 67: 153–180.
Garrigues C, Loubiere P, Lindley ND, Cocaign-Bousquet M. 1997. Control of the shift from homolactic acid to mixed-acid fermenta-tion in Lactococcus lactis: predominant role of the NADH/NAD+ ra-tio. J Bacteriol 179: 5282–5287.
Georg J, Hess WR. 2011. cis-antisense RNA, another level of gene regu-lation in bacteria. Microbiol Mol Biol Rev 75: 286–300.
Gilmore MS, Ferretti JJ. 2003. Microbiology. The thin line between gut commensal and pathogen. Science 299: 1999–2002.
Griffiths-Jones S, Moxon S, Marshall M, Khanna A, Eddy SR, Bateman A. 2005. Rfam: annotating non-coding RNAs in complete genomes. Nucleic Acids Res 33: D121–D124.
Hambraeus G, von Wachenfeldt C, Hederstedt L. 2003. Genome-wide survey of mRNA half-lives in Bacillus subtilis identifies extremely sta-ble mRNAs. Mol Genet Genomics 269: 706–714.
Harley CB, Reynolds RP. 1987. Analysis of E. coli promoter sequences. Nucleic Acids Res 15: 2343–2361.
Héchard Y, Pelletier C, Cenatiempo Y, Frère J. 2001. Analysis ofσ54 -de-pendent genes in Enterococcus faecalis: A mannose PTS permease (EIIMan) is involved in sensitivity to a bacteriocin, mesentericin Y105. Microbiology 147: 1575–1580.
Helmann JD. 1995. Compilation and analysis of Bacillus subtilisσA
-de-pendent promoter sequences: evidence for extended contact be-tween RNA polymerase and upstream promoter DNA. Nucleic Acids Res 23: 2351–2360.
Huycke MM, Sahm DF, Gilmore MS. 1998. Multiple-drug resistant en-terococci: the nature of the problem and an agenda for the future. Emerg Infect Dis 4: 239–249.
Innocenti N, Aurell E. 2013. Lognormality and oscillations in the cover-age of high-throughput transcriptomic data towards gene ends. J Stat Mech P10013.
Irnov I, Sharma CM, Vogel J, Winkler WC. 2010. Identification of reg-ulatory RNAs in Bacillus subtilis. Nucleic Acids Res 38: 6637–6651. Iyer VS, Hancock LE. 2012. Deletion ofσ54(rpoN) alters the rate of
au-tolysis and biofilm formation in Enterococcus faecalis. J Bacteriol 194: 368–375.
Jørgensen MG, Nielsen JS, Boysen A, Franch T, Møller-Jensen J, Valentin-Hansen P. 2012. Small regulatory RNAs control the mul-ti-cellular adhesive lifestyle of Escherichia coli. Mol Microbiol 84: 36–50.
Kristoffersen SM, Haase C, Weil MR, Passalacqua KD, Niazi F, Hutchison SK, Desany B, Kolstø AB, Tourasse NJ, Read TD, et al. 2012. Global mRNA decay analysis at single nucleotide resolution re-veals segmental and positional degradation patterns in a Gram-pos-itive bacterium. Genome Biol 13: R30.
Langmead B, Trapnell C, Pop M, Salzberg SL. 2009. Ultrafast and mem-ory-efficient alignment of short DNA sequences to the human ge-nome. Genome Biol 10: R25.
Lepage E, Brinster S, Caron C, Ducroix-Crepy C, Rigottier-Gois L, Dunny G, Hennequet-Antier C, Serror P. 2006. Comparative geno-mic hybridization analysis of Enterococcus faecalis: identification of genes absent from food strains. J Bacteriol 188: 6858–6868. Li Z, Pandit S, Deutscher MP. 1998. 3′Exoribonucleolytic trimming is a
common feature of the maturation of small, stable RNAs in Escherichia coli. Proc Natl Acad Sci 95: 2856–2861.
Livny J, Waldor MK. 2010. Mining regulatory 5′UTRs from cDNA deep sequencing datasets. Nucleic Acids Res 38: 1504–1514.
Loh E, Dussurget O, Gripenland J, Vaitkevicius K, Tiensuu T, Mandin P, Repoila F, Buchrieser C, Cossart P, Johansson J. 2009. A trans-acting riboswitch controls expression of the virulence regulator PrfA in Listeria monocytogenes. Cell 139: 770–779.
Makhzami S, Quénée P, Akary E, Bach C, Aigle M, Delacroix-Buchet A, Ogier JC, Serror P. 2008. In situ gene expression in cheese matrices: application to a set of enterococcal genes. J Microbiol Methods 75: 485–490.
Mann H, Ben-Asouli Y, Schein A, Moussa S, Jarrous N. 2003. Eukaryotic RNase P: role of RNA and protein subunits of a primordial catalytic ribonucleoprotein in RNA-based catalysis. Mol Cell 12: 925–935. Matos RC, Lapaque N, Rigottier-Gois L, Debarbieux L, Meylheuc T,
Gonzalez-Zorn B, Repoila F, Lopes Mde F, Serror P. 2013. Enterococcus faecalis prophage dynamics and contributions to path-ogenic traits. PLoS Genet 9: e1003539.
Mehmeti I, Jönsson M, Fergestad EM, Mathiesen G, Nes IF, Holo H. 2011. Transcriptome, proteome, and metabolite analyses of a lactate dehydrogenase-negative mutant of Enterococcus faecalis V583. Appl Environ Microbiol 77: 2406–2413.
Mendoza-Vargas A, Olvera L, Olvera M, Grande R, Vega-Alvarado L, Taboada B, Jimenez-Jacinto V, Salgado H, Juárez K, Contreras-Moreira B, et al. 2009. Genome-wide identification of transcription start sites, promoters and transcription factor binding sites in E. coli. PLoS One 4: e7526.
Mitschke J, Vioque A, Haas F, Hess WR, Muro-Pastor AM. 2011. Dynamics of transcriptional start site selection during nitrogen stress-induced cell differentiation in Anabaena sp. PCC7120. Proc Natl Acad Sci 108: 20130–20135.
Mohanty BK, Kushner SR. 2006. The majority of Escherichia coli mRNAs undergo post-transcriptional modification in exponentially growing cells. Nucleic Acids Res 34: 5695–5704.
Morton T, Petricka J, Corcoran DL, Li S, Winter CM, Carda A, Benfey PN, Ohler U, Megraw M. 2014. Paired-end analysis of tran-scription start sites in Arabidopsis reveals plant-specific promoter signatures. Plant Cell 26: 2746–2760.
Nakayama J, Chen S, Oyama N, Nishiguchi K, Azab EA, Tanaka E, Kariyama R, Sonomoto K. 2006. Revised model for Enterococcus fae-calis fsr quorum-sensing system: The small open reading frame fsrD encodes the gelatinase biosynthesis-activating pheromone propep-tide corresponding to staphylococcal AgrD. J Bacteriol 188: 8321–8326.
Nicolas P, Mäder U, Dervyn E, Rochat T, Leduc A, Pigeonneau N, Bidnenko E, Marchadier E, Hoebeke M, Aymerich S, et al. 2012.
Condition-dependent transcriptome reveals high-level regulatory architecture in Bacillus subtilis. Science 335: 1103–1106.
Opsata M, Nes I, Holo H. 2011. Class IIa bacteriocin resistance in Enterococcus faecalis V583: The mannose PTS operon mediates glob-al transcriptionglob-al responses. BMC Microbiol 10: 224.
Paulsen IT, Banerjei L, Myers GS, Nelson KE, Seshadri R, Read TD, Fouts DE, Eisen JA, Gill SR, Heidelberg JF, et al. 2003. Role of mobile DNA in the evolution of vancomycin-resistant Enterococcus faecalis. Science 299: 2071–2074.
Pedersen MB, Garrigues C, Tuphile K, Brun C, Vido K, Bennedsen M, Møllgaard H, Gaudu P, Gruss A. 2008. Impact of aeration and heme-activated respiration on Lactococcus lactis gene expression: identifica-tion of a heme-responsive operon. J Bacteriol 190: 4903–4911. Pfeiffer T, Schuster S, Bonhoeffer S. 2001. Cooperation and competition
in the evolution of ATP-producing pathways. Science 292: 504–507. Qin X, Singh KV, Weinstock GM, Murray BE. 2000. Effects of enterococ-cus faecalis fsr genes on production of gelatinase and a serine protease and virulence. Infect Immun 68: 2579–2586.
Qin X, Singh KV, Weinstock GM, Murray BE. 2001. Characterization of fsr, a regulator controlling expression of gelatinase and serine prote-ase in Enterococcus faecalis OG1RF. J Bacteriol 183: 3372–3382. Qin J, Li R, Raes J, Arumugam M, Burgdorf KS, Manichanh C,
Nielsen T, Pons N, Levenez F, Yamada T, et al. 2010. A human gut microbial gene catalogue established by metagenomic sequenc-ing. Nature 464: 59–65.
Raabe CA, Tang TH, Brosius J, Rozhdestvensky TS. 2014. Biases in small RNA deep sequencing data. Nucleic Acids Res 42: 1414–1426. Rasmussen S, Nielsen HB, Jarmer H. 2009. The transcriptionally active
regions in the genome of Bacillus subtilis. Mol Microbiol 73: 1043–1057.
Redon E, Loubière P, Cocaign-Bousquet M. 2005. Role of mRNA stabil-ity during genome-wide adaptation of Lactococcus lactis to carbon starvation. J Biol Chem 280: 36380–36385.
Repoila F, Darfeuille F. 2009. Small regulatory non-coding RNAs in bac-teria: physiology and mechanistic aspects. Biol Cell 101: 117–131. Roberts A, Trapnell C, Donaghey J, Rinn JL, Pachter L. 2011. Improving
RNA-Seq expression estimates by correcting for fragment bias. Genome Biol 12: R22.
Robinson MD, Oshlack A. 2010. A scaling normalization method for differential expression analysis of RNA-seq data. Genome Biol 11: R25.
Rochat T, Bouloc P, Repoila F. 2013. Gene expression control by selec-tive RNA processing and stabilization in bacteria. FEMS Microbiol Lett 344: 104–113.
Rustad TR, Minch KJ, Brabant W, Winkler JK, Reiss DJ, Baliga NS, Sherman DR. 2013. Global analysis of mRNA stability in Mycobacterium tuberculosis. Nucleic Acids Res 41: 509–517. Sahm DF, Kissinger J, Gilmore MS, Murray PR, Mulder R, Solliday J,
Clarke B. 1989. In vitro susceptibility studies of vancomycin-resis-tant Enterococcus faecalis. Antimicrob Agents Chemother 33: 1588–1591.
Sayed N, Jousselin A, Felden B. 2012. A cis-antisense RNA acts in trans in Staphylococcus aureus to control translation of a human cytolytic peptide. Nat Struct Mol Biol 19: 105–112.
Schlüter JP, Reinkensmeier J, Daschkey S, Evguenieva-Hackenberg E, Janssen S, Jänicke S, Becker JD, Giegerich R, Becker A. 2010. A ge-nome-wide survey of sRNAs in the symbiotic nitrogen-fixing al-pha-proteobacterium Sinorhizobium meliloti. BMC Genomics 11: 245.
Selinger DW, Saxena RM, Cheung KJ, Church GM, Rosenow C. 2003. Global RNA half-life analysis in Escherichia coli reveals positional patterns of transcript degradation. Genome Res 13: 216–223. Sesto N, Wurtzel O, Archambaud C, Sorek R, Cossart P. 2013. The
excludon: a new concept in bacterial antisense RNA-mediated gene regulation. Nat Rev Microbiol 11: 75–82.
Sharma CM, Hoffmann S, Darfeuille F, Reignier J, Findeiss S, Sittka A, Chabas S, Reiche K, Hackermuller J, Reinhardt R, et al. 2010. The primary transcriptome of the major human pathogen Helicobacter pylori. Nature 464: 250–255.
Shioya K, Michaux C, Kuenne C, Hain T, Verneuil N, Budin-Verneuil A, Hartsch T, Hartke A, Giard JC. 2011. Genome-wide identification of small RNAs in the opportunistic pathogen Enterococcus faecalis V583. PLoS One 6: e23948.
Sittka A, Lucchini S, Papenfort K, Sharma CM, Rolle K, Binnewies TT, Hinton JC, Vogel J. 2008. Deep sequencing analysis of small noncod-ing RNA and mRNA targets of the global post-transcriptional regu-lator, Hfq. PLoS Genet 4: e1000163.
Solheim M, Aakra A, Vebo H, Snipen L, Nes IF. 2007. Transcriptional responses of Enterococcus faecalis V583 to bovine bile and sodium dodecyl sulfate. Appl Environ Microbiol 73: 5767–5774.
Steglich C, Lindell D, Futschik M, Rector T, Steen R, Chisholm SW. 2010. Short RNA half-lives in the slow-growing marine cyanobacte-rium Prochlorococcus. Genome Biol 11: R54.
Stein LD, Mungall C, Shu S, Caudy M, Mangone M, Day A, Nickerson E, Stajich JE, Harris TW, Arva A, Lewis S. 2002. The generic genome browser: a building block for a model organism system database. Genome Res 12: 1599–1610.
Thomason MK, Bischler T, Eisenbart SK, Förstner KU, Zhang A, Herbig A, Nieselt K, Sharma CM, Storz G. 2015. Global transcrip-tional start site mapping using differential RNA sequencing reveals novel antisense RNAs in Escherichia coli. J Bacteriol 197: 18–28. Toledo-Arana A, Solano C. 2010. Deciphering the physiological
blue-print of a bacterial cell: revelations of unanticipated complexity in transcriptome and proteome. Bioessays 32: 461–467.
Toledo-Arana A, Dussurget O, Nikitas G, Sesto N, Guet-Revillet H, Balestrino D, Loh E, Gripenland J, Tiensuu T, Vaitkevicius K, et al. 2009. The Listeria transcriptional landscape from saprophytism to virulence. Nature 459: 950–956.
Trapnell C, Williams BA, Pertea G, Mortazavi A, Kwan G, van Baren MJ, Salzberg SL, Wold BJ, Pachter L. 2010. Transcript assembly and quan-tification by RNA-Seq reveals unannotated transcripts and isoform switching during cell differentiation. Nat Biotechnol 28: 511–515. Vebø HC, Snipen L, Nes IF, Brede DA. 2009. The transcriptome of the
nosocomial pathogen Enterococcus faecalis V583 reveals adaptive re-sponses to growth in blood. PLoS One 4: e7660.
Vebø HC, Solheim M, Snipen L, Nes IF, Brede DA. 2010. Comparative genomic analysis of pathogenic and probiotic Enterococcus faecalis isolates, and their transcriptional responses to growth in human urine. PLoS One 5: e12489.
Verneuil N, Mazé A, Sanguinetti M, Laplace JM, Benachour A, Auffray Y, Giard JC, Hartke A. 2006. Implication of (Mn)superoxide dismutase of Enterococcus faecalis in oxidative stress responses and survival inside macrophages. Microbiology 152: 2579–2589. Vesić D, Kristich CJ. 2013. A Rex family transcriptional repressor
influ-ences H2O2accumulation by Enterococcus faecalis. J Bacteriol 195:
1815–1824.
Wadler CS, Vanderpool CK. 2007. A dual function for a bacterial small RNA: SgrS performs base pairing-dependent regulation and en-codes a functional polypeptide. Proc Natl Acad Sci 104: 20454– 20459.
Ward DE, van Der Weijden CC, van Der Merwe MJ, Westerhoff HV, Claiborne A, Snoep JL. 2000. Branched-chainα-keto acid catabolism via the gene products of the bkd operon in Enterococcus faecalis: a new, secreted metabolite serving as a temporary redox sink. J Bacteriol 182: 3239–3246.
Waters LS, Storz G. 2009. Regulatory RNAs in bacteria. Cell 136: 615–628.
Winstedt L, Frankenberg L, Hederstedt L, von Wachenfeldt C. 2000. Enterococcus faecalis V583 contains a cytochrome bd-type respiratory oxidase. J Bacteriol 182: 3863–3866.
Wurtzel O, Sesto N, Mellin JR, Karunker I, Edelheit S, Bécavin C, Archambaud C, Cossart P, Sorek R. 2012. Comparative transcrip-tomics of pathogenic and non-pathogenic Listeria species. Mol Syst Biol 8: 583.
Yamamoto Y, Pargade V, Lamberet G, Gaudu P, Thomas F, Texereau J, Gruss A, Trieu-Cuot P, Poyart C. 2006. Roles of environmental heme, and menaquinone, in Streptococcus agalactiae. Mol Microbiol 62: 772–785.
Zhuang F, Fuchs RT, Sun Z, Zheng Y, Robb GB. 2012. Structural bias in T4 RNA ligase-mediated 3′-adapter ligation. Nucleic Acids Res 40: e54.
10.1261/rna.048470.114
Access the most recent version at doi:
2015 21: 1018-1030 originally published online March 3, 2015
RNA
Nicolas Innocenti, Monica Golumbeanu, Aymeric Fouquier d'Hérouël, et al.
Enterococcus faecalis
sequencing: a comprehensive view in
RNA ends in bacteria by tagged
′
Whole-genome mapping of 5
Material Supplemental http://rnajournal.cshlp.org/content/suppl/2015/02/03/rna.048470.114.DC1 References http://rnajournal.cshlp.org/content/21/5/1018.full.html#ref-list-1 This article cites 90 articles, 30 of which can be accessed free at:License Commons Creative . http://creativecommons.org/licenses/by-nc/4.0/ 4.0 International), as described at
months, it is available under a Creative Commons License (Attribution-NonCommercial ). After 12
http://rnajournal.cshlp.org/site/misc/terms.xhtml
full-issue publication date (see
This article is distributed exclusively by the RNA Society for the first 12 months after the
Service Email Alerting
click here. top right corner of the article or
Receive free email alerts when new articles cite this article - sign up in the box at the
http://rnajournal.cshlp.org/subscriptions
go to:
RNA
To subscribe to