Computational Models of Cardiovascular Response
to Orthostatic Stress
by
Thomas Heldt
Master of Science, Physics Yale University, 1997 Master of Philosophy, Physics
Yale University, 1998
Submitted to the
Harvard - MIT Division of Health Sciences and Technology in partial fulfillment of the requirements for the degree of
Doctor of Philosophy in Medical Physics
at the
MASSACHUSETTS INSTITUTE OF TECHNOLOGY
MASSACHUSETTS INSTITUTE OF TECHNOLOGY LIBRARIES ARCHIVES *. .-r e .... .- V MASSACHUSETTS INSImT E OF TECHNOLOGY LNOV O4 200 LIBRARIES September 2004
© Thomas Heldt, MMIV. All rights reserved.
The author hereby grants to MIT permission to reproduce and distribute publicly paper
and electronic copies of this thesis document in whole or in part.
-fIn
n*
Harvard - MIT Division of Health Sciences and Technology
September 3, 2004
£r
I
71-..K
.y
,---
Roger G. Mark Distinguished Professor of Health Sciences and Technology Professor of Electrical Engineering Thesis Supervisor Certified h,
Accepted 1by ., , ,L
Mr,
Gra
-r \ -'"T ~Martha L. Gray
Edward Hood Taplin Professor of Medical and Electrical Engineering Co-Director, Harvard - MIT Division of Health Sciences and Technology
2
Computational Models of Cardiovascular Response to
Orthostatic Stress
by
Thomas Heldt
Submitted to the
Harvard - MIT Division of Health Sciences and Technology on September 3, 2004, in partial fulfillment of the
requirements for the degree of Doctor of Philosophy in Medical Physics
Abstract
The cardiovascular response to changes in posture has been the focus of numerous investigations in the past. Yet despite considerable, targeted experimental effort, the mechanisms underlying orthostatic intolerance (OI) following spaceflight remain elusive. The number of hypotheses still under consideration and the lack of a sin-gle unifying theory of the pathophysiology of spaceflight-induced OI testify to the difficulty of the problem.
In this investigation, we developed and validated a comprehensives lumped-para-meter model of the cardiovascular system and its short-term homeostatic control mechanisms with the particular aim of simulating the short-term, transient hemody-namic response to gravitational stress. Our effort to combine model building with model analysis led us to conduct extensive sensitivity analyses and investigate inverse modeling methods to estimate physiological parameters from transient hemodynamic data. Based on current hypotheses, we simulated the system-level hemodynamic ef-fects of changes in parameters that have been implicated in the orthostatic intolerance phenomenon.
Our simulations indicate that changes in total blood volume have the biggest detri-mental impact on blood pressure homeostasis in the head-up posture. If the baseline volume status is borderline hypovolemic, changes in other parameters can
signifi-cantly impact the cardiovascular system's ability to maintain mean arterial pressure
constant. In particular, any deleterious changes in the venous tone feedback impairs blood pressure homeostasis significantly. This result has important implications as it suggests that al-adrenergic agonists might help alleviate the orthostatic syndrome seen post-spaceflight.
Thesis Supervisor: Roger G. Mark
Title: Distinguished Professor of Health Sciences and Technology Professor of Electrical Engineering
Acknowledgments
As I close this chapter of my life, I want to pause and acknowledge appreciatively the help and support that sustained me over the years and therefore made this work possible.
First and foremost, I would like to thank my thesis advisor, Professor Roger G. Mark, for his friendship and for seven years of support and thoughtful guidance. Your dedication to your students, Roger, your honesty, and your integrity are truly inspiring. The scientific and personal examples you set will continue to guide me as I now embark on my own scientific career. Your ability to assemble an outstanding group of people, whose extraordinary abilities and intellects are only matched by their remarkable personal qualities, has provided me with a great home for the past several years. I count myself fortunate to have been given the opportunity to work in such a
stimulating environment.
I am grateful to Professor Roger D. Kamm for his advice over the years and for serving as the chair of my thesis committee. Roger gave me a home in the fluids lab when I first started graduate school and remained involved in my research ever since. I enjoy your wit, Roger, and your keen scientific insight. I admire your ability to doze off during presentations yet to ask the most insightful questions at the end. I also enjoy our early-morning or late-afternoon runs around the Charles river, and I admire your ability to step up the pace (both literally and figuratively) just when I thought that I finally caught up.
I am grateful to Professors Cecil (Pete) H. Coggins, Steve G. Massaquoi, and George C. Verghese for their support and their service on my thesis committee. I met Pete when I took his class on renal pathophysiology at Harvard Medical School. I stand in awe at his clarity of thought and his enviable physiological insight. I first met Steve in 1999 when I attended his thesis defense. I appreciate his unwavering enthusiasm for my work and the conversations we had in the hallways with topics ranging from the absolute trivial to the deep philosophical. George introduced me to the topic of subset selection. He provided a much-needed mathematical foundation when my approach to parameter estimation was quite heuristic. He has also revised my manuscript with seemingly infinite care. Thank you, George, and I am looking forward to starting my post-doctoral training under your guidance.
I thank Professor Richard J. Cohen, MIT, Janice V. Meck, NASA Johnson Space Center, and Karin Toska, University of Oslo, for making their experimental data available to us and for providing feedback on our work along the way.
This work got jump-started when Professor Eun Bo Shim from Kwangwon Na-tional University, Republic of Korea, joined Roger Kamm's laboratory for a sabbatical year in 1998. I appreciate your friendship, Eun Bo, and fondly remember your won-derful hospitality during my visit to South Korea.
I owe much gratitude to my officemates in the Laboratory of Computational Phys-iology. It has been a wonderful experience to share an office with such dependable and thoroughly able people. I thank Wei Zong, my officemate of six years, for the many ways in which he contributed to my work and my life. He never tired of answering my seemingly endless programming questions, and he never hesitated to first assist and then lead when my car needed repair. I was fortunate to have moved into an office next to George Moody's. George's computer skills are legendary and irreplaceable. He is a beacon of calm and tranquility, and when the pressure mounted, to have George at my side, was to me the greatest joy. Mohammed Saeed is single-handedly responsible for the most memorable moments in the lab. Hardly have I met someone more convinced of his own work and more willing to defend it. His quick wit and his ability to view the big picture helped to keep things in proper perspective, for which I owe him much gratitude. Ramakrishna Mukkamala's tenure in our laboratory had many lasting effects, not the least of which is free food during our lab meetings. Rama influenced the way I think about physiological systems. Appreciatively, I continue to seek his advice on technical and non-technical matters alike. Matthew Oefinger came to our laboratory two years ago. We could have not asked for a better match, both in terms of skills and personality, to join our office. I want to thank Kenneth Pierce for administrative support over the years and, in particular, for his support in rendering and manipulating images (some of which are contained in this document). Finally, I would like to give a single round of applause to the more recent members of our laboratory.
I want to thank Raymond Chan for his boundless support and enthusiasm. Ray's cheerful disposition is contagious; it never ceased to lighten up even the darkest mo-ments of my graduate school career.
Graduate school would have been a lot harder had it not been for the support and help from exceptional friends. I would like to thank Volker Bromm, Jeff Cooper, John Gould, Chris Hartemink, Vitaly Napadow, Patrick Purdon, Bruce Roscherr, Sham Sokka, Thanh-Nga Tran, Neil Weisenfeld, and Sanith Wijesinghe for their
sup-port and their camaraderie.
In Nina Menezes, I met my alter ego when I came to MIT seven years ago. Nina has been a wonderful friend and a strong influence on my life ever since. The sharp-ness of her wit is only matched by the warmth of her character. Your friendship, Nina, has been the most rewarding aspect of my tenure at MIT.
At this point, I come to those for whom acknowledgment is most overdue. I would like to express my deep gratitude and love for my sisters, Silvia and Carolin, my mother, Karin, and my father, Ulrich, whose love and support have carried me over the years.
I want to dedicate this thesis to my parents for having instilled in me a desire to learn. I fully attribute my achievements to their support and to the self-confidence their up-bringing has fostered.
I gratefully acknowledge financial support for my graduate studies from the
Studien-stiftung des deutschen Volkes, the Gottlieb Daimler- und Karl Benz-Stiftung, the Lee and
Harris Thompson fellowship fund in Health Sciences and Technology, the Hugh Hampton
Young Fellowship from the Massachusetts Institute of Technology, and last - but certainly not least - my parents. This work was made possible through the National Aeronau-tics and Space Administration Cooperative Agreement NCC 9-58 with the National Space
Contents
1 Introduction
1.1 Motivation
...
...
1.2 Specific Aims.
1.3 Thesis Organization ...
I Cardiovascular Model of Orthostatic Stress
2 Hemodynamic Model 2.1 Systemic Circulation ... 2.1.1 Architecture ... 2.1.2 Parameter Assignments. 2.2 Cardiac Model ... 2.2.1 Architecture ... 2.2.2 Parameter Assignments. 2.2.3 Limitations ... 2.3 Pulmonary Circulation ...
2.4 Orthostatic Stress Simulations . 2.4.1 Tilt Table Simulation .. 2.4.2 Stand Tests.
2.4.3 Lower Body Negative Pre 2.5 Model Implementation ... 25
. ... ... .. .... ... .. ..25
. . . .. . . . .25... ...28
... .... ... .. .. .. .. . .. 36. .. ... ... .. ... ... .. ..37
... .... .. .... . ... . ..38
. . . 41. ... .... ... ... .. .. . ..43
... .... ... .... .. ... ..47
... . .. 47... .. .... ... .. ... . ..53
ssure. ... 54. ... ... ... ... ... .. . ..55
3 Cardiovascular Control System
3.1 Arterial Baroreflex.
3.1.1 Architecture of the Model ... 3.1.2 Parameter Assignments ... 3.2 Cardiopulmonary Reflex. 3.3 Cardiac Pacemaker ... 4 Model Validation 4.1 Baseline Simulation ... 4.2 Population Simulations ...
4.3 Gravitational Stress Simulations .. .. . . .
4.4 Lower Body Negative Pressure ...
17 17 21 21
23
57 57 59 61 65 67 69 69 73 76 80 . . . . . . . . . . . .4.5 Modeling Exercise ... 82
4.6 Summary Remarks ... 86
II Sensitivity Analyses and Parameter Estimation
87
5 Sensitivity Analysis 89 5.1 Local Sensitivity Analysis ... 905.2 Results and Discussion ... 92
5.3 Summary and Conclusions ... 9... 99
6 Parameter Estimation 103 6.1 Non-linear Least Squares and Subset Selection . ... 104
6.1.1 Non-linear Least Squares Estimation . . . .... 104
6.1.2 Subset Selection ... 106
6.1.3 Numerical Implementation . . . 108
6.1.4 Formulation of the Estimation Problem ... 108
6.2 Results ... 109
6.3 Summary and Conclusions ... 113
III Clinical Study and Model-based Data Analysis
117
7 Clinical Study 119 7.1 Methods ... . 120 7.2 Results ... 122 7.2.1 Steady-state Results. . . . .... 122 7.2.2 Transient Responses ... 122 7.3 Pilot Study ... 126 7.4 Discussion ... 1278 Post-spaceflight Orthostatic Intolerance 129 8.1 Historical Perspective ... 130
8.2 Mechanistic Studies ... 133
8.3 Testing Hypotheses ... 138
8.4 Model-based Data Analysis . . . ... 144
8.5 Summary and Conclusions ... 146
9 Conclusions and Further Research 147 9.1 Summary and Contributions ... 147
9.2 Suggestions for Further Research ... . 150
A Parameters of the Cardiovascular Model 153
List of Figures
2-1 Single-compartment circuit representation . ... 26
2-2 Circuit representation of the hemodynamic system. . ... 27
2-3 Aortic pressure-volume relation ... 32
2-4 Aortic volume per unit length of vessel ... 32
2-5 Pressure-volume relation of the legs ... 33
2-6 Pressure-volume relation of a common iliac vein . ... 33
2-7 Circuit model of atrial and ventricular compartments . ... 37
2-8 Normalized left ventricular time-varying elastance . ... 38
2-9 Simulated left ventricular pressure-volume loops . ... 39
2-10 Left ventricular end-diastolic pressure-volume relation . ... 39
2-11 Left atrial and left ventricular time-varying elastances . ... 42
2-12 Right atrial and right ventricular time-varying elastances ... 42
2-13 Circuit model of the pulmonary vasculature. ... 44
2-14 Schematic of a Starling resistor set-up. ... 45
2-15 Schematic lateral view of the lung. ... 45
2-16 Tilt angle profile during a rapid tilt ... 48
2-17 Percent change in plasma volume during 85° HUT. . ... 50
2-18 Absolute change in plasma volume on return to supine posture. .... 50
2-19 RC model of the interstitial fluid compartment. . ... 51
2-20 Simplified hydrostatic pressure profile. ... 51
2-21 Simulated changes in plasma volume; dependence on tilt angle... 52
2-22 Simulated changes in plasma volume; dependence on tilt angle and tilt time ... 52
2-23 Pleural and esophageal pressure traces during change in posture. .... 53
2-24 Profiles of extra-luminal pressures during simulated stand test ... 53
2-25 Numerical volume error time series . ... 56
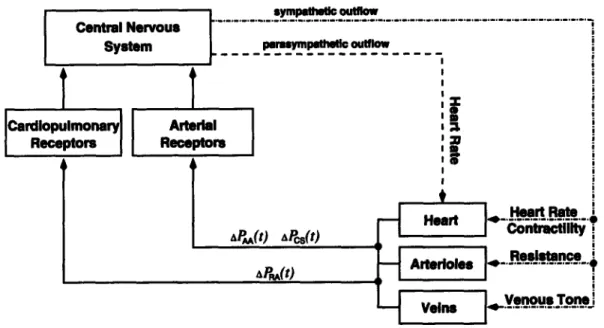
3-1 Diagrammatic representation of the cardiovascular control model. . 58 3-2 Arterial baroreflex model: functional representation of afferent and central nervous pathways. ... ... 59
3-3 Arterial baroreflex model: functional representation of central nervous and efferent pathways. ... 60
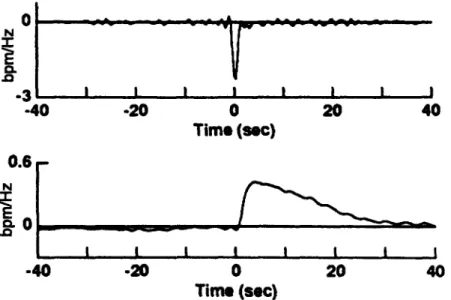
3-4 Autonomic impulse response functions ... 61
3-5 Intracellular recording of cardiac pacemaker activity. ... 67
4-1 Simulated pressure waveforms ... 72
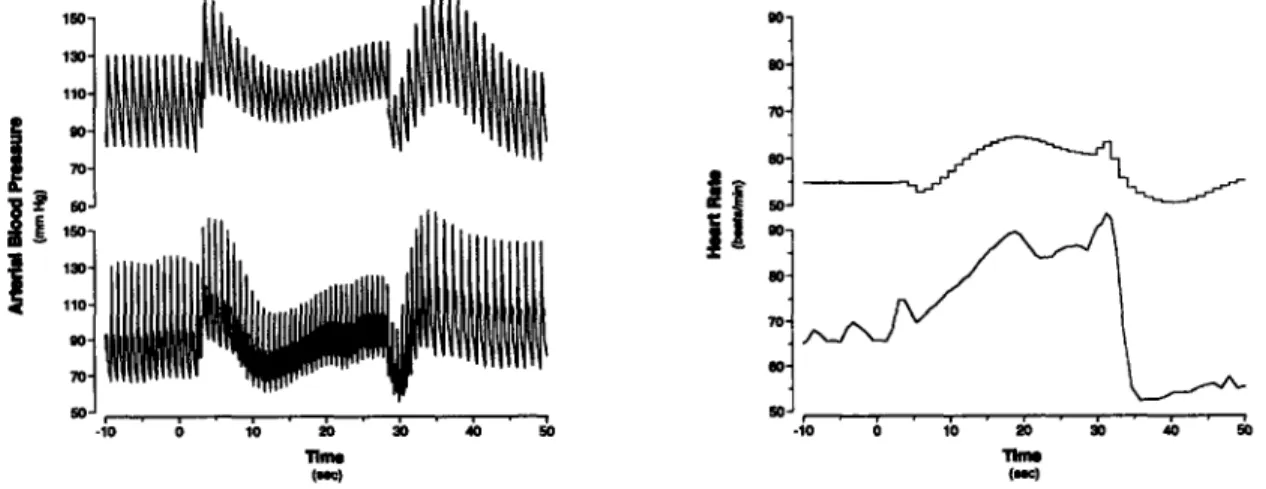
4-2 Cardiovascular response to Valsalva maneuver ... 72
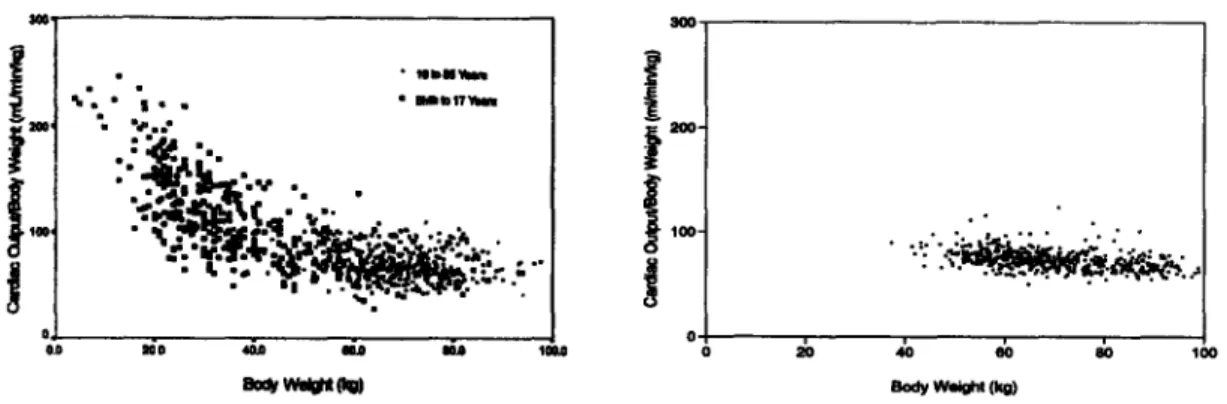
4-3 Normalized cardiac output as a function of body weight. ... 75
4-4 Effect of heart rate on stroke volume ... 76
4-5 Effect of heart rate on cardiac output. ... 76
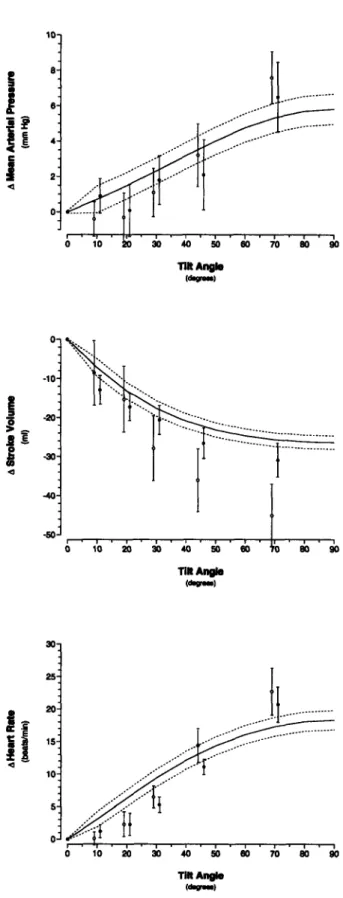
4-6 Changes in steady-state hemodynamic variables in response to head-up tilt ... 77
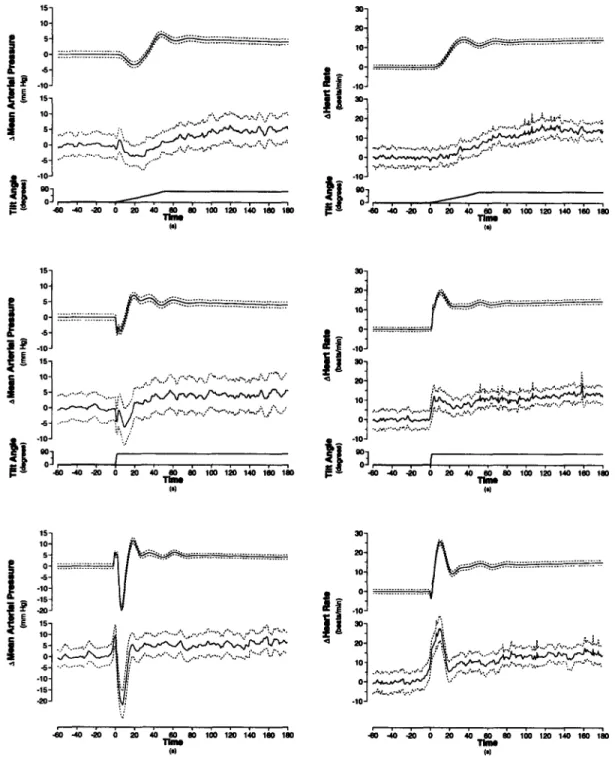
4-7 Transient changes in mean arterial pressure and heart rate during changes in posture ... 79
4-8 Steady-state hemodynamic response to lower body negative pressure. 81 4-9 Cardiovascular response to sudden-onset exercise. Comparison of sim-ulations to experimental data ... 85
5-1 First-order relative parametric sensitivities of the uncontrolled hemo-dynamic model. . . . ... 93
5-2 Second-order relative parametric sensitivities of the uncontrolled hemo-dynamic model. . . . ... 94
5-3 First-order relative parametric sensitivities of the controlled model. 95 5-4 Second-order relative parametric sensitivities of the controlled model. 96 5-5 First-order relative parametric sensitivities at the conclusion of
head-up
tilt
... .... .. ... ... . 98
5-6 Second-order relative parametric sensitivities at the conclusion of grav-itational stress. . . . ... 99
5-7 First-order relative parametric sensitivities during gravitational stress. 100 6-1 Eigenvalue spectrum of the Hessian matrix. ... 110
6-2 Gaps Ai/Ai+l of the eigenvalue spectrum ... 110
6-3 Estimation results for reduced-order, well-conditioned problem. Ill-conditioned parameters kept at their "true" values. ... 112
6-4 Estimation results of reduced-order, ill-conditioned problem. Ill-con-ditioned parameters kept at their "true" values. ... 113
6-5 Estimation results of reduced-order, well-conditioned problem. Ill-con-ditioned parameters perturbed randomly. ... 114
6-6 Estimation results of reduced-order, ill-conditioned problem. Ill-con-ditioned parameters not kept at their "true" values ... 115
7-1 Derivation of instantaneous heart rate signal from ECG. ... 121
7-2 Derivation of systolic, mean, and diastolic arterial pressure time series from arterial pressure waveform ... 121
7-3 Transient hemodynamic responses to changes in posture. ... 123
7-4 Changes in mean arterial pressure and heart rate during changes in posture ... 124
7-5 Comparison of transient mean arterial pressure responses ... 126
7-6 Comparison of transient heart rate responses. ... 126 7-7 Comparison of transient mean arterial pressure responses. Pilot study. 127
7-8 Comparison of transient heart rate responses. Pilot study. ... 8-1 Dependence of changes in mean arterial pressure and heart rate on
volume status. . . . ... 139
8-2 Mean arterial pressure and heart rate changes in response to head-up tilt under varying parametric conditions. Euvolemic case ... 141 8-3 Mean arterial pressure and heart rate changes in response to head-up
tilt under varying parametric conditions. Hypovolemic case. ... 142 8-4 Dependence of mean arterial pressure and heart rate changes on
a-sympathetically mediated reflex mechanisms ... 143 8-5 Dependence of supine stroke volume on volume status. ... 143 8-6 Dependence of supine stroke volume under varying parametric
condi-tions. Hypovolemic case ... 144 8-7 Hemodynamic response to standing pre- and post-spaceflight. .... 145 8-8 Simulated hemodynamic response to stand tests pre- and post-flight. 145 B-1 Correlation of body height and body weight ... 160 B-2 Correlation of total blood volume and body weight . ... 160
List of Tables
2.1 Anthropometric and cardiovascular variables ... 29
2.2 Anatomical lengths of arterial vascular segments. ... 30
2.3 Anatomical lengths of venous vascular segments ... 31
2.4 Systemic microvascular resistance values ... 35
2.5 Parameter assignments for systemic arterial compartments ... 35
2.6 Parameter assignments for systemic venous compartments ... 36
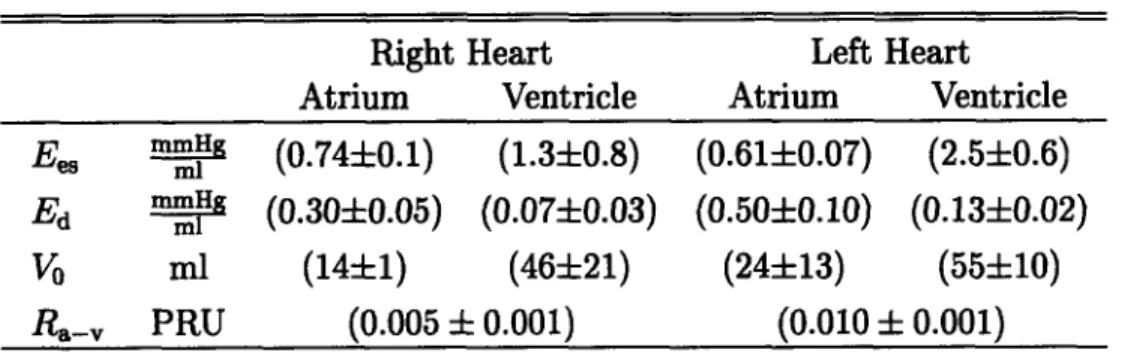
2.7 Parameters of the cardiac model. ... 40
2.8 Cardiac Timing Parameters ... 41
2.9 Nominal parameters for the pulmonary circulation. ... 47
3.1 Parameterization of the reflex impulse response functions ... 63
3.2 Arterial baroreflex static gain values. ... 64
3.3 Cardiopulmonary static gain values ... 66
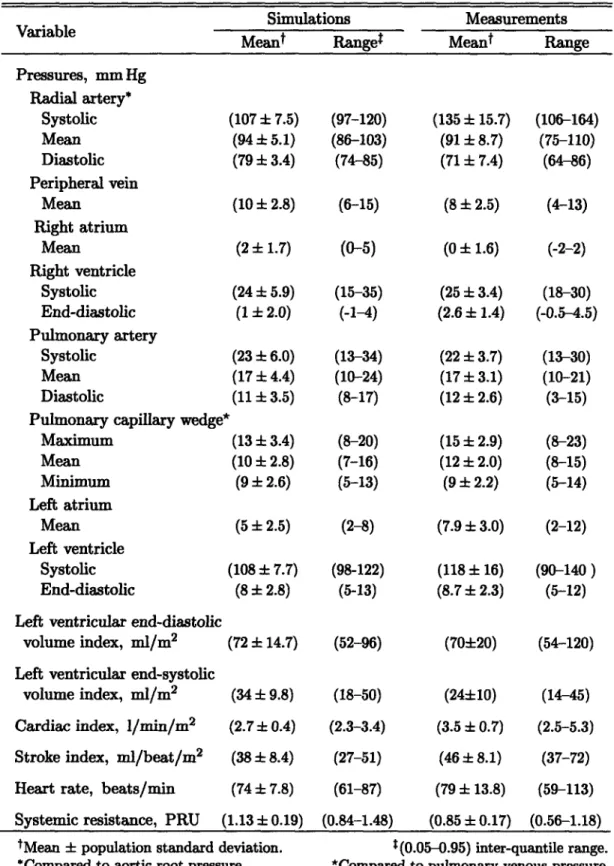
4.1 Steady-state hemodynamic variables of normal recumbent adults; com-parison to simulations ... 70
4.2 Anthropometric profile of simulated population. ... 73
4.3 Comparison of population simulations to steady-state hemodynamic variables of recumbent adults ... 74
4.4 Parameter assignments for exercise simulations. ... 84
6.1 Mean relative errors of estimated parameters with respect to their true values. . . . ... 111
7.1 Subject information. ... 120
7.2 Comparison of steady-state values of hemodynamic variables before and after changes in posture ... 125
8.1 Hypothesized mechanisms of post-spaceflight orthostatic intolerance. . 134 A.1 Parameters of the cardiovascular model. ... 153
Chapter 1
Introduction
1.1 Motivation
Like morphological features or behavioral patterns, organ systems in higher organ-isms have adapted over time in response to local ecological challenges and global environmental influences. The spectacular heterogeneity in size, shape, and way of life among different species is testimony to their adaptive capabilities and their need to function optimally in particular environmental niches.
One relentless and enduring influence common to the development of all life as we know it has been earth's gravitational force. Its direct impact is probably most striking on the cardiovascular system as gravitational pressure heads influence dra-matically the distribution of blood volume and blood flow within the cardiovascular
system. Without proper adaptation, the mere raising of the head above the level of the
heart could potentially lead to a serious and quite possibly life-threatening reduction in cerebral blood flow and oxygenation. This holds true in particular for long-necked animals such as the giraffe or, in the distant past, members of the sauropod family of dinosaurs, whose head towered 8-12 m above heart level in the neck-erect posture.
Not surprisingly, terrestrial-dwelling animals have all developed special physiolog-ical mechanisms to counteract the strong influence gravity imposes upon the cardio-vascular system. These mechanisms include functional anatomical features, such as venous valves and tight connective tissue surrounding the veins of the dependent limbs to prevent retrograde blood flow and excessive venous pooling, respectively. They also include an array of potent cardiovascular reflex mechanisms that dynamically and adaptively regulate key cardiovascular variables, such as heart rate and periph-eral resistance, to maintain blood pressure constant near the base of the head. The integrity and combined action of these mechanisms allow the giraffe to raise its head quickly after drinking from a pool of water, for example, or humans to change posture quickly and continuously, normally without even noticing the profound changes that the cardiovascular system is undergoing. It is only when some of these mechanisms fail to function properly that we become painfully aware of the important function they normally serve.
failure of these mechanisms often leads to clinically overt symptoms of orthostatic hypotension, namely an excessive drop in arterial pressure upon assumption of the upright posture. On observing the clinical symptoms of orthostatic hypotension, one is frequently left wondering as to the mechanisms underlying the observed symptoms. In such cases, clinicians usually perform a limited number of typically non-invasive diagnostic studies to elucidate the underlying mechanisms and to devise treatment
strategies.
The physiological interpretation of limited experimental data can benefit sub-stantially from the concomitant use of a reasonably complete mathematical model. Mathematical models reflect our current level of understanding of the functional in-teractions that determine the overall behavior of the system under consideration. They allow us to probe the system, often in much greater detail than is possible in experimental studies, and can therefore help design and test physiological hypotheses and help establish the cause of a particular observation.
The focus of this work is to establish a computational model of the cardiovascular system that represents the normal human response to gravitational stress, and to use this model in the analysis of experimental observations derived from a particular group of individuals who suffer from transient maladaptation following transition to the upright posture. The group we focus on comprises astronauts upon return to the normal gravitational environment.
Representing the cardiovascular system Like other physiological systems, the
cardiovascular system is remarkable for its intricate, distributed anatomical structure, its spatially distributed physical characteristics, and its temporal range of dynamic behavior. To design a computational model that represents the entire range of car-diovascular behavior is neither technically feasible nor scientifically desirable, as the architecture of any model is indissolubly linked to the particular research questions to be addressed. For these models to be meaningful, they require a choice of the
temporal and spatial representation of the system under study that is appropriate for
the research question, with refined rendering of some aspects and aggregation or even neglect of others.
Models of both the hemodynamic and control elements of the cardiovascular sys-tem have been available for decades and have been progressively improved. Further-more, even fairly elaborate models are well within the power of inexpensive mod-ern computer hardware and software. The models vary in complexity and purpose, some focusing on arterial hemodynamics [1-5], others on cardiovascular control
[6-10]. Some models are based on lumped-parameter representations of the arterial and venous networks [11-14], while others model one or more of the vascular beds using the fluid dynamic equations that govern flow through a distributed, compliant net-work [2, 3]. Finally, very elaborate models of the circulation and the various short-and long-term control mechanisms have been devised [15].
In the context of cardiovascular adaptation to orthostatic stress, numerous compu-tational models have been developed over the past forty years [1, 3, 4, 6, 7, 10, 16-28]. Their foci range from simulating the physiological response to experiments such as
head-up tilt or lower body negative pressure [4, 6, 7, 14, 16-22, 24, 27], to explaining observations seen during spaceflight [3, 18, 26-28]. The spatial and temporal resolu-tions with which the cardiovascular system has been represented are correspondingly broad. Several studies have been concerned with changes in steady-state values of certain cardiovascular variables [3, 4, 25, 28], others have investigated the system's
dynamic behavior over seconds [17, 19, 20], minutes [6, 7, 16], hours [18, 26, 27],
days [18, 23, 26], weeks [18], or even months [24]. The spatial resolutions range from simple two- to four-compartment representations of the hemodynamic system [6, 17, 21, 22, 28] to quasi-distributed or fully-distributed models of the arterial or
venous system [3, 4, 19, 25].
In choosing the time and length scales of our model, we are guided by the clinical practice of diagnosing orthostatic hypotension, which is usually based on average val-ues of hemodynamic variables, such as arterial pressure or heart rate, a few minutes after the onset of gravitational stress [29]. In the research setting, continuous record-ings of heart rate and blood pressures during changes in posture might be made for slightly longer periods of time [30]. Since the purpose of the model developed in sub-sequent chapters is to represent such responses, we aim at simulating the short-term
(< 5 minutes), transient, beat-to-beat cardiovascular response to orthostatic stress.
As such, we are not interested in the detailed intra-cycle variations of pressure, flow,
and volume waveforms but in the faithful, beat-by-beat representation of average
pressures, average flows, and average volumes. A lumped-parameter modeling of the hemodynamic system therefore seems superior to modeling the distributed nature of the arterial and venous circulations, as lumped models reduce the computational cost significantly and produce average variables at similar degrees of fidelity.
Much like previously reported models [10, 31], our model will be based on a closed loop lumped-parameter hemodynamic system with regional blood flow to major circulatory beds. The pumping action of the cardiac chambers will be implemented by time-varying elastances1. We will represent the cardiovascular reflex mechanisms
for the short-term blood pressure homeostasis, namely the arterial and the
cardio-pulmonary baroreflex control loops, while neglecting other control mechanisms that act at longer time scales [36].
In contrast to previously reported models, we will represent not only the steady-state response of the cardiovascular system to orthostatic stress. We will also validate
its transient response to changes in posture, and perform sensitivity studies to identify which parameters contribute significantly to a particular model response.
Further-more, we will use the model to estimate parameters from synthetic and experimental
data, and will employ the model to test the relative importance of several parameters
in the genesis of post-spaceflight orthostatic intolerance. Such a wide spectrum of model applications calls for particular care in model development.
1 One could argue that such a time-varying elastance model with its focus on intra-cycle dynamic behavior is unnecessarily detailed and computationally burdensome for the purpose of our inves-tigation. Some nascent work in our group is aimed at developing dynamic cycle-averaged models [32-35]. However, this work is in too early a stage to be included in this document.
Orthostatic intolerance in astronauts As mentioned above, the cardiovascular
system is superb at adapting to short-term stresses. Other stresses could be men-tioned, such as changes in metabolic requirements during exercise and acute disease states, for instance hemorrhage or myocardial infarction. The cardiovascular system is also effective at compensating for long-term stresses such as environmental changes (high altitude or bed-rest) or chronic disease (aortic stenosis, anemia). However, compensation and adaptation under one set of boundary conditions may result in de-compensation and failure to perform when the environmental conditions are suddenly changed.
Human space flight, for example, has demonstrated that the microgravity environ-ment is managed surprisingly well by the cardiovascular system. There is an initial transient period during which astronauts are uncomfortably aware of cephalad shifts of intravascular volume, but within a couple of days these symptoms resolve and astro-nauts are able to perform well in microgravity, with essentially normal hemodynamics
and neurohumoral status.
Extended exposure to microgravity causes adaptive changes in the cardiovascu-lar system that presumably optimize its function in space, but seriously impair its
function upon return to the normal gravitational environment. Indeed, the disability
produced by a microgravity-adapted cardiovascular system re-entering a gravitational field may be severe enough to seriously impair the ability of astronauts to complete their mission. As summarized in NASA's Critical Path Roadmap, "following exposure to microgravity, upright posture results in the inability to maintain adequate arterial pressure and cerebral perfusion. This may result in syncope (loss of consciousness) during re-entry or egress." [37]
Although considerable experimental effort has been focused on the problem of post-flight orthostatic intolerance (OI), there remains a lack of consensus about its physiological causes. Based on evidence gathered from astronauts during flight and from numerous bed-rest studies, a number of hypotheses have been considered to explain microgravity-induced orthostatic intolerance. Mechanisms that have been proposed as contributors to post-flight OI include: impaired venous return due to hy-povolemia [38, 39], hyhy-povolemia and changes in venous capacitance [40], decreased left ventricular distensibility [41-43], changes in cardiac function consequent to reduced cardiac mass [44], alterations in the venous compliance of the leg [45], changes in alpha-adrenoreceptor responsiveness [46], changes in baroreflex gain [38], alterations in vestibular influences on cardiovascular control [47], deficiencies in skeletal muscle function and reduced fitness [48, 49], and reduced systemic vasoconstrictor response
[49-54].
Hypovolemia is one of the best documented, unequivocally accepted adaptations to the weightless environment, and is certainly one of the principal contributors to the clinical presentation of post-flight OI. Increasing credence, however, is given to the possibility that, in addition, a critical combination of some of the other mechanisms mentioned above results in the astronauts' inability to tolerate gravitational stress upon return [12, 30, 49]. Furthermore, it is quite likely that the relative importance of the various contributing mechanisms is subject-specific and changes the longer the astronaut is exposed to the microgravity environment [30, 44].
1.2
Specific Aims
There are four specific aims to the research presented in this thesis:
1. To build a model of the cardiovascular system that is capable of simulating the short-term hemodynamic response to gravitational stress such as head-up tilt and lower body negative pressure.
2. To perform extensive sensitivity analyses on the model so developed in order to identify sets of parameters that significantly influence the hemodynamic re-sponse to gravitational stress.
3. To perform a clinical study to elucidate the transient and steady-state hemo-dynamic responses to rapid head-up tilt, slow head-up tilt, and standing up in normal healthy volunteers.
4. To use the model to test hypotheses regarding the maladaptation of astronauts to earth's gravitational environment upon their return from space.
5. To investigate which parameters of the cardiovascular system can be estimated from the transient hemodynamic response to changes in posture.
1.3 Thesis Organization
This thesis is organized in three major parts. The first part, on Computational
Cardio-vascular Model, comprises Chapters 2 through 4. Here we develop the hemodynamic
and the reflex model and present the validation of the composite model through com-parison of its predictions to experimental results taken from the medical literature.
The second part, Sensitivity Analyses and Parameter Estimation, consists of
Chap-ters 5 and 6 and introduces the analysis of the model assembled in the first part: we discuss global and local sensitivity analyses and introduce methods to estimate pa-rameters of the cardiovascular system from hemodynamic data streams. Chapters 7
and 8 constitute the third part of the thesis, Clinical Study and Model-based Data
Analysis. Here we present the results of the clinical study and use the model to aid
our understanding of post-spaceflight orthostatic intolerance.
In Chapter 2, we present the architecture of and the parameter assignments for the hemodynamic model. First, we present the topology of the systemic circulation deemed appropriate to represent blood volume redistribution between different vas-cular compartments. Next, we describe the representation of the cardiac chambers in terms of time-varying elastance models before turning our attention to the model of the pulmonary circulation. Subsequently, we describe the implementation in the model of commonly used orthostatic stress routines: head-up tilt, stand tests, and lower body negative pressure. We conclude the chapter with a description of the model implementation.
Chapter 3 focuses on the architecture and the parameter assignments of the
arterial baroreflex and the cardio-pulmonary reflex loop. Throughout Chapters 2 and 3, we try as much possible to provide the reader with a detailed rationale as to the
assignment of baseline numerical values to the parameters of the model.
In Chapter 4, we validate the model by comparing its predictions to experimen-tal results reported in the medical literature for normal healthy subjects. First, we compare the steady-state values of certain hemodynamic variables that are commonly used clinically to assess the cardiovascular state of patients. Next, we introduce the simulation of a population of normal subjects and compare the population-averaged values, their standard deviations, and ranges to the same set of hemodynamic vari-ables. It will be shown that the mean values, the standard deviations, and the ranges of the population simulation match their experimental analogs quite well.
Subse-quently, we introduce the simulations of the orthostatic stress tests and compare the
steady-state responses at different stress levels to reported experimental data. We also present the transient simulations for each orthostatic stress test. We conclude Chapter 4 with a simulation of the effects of exercise and concluding remarks on the forward modeling effort.
In Chapter 5, we begin to analyze the model with a series of sensitivity stud-ies aimed at identifying which parameters of the model contribute most to a given simulation output of choice. We will address this problem exclusively from a local perspective.
In Chapter 6, we turn our attention to the problem of estimating parameters of the
model from synthetic, noise-corrupted data. We will employ a non-linear least squares optimization algorithm along with a subset selection approach for overcoming the problem of ill-conditioning. We will show that this approach yields reliable parameter estimates for a small number of model parameters. Fixing the remaining parameters to a priori values has little effect on the quality of the parameter estimates.
Chapter 7 summarizes the results of the clinical study designed to elucidate the
transient hemodynamic response to rapid tilt, slow tilt, and standing up. We show
that each stress test leads to a somewhat different hemodynamic response. We also
demonstrate that despite marked differences in the transient amplitude response of standing up and rapid tilting, the timing of the initial hemodynamic response is well
preserved. We also demonstrate that the difference in the amplitude response can be explained on the basis of muscle contraction preceding the changes in posture.
In Chapter 8, we turn our attention to the problem of post-spaceflight orthostatic intolerance and how our model can help elucidate which changes in cardiovascular
performance have the greatest detrimental impact on orthostatic stress test
post-flight. We will briefly review the evolution of post-flight orthostatic intolerance from a historical perspective before summarizing mechanistic studies of its etiology. We will use the model to assess the system-level impact that some of the proposed mechanisms have on cardiovascular performance.
We summarize the contributions of this work and suggest further directions of research in Chapter 9.
Appendix A summarizes the numerical values of the hemodynamic and the con-trol models. In Appendix B, we describe the scaling laws and sampling algorithm employed to generate the population simulations introduced in Chapter 2.
Part I
Cardiovascular Model of
Chapter 2
Hemodynamic Model
In this chapter, we describe the architecture of the hemodynamic system and discuss in detail the numerical value assigned to each of the model parameters. We start in Section 2.1 by discussing the representation of the systemic vasculature. In Sec-tion 2.2, we focus on the cardiac model whose pump-funcSec-tion is described in terms of time-varying atrial and ventricular elastance waveforms. The pulmonary vascular model will be the topic of Section 2.3, where we will describe a non-linear, gravity-dependent model of the pulmonary microvascular resistance. In Section 2.4, we de-scribe the implementation of various orthostatic stress tests. Section 2.5 comments on the numerical implementation of the hemodynamic model.
2.1 Systemic Circulation
The systemic circulation can be conceptualized as comprising three distinct functional units: the arterial system (representing the aorta, large arteries, and the main and
terminal arterial branches); the micro-circulation (consisting of the arterioles and the
capillary network); and the venous system (consisting of the venules, terminal and main venous branches, the large veins, and the venae cavae). Substantial differences in their respective physical properties require separate representation of these three units at a resolution commensurate with our goal of simulating regional blood flow
during gravitational stress.
In this section, we will introduce the general architecture and topology of the systemic circulatory model and discuss in detail the choice of nominal parameter values.
2.1.1 Architecture
The central building block of the systemic circulation is the circuit analog repre-sentation of a vascular segment shown in Figure 2-1. The lumped physical proper-ties of each segment are characterized by an inflow resistance, R., an outflow resis-tance, Rn+l, and a capacitive element that represents the volume-pressure relation,
seg-ment under consideration to transmural pressure, aP = P,- P. In addition, the
pressure source Ph represents the hydrostatic pressure associated with the segment under consideration; Pe represents the pressure acting external to these vessels, such as intra-thoracic pressure, intra-abdominal pressure, or lower body negative pressure. The flows can be expressed using the constitutive relations for the resistors and the capacitor: Pn-1-P + Ph qn =
n
-qni - n - Pn+1 d = dV d P e)
dt
d(Pn - P) dt(P
Combining these expressions for the flow rates yields an expression for the rate of change of the luminal pressure, Pn:
d
P,-1 - P+ Ph Pn - Pn+I
d
P,=
+ Pe
(2.1)
dt
CnR
Cn~+l
+dt
where we have introduced the short-hand notation for the (incremental) vascular capacitance Cn = dVn/d(Pn - Pe). The entire hemodynamic model is thus described by a set of coupled first-order differential equations.
Since we are chiefly interested in cycle-to-cycle changes of pressures and regional blood flows, we have neglected all inertial effects. Their contribution to pressures and flows is greatest in the presence of large changes in flow rates, which commonly
occur within a beat, rather than from beat to beat. Even during sudden orthostatic
stress, cycle-by-cycle changes in blood flow are relatively small compared to changes in blood flow within the cardiac cycle. Defares estimated inertial effects to account for less than 1% of stroke volume and mean arterial pressure [55]. Inclusion of inertial effects would therefore only serve as cosmetic refinement of the arterial waveform
V.
Figure 2-1: Single-compartment circuit representation. Pn-1, Pn,, Pn+1: compartment pres-sures; Ph, Pe: hydrostatic and external prespres-sures; qn, qn+l, qc: flow rates; Vn: compartment volume; Rn,Rn+l: flow resistance.
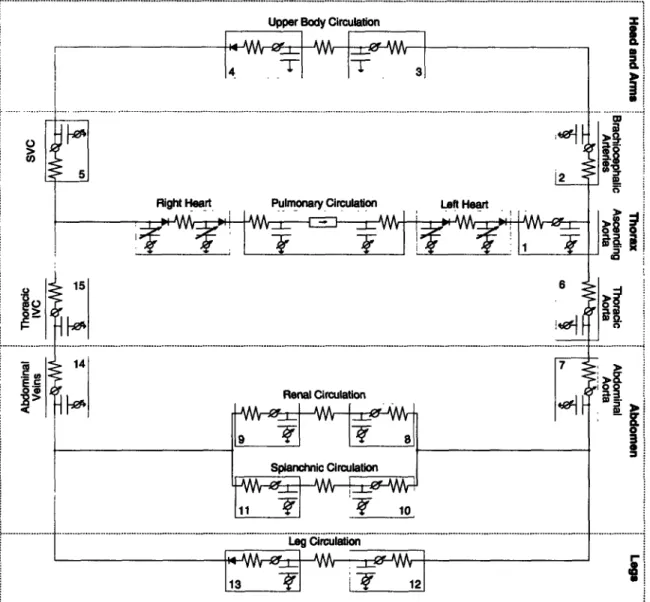
Figure 2-2: Circuit representation of the hemodynamic system. IVC: inferior vena cava; SVC: superior vena cava. Numbers indicate compartment index.
morphology and would come at an increased computational cost.
The topology of the entire hemodynamic system is modeled in Figure 2-2. The peripheral circulation is divided into upper body, renal, splanchnic, and lower body sections on the basis that they receive similar fractions of cardiac output [56]. The superior vena cava and the intra-thoracic and abdominal portions of the inferior vena cava are separately identified, as are the ascending aorta, the brachiocephalic arteries, and the thoracic and abdominal portions of the aorta. The arterio-venous resistances of the four peripheral vascular beds have not been assigned to particular arterial or venous compartments as their properties are representative of the respective micro-circulations. The latter are described primarily by their resistive properties and are assumed to exhibit negligible capacitive characteristics. The systemic circulation thus consists of fifteen compartments, each of which requires specification of a resistance, a pressure-volume relation, and an effective anatomical length. The latter will be
used to determine the compartments' hydrostatic pressure components in the erect posture. Since we will neglect gravitational gradients in the anterior-to-posterior direction, the effective anatomical lengths are the projections of the vessel lengths onto the major body axis.
Since the entire peripheral vasculature is represented by only four vascular beds, it is important for our later discussion of blood volume and blood flow distribution to be clear about which anatomical structures are assigned to which vascular bed. We assume the upper body compartment to represent the circulation of the head, the neck, and the upper extremities. The latter are assumed to account for 10 % of total skeletal muscle mass. Furthermore, we assume that one third of the blood supply to the skin and one half of the blood supply to the skeleton occurs in the upper body compartment. The renal compartment represents the kidneys and the adrenal glands.
The splanchnic compartment comprises the entire gastro-intestinal tract, one half of
the adipose tissue, and one third of the skin. Finally, the leg compartment represents the lower extremities and the pelvic circulation. As such, it contains 90 % of the skeletal muscle, one half of the skeleton, one third of the skin, one half of the adipose tissue, and the pelvic organs.
2.1.2 Parameter Assignments
Below and in sections to follow, we discuss in detail the rationale for the numerical values assigned to the various physical parameters of the hemodynamic system. In reviewing the medical literature, we strive to characterize each parameter by giving estimates for its population mean, its standard error, and, where possible, provide a reasonable physiological range. Since the choice of parameter values will define the nominal cardiovascular state of the model, we first comment on what we intend this nominal state to represent and which a priori assumptions this representation necessitates.
The main focus of this work is to understand the physiological response to ortho-static stress in normal, healthy subjects, of whom we consider astronauts to constitute a subset. The cardiovascular state of the model must therefore be representative of a normal, healthy subject population. However, it is well established that
particu-larly blood volume scales with the size of the subject under consideration [57]. In Table 2.1, we summarize anthropometric and cardiovascular variables for the subject population we aim to represent. The data are based on sizable clinical studies of normal male subjects who are assumed free of cardiovascular pathology [57-62]. In the following, we therefore assume a 169 cm, 70 kg subject with a total blood volume of 5150 ml and cardiac output of 4813 ml/min.
Vascular Lengths To determine the hydrostatic pressure component to be
as-signed to each compartment, we need to supply an estimate of the superior-to-inferior extension of the vascular segments each compartment represents. For most compart-ments, such as, for example, the thoracic aorta, this estimate is identical with their
anatomical length, as their primary orientation is parallel to the major body axis.
For the upper body, renal, and splanchnic compartments, however, this does not hold true and we estimate the vascular lengths of these compartments by their aver-age inferior-to-superior extension measured from the point of origin of their arterial blood supply.
Obtaining detailed measurements of vascular segment lengths from the literature proved to be surprisingly difficult, so we had to rely on anthropometric studies [61] and standard anatomy textbooks [63, 64] to assign most nominal values.
We represent the hydrostatic contribution of the blood column in the left ventricu-lar outflow tract, the ascending aorta, and parts of the aortic arch by a single, lumped hydrostatic pressure component. Assigning to the outflow tract half the base-to-apex length of the heart, which is about 10 cm [65], and using Gray's estimate of 5 cm [63, p. 1504] for the length of the ascending aorta, we can assign an anatomical length of approximately 10 cm to the aortic root compartment. Similarly, using Gray's esti-mate of 4 to 5 cm [63, p. 1513] for the brachiocephalic artery, we can assign a nominal value of approximately 4.5 cm to the compartment representing the ascending tho-racic arteries. The corresponding compartment on the venous side represents parts of the right atrium, the superior vena cava, and the brachiocephalic veins. Since they cover the same vertical height as the corresponding segments on the arterial side, their hydrostatic contributions have to be equal. Assigning 7 cm [63, p. 1592] to the superior vena cava and 2.5 cm to the right brachiocephalic vein [63, p. 1591] leaves
Table 2.1: Population characteristics of anthropometric and cardiovascular variables. BSA: body surface area; TBV: total blood volume; CO: cardiac output; MAP: mean arterial pressure; CVP: central venous pressure.
Height Weight BSA TBV CO MAP CVP
cm kg m2 ml ml/min mm Hg mm Hg
(169.3 ± 1.5) (70.3 ± 2.1) (1.83 ± 0.02) (5150 ± 124) (4813 ± 103) (91 ± 2) (6 ± 2) (161.5-186.8) (59.8-98.5) (1.51-2.10) (3750-6890) (4344-7602) (84-103) (2.2-9.6)
the remaining 5 cm to be assigned to the right atrium, which is about one half of the height of the heart. The remainder of the right atrium and the thoracic inferior vena cava account for a height of approximately 6 cm. Finally, at the level of the diaphragm
the hydrostatic contribution in the descending aorta must be equal to the hydrostatic
contribution in the thoracic inferior vena cava, which implies the descending aorta to have a nominal length of 16 cm.
Using ultrasonography in 180 adult healthy volunteers, Macchi and Catini [66]
report the lengths of the infra-renal portions of the abdominal aorta and inferior
vena cava to be (8.31 ± 0.22) cm with a range of (5.9 - 10.5) cm and (9.52 ± 0.27) cm with a range of (5.8 - 13.6) cm, respectively. The latter value agrees with the work by Bonnichon and co-workers [67] who used cavography to measure the length of the infra-renal inferior vena cava in 100 subjects, and report an average length of 9.6cm with a range of (8.0 - 14.2) cm. Martini [64] suggests that the renal arteries are located about 2.5 cm distal to the superior mesenteric artery, which in turn branches off the abdominal aorta approximately 2.5 cm distal to the coeliac trunk. The combined data therefore suggest a length of the inferior vena cava and abdominal aorta of
approximately 14 to 15 cm.
The lower extremity compartment of our model represents the vasculature of the legs and pelvis. Its anatomical height is approximated by the waist height, which is the vertical distance from the floor to the top of the iliac crest and has been measured in 24,469 US Army men [68] to be (105.6+5.0) cm with a range of (94.2 - 117.6) cm. This estimate is justified as the aortic bifurcation occurs at the base of the fourth lumbar vertebra which in turn is level with the iliac crest [63, p. 426]. The vasculature of the neck, the head, and the arms is lumped into a single upper body compartment to which we assigned a lumped vertical distance of 20cm. This value corresponds to the length of the common carotid arteries [63, p. 1514]. The kidneys are approximately symmetrical in shape about the transverse plane defined by the renal arteries and veins. As such, their superior-to-inferior extension does not contribute further to blood pooling and their effective hydrostatic length is assumed to be zero. Lastly, the splanchnic compartment comprises the circulation of the liver, the spleen, the pancreas, and the gastrointestinal tract which anatomically span the entire abdominal cavity. We assume most of the compliance of the splanchnic circulation to reside in the small and large intestines and assume their effective hydrostatic length
Table 2.2: Anatomical lengths of arterial vascular segments. Values given in cm. Compart-ment indices are from Figure 2-2.
Compartment Index
1 2 3 6 7 8 10 12
Mean 10 4.5 20 16 14.5 0 10 106
to be zero as well.
In closing the discussion on the lengths of the individual vascular segments, it
should be pointed out that the data for the arterial components described above are
all in good agreement with the estimates presented by Avolio [69] and Noordergraaf and co-workers [70]. Since it is unclear whether their estimates are based on actual anatomic investigations, we chose to justify the parameter assignments independently of their work. Our estimates of the anatomic lengths of the vascular compartments are summarized in Tables 2.2 and 2.3 where we have assigned the upper and lower limits in the general population to be + 10 % of the nominal value for variables where experimental ranges could not be found.
Pressure-Volume Relations Blood vessels behave like distensible tubes in that
they require a certain amount of volume (the unstressed or zero-pressure filling vol-ume) in order to be distended at zero transmural pressure; their vascular volume rises in an approximately linear fashion at low enough transmural pressures, and they exhibit an elastic limit at high transmural pressures. Figure 2-3 illustrates these characteristics for a human aorta and its major subdivisions [71]. It also demonstrates that the compliance of the human aorta changes not only as a function of transmural pressure but also along the length of the vessel. While the elastic properties of vascular segments are fully specified by their (non-linear) pressure-volume relationships, under baseline physiological conditions most vessels operate in a range of transmural pres-sures over which their pressure-volume relations can be presumed linear. Under the assumption of a linear pressure-volume relation over the range of 60 - 140 mm Hg, the data in Figure 2-3 suggest compliances per unit vessel length of 0.008 ml/mm Hg/cm, 0.017 ml/mm Hg/cm, and 0.028 ml/mm Hg/cm for the abdominal aorta, the thoracic aorta, and the ascending aorta, respectively. When analogously normalized by the lengths of the vessel segments, the unstressed volumes are 0.7ml/cm, 1.0 ml/cm, and 2.1 ml/cm. The values of 1.0ml/cm and 0.017ml/mm Hg/cm for the thoracic aorta compare very favorably with the values (1.20 ± 0.15) ml/cm and (0.013 i
0.002) ml/mm Hg/cm that can be estimated from the data reported by Hallock and
Benson [72] and reproduced in Figure 2-4. Assuming the same percentage errors, we assign (0.7 i 0.09) ml/cm and (0.007 ± 0.001) ml/mm Hg/cm to the abdominal
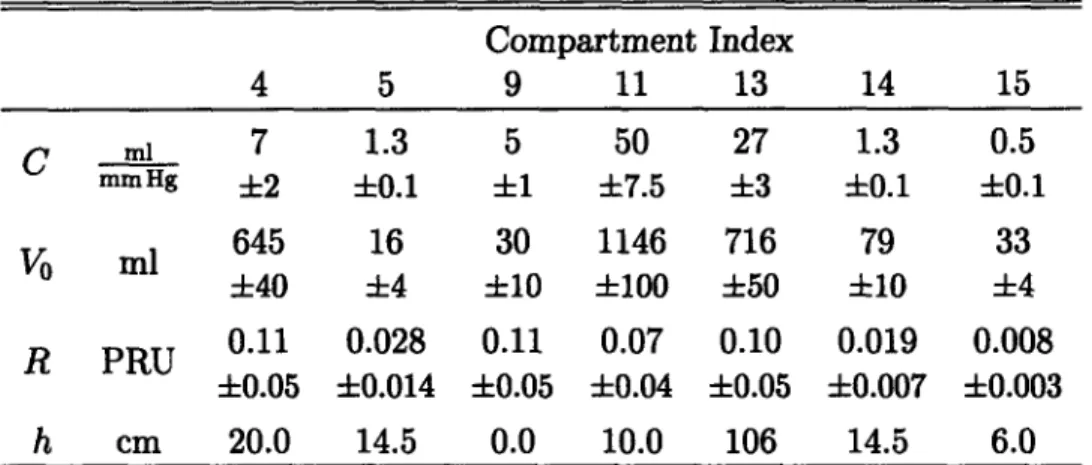
Table 2.3: Anatomical lengths of venous vascular segments. Values given in cm. Compart-ment indices are from Figure 2-2.
Compartment Index
4 5 9 11 13 14 15
Mean 20 14.5 0 0 106 14.5 6
t-_
80-0.
Ern Aor .a"
i 2.5 _Ao ~u25
At
1.5
1.0 Abdon" I A-qsO. - ' ' ' ' ' O.J 1 6 0 1 10 200 20 60 Ix 0 so 20D 25XTinmuural Prema Tnmwunl PRmure
(rmm H) (mn Hg)
Figure 2-3: Pressure-volume relation of a Figure 2-4: Volume per unit length of tho-human aorta. Segment lengths indicated in racic aorta. Solid line: population mean; parentheses. Data adapted from [71]. dashed lines: standard deviation. Data
adapted from [72].
aorta, (1.0 ± 0.13) ml/cm and (0.013 ± 0.002) ml/mm Hg/cm to the thoracic aorta, and (2.1 ± 0.3) ml/cm and (0.028 ± 0.004) ml/mmHg/cm to the ascending aorta,
respectively. Furthermore, we assume negligible difference between the histological structure of the ascending aorta and the brachiocephalic arteries and assign the same per-length values of unstressed volume and vascular compliance to that compartment.
Reliable experimental values for the lumped arterial compliances of the periph-eral vascular beds could not be obtained from the literature. In estimating these values, we assume that the compliance per unit length of the leg arteries is (0.004 ± 0.001) ml/mm Hg/cm, or approximately half the value of the abdominal aorta. Fur-thermore, we assign the same value, namely (0.42 ± 0.1) ml/mmHg, to the upper body and splanchnic compartments and half that value to the renal arterial
com-partment. The total compliance of the systemic arterial system thus equates to
(2.19 ± 0.27) ml/mm Hg.
During orthostatic stress, the venous transmural pressures in parts of the
depen-dent vasculature can reach levels at which the non-linear nature of their pressure-volume relations become important [73, 74]. This phenomenon was investigated by Henry [75], who used water-displacement plethysmography to measure changes in the volume of both legs as a function of increments in venous distending pressure. His data for one subject are reproduced in Figure 2-5. It should be recalled that the leg compartment in our model represents the dependent limbs and the pelvic circulation. Figure 2-6 shows the pressure-volume relation of a common iliac vein [76]. Under the assumption that the right and left common, internal, and external iliac veins have the same physical characteristics, the pelvic venous vasculature accommodates roughly one tenth of the venous volume of the legs at physiological transmural pressures, and has about 4% of their vascular compliance. A non-linear model of the venous pressure-volume relation has been implemented assuming a functional relationship
A_ An_
MU-1* 4nk 500-200:
i
3.5-.0 20- 1.S-10 0 26 GO 75 100 -o 6 0 6 10Venaus Pm h emnt" Trnsnwure
Figure 2-5: Pressure-volume relation of Figure 2-6: Pressure-volume relation of a both legs. Data (filled circles) adapted from common iliac vein. Data (filled circles)
[75]. adapted from [76].
between total vascular volume, Vt, and transmural pressure, AP, of the form
Vt(aP) = V0+ m arctan 27fr 2 p 0PAP
for
P >
where Vma, denotes the distending volume limit of the lower body compartment, Co is the vascular compliance at zero transmural pressure, and V0 is the venous unstressed volume. Synthesizing the information from Figures 2-5 and 2-6, we assign (1200 ± 100) ml to Vma, and (20 ± 3) ml/mm Hg to Co. The data reviewed by Leggett and Williams [77] suggest a total blood volume of the legs, pelvis, and buttocks of approximately 1112 ml in the supine posture if one assumes that the leg and gluteal
muscles make up the majority of skeletal muscle in the human body. Accounting for 160ml and 36 ml of distending volume for the venous and the arterial vessels, respectively, suggests an unstressed volume of 916 ml of which we assign (200 + 20) ml
to the arterial compartment and the remaining (716 ± 50) ml to the venous side.
Figure 2-6 can also be used to obtain an estimate of the compliance of the inferior vena cava which is formed by the confluence of the right and the left common iliac veins. Assuming that the physical properties of the inferior vena cava are not signif-icantly different from the ones of the common iliac veins, and combining the data in Figure 2-6 with the morphometric analyses by Macchi and Catini [66], one can esti-mate the caval compliance per unit length to be (0.09±0.01) ml/mm Hg/cm. Combin-ing this value with the length estimates from Table 2.3 yields (1.3 ± 0.1) ml/mm Hg, (0.5 ± 0.1) ml/mm Hg, and (1.3 ± 0.1) ml/mm Hg for the compliances of the abdomi-nal, the thoracic inferior, and the thoracic superior vena cava, respectively. Assuming a central venous pressure of (6 ± 2) mm Hg in combination with the compliance of (1.8 ± 0.1) ml/mm Hg for the entire inferior vena cava suggests a distending volume of (10.8 i 3.6) ml. The data by Macchi and Catini cited above suggest a total volume of
the inferior vena cava of (116 ± 12) ml which, in turn, suggests an unstressed volume of (53 ± 13) ml or (5.5 ± 0.6) ml/cm.
The splanchnic circulation is the most capacious vascular bed and the principal reservoir of blood volume in the entire circulation. Under normal physiological con-ditions, it is estimated to contain about (20-26)% of total blood volume [77] and to receive about 25% of cardiac output [56]. Animal experiments in dogs suggest a specific splanchnic vascular compliance of (1.0 ± 0.4) ml/mm Hg/kg body weight [78]. While it would be fallacious to extrapolate from this value to the human body as the spleen of the dog in particular is a much bigger relative blood reservoir than it is in the human [79], the specific vascular compliance of the dog does provide an upper bound on the venous vascular compliance of the human splanchnic vascular bed. Rowell [80, p. 207] cites a specific vascular compliance of 2.5 ml/mm Hg/kg of tissue weight for the intestines and suggests ten times this value for the liver. Com-bining these estimates with the dry tissue masses for humans tabulated by Leggett and Williams [77] suggests an average human splanchnic venous compliance of ap-proximately 50 ml/mm Hg. We shall assume a value of (50 ± 7.5) ml/mm Hg where the relatively large uncertainty is reflective of the lack of more accurate experiments to refine the estimate. The data compiled by Leggett and Williams [77] also suggest total splanchnic blood volume to be 1880 ml. Assuming an arterial unstressed volume of (300 ± 50) ml and a splanchnic venous pressure of 8 mm Hg suggests an unstressed volume of (1142 ± 100) ml for the splanchnic venous circulation.
The kidneys are thought to contain (2.0 + 0.7) % of total blood volume or (120 40) ml [77]. Assuming arterial renal unstressed volume to be (20 ± 5) ml and account-ing for another (20 ± 5) ml of arterial stressed volume leaves approximately 80 ml of renal venous volume. Assuming a venous vascular compliance of (5 + 1) ml/mm Hg suggests a venous unstressed volume of (30 + 10) ml.
Finally, the circulation of the head, the neck, and the upper limbs constitute the
upper body compartment to which we assign (18.2 ± 2.9) % of total blood volume, or (937 ± 90) ml, based on the percentage estimates tabulated in [77]. The arterial distending volume is approximately (38±8) ml. When assuming an arterial unstressed volume of (200 ± 40) ml we are left with a total venous volume of approximately (700±50) ml. Bleeker and co-workers [81] used occlusion plethysmography to estimate the compliance of the arm veins. Their data suggest a lumped venous compliance of both arms of (1.2 ± 0.2) ml/mm Hg and is probably a conservative estimate of the true venous compliance as their measurement of volume is made at single location. We assign a lumped venous compliance of (7 ± 2) ml/mm Hg to the upper body compartment which reflects our belief that the large veins in the neck contribute significantly to the capacitance of this compartment. The venous unstressed volume is therefore assigned the value of (643 ± 50) ml.
Resistances The largest resistance to blood flow occurs at the level of the
pre-capillary arterioles within the systemic micro-circulation. We represent these resistive properties by a lumped resistance for each of the four micro-circulatory beds. Minor resistance to blood flow occurs along the systemic arterial and venous circulations.
Based on the data reviewed by Leggett and Williams [56] we assume 22 % (15 %
-Table 2.4: Parameter assignments for systemic microvascular resistances.
Microcirculation
upper body kidneys splanchnic legs
R PRU (4.9 + 1.7) (5.2 ± 1.0) (3.3 ± 1.0) (4.5 ± 1.8)
24 %) to perfuse the kidneys, 33 % (24 % - 48 %) to flow through the splanchnic
com-partment, and 24 % (14 % - 33 %) to represent pelvic and leg blood flow. Assuming a perfusion pressure of (87± 10) mm Hg and cardiac output of (4813 ± 103) ml/min, the respective micro-vascular resistances, where we chose to represent the numerical val-ues in terms of peripheral resistance units, PRU = mm Hg s/ml, are (4.9±1.7) PRU, (5.2 ± 1.0) PRU, (3.3 ± 1.0) PRU, and (4.5 ± 1.8) PRU for the upper body, renal, splanchnic, and leg compartments, respectively.
The resistances on the venous side can be estimated from the respective flows and observed pressure drops along the venous system. Barratt-Boyes and Wood [60] measured the pressure drop between the inferior vena cava and the right atrium to be (0.5 ± 0.2) mm Hg, suggesting a venous flow resistance of (0.008 ± 0.003) PRU for the thoracic inferior vena cava compartment and (0.019 ± 0.007) PRU for the abdominal vena cava compartment, respectively. The authors report the same pressure drop of (0.5 ± 0.2) mm Hg between the superior vena cava and the right atrium, which suggests a value of (0.028 ± 0.014) PRU for the flow resistance of the superior vena cava compartment. Arnoldi and Linderholm [82] report venous pressure to drop by (2.8 ± 1.1) mm Hg between various locations in the deep veins of the legs and and the right atrium. This suggests a venous resistance of (0.05 ± 0.06) PRU for the outflow resistance of the leg compartment. This resistance value is rather small and quite likely a low estimate of the venous outflow resistance. We will assume a slightly
Table 2.5: Parameter assignments for the systemic arterial compartments. Compartment
indices are from Figure 2-2.
Compartment Index 1 2 3 6 7 8 10 12 C ml 0.28 0.13 0.42 0.21 0.10 0.21 0.42 0.42 mm Hg 0.04 ±0.02 ±0.10 +0.03 ±0.01 +0.05 -0.05 +0.10 V ml 21 5 200 16 10 20 300 200 +3 +1 +40 ±2 +1 +5 +50 ±20 R PRU 0.007 0.003 0.014 0.011 0.010 0.10 0.07 0.09 +0.002 ±0.001 +0.004 +0.003 0.003 +0:05 +0.04 +0.05 h cm 10.0 4.5 20.0 16.0 14.5 0.0 10.0 106