MoLT.
UBRARJES
-0£WEf
»Digitized
by
the
Internet
Archive
in
2011
with
funding
from
Boston
Library
Consortium
Member
Libraries
HB31
.M415
AO,
Dewey
@
working
paper
department
of
economics
COMPARING
APPLES TO ORANGES:
PRODUCTIVITY CONVERGENCE AND
MEASUREMENT
ACROSS INDUSTRIES AND COUNTRIES
Andrew
6.Bernard
Charles
I.Jones
94-12
Dec.
1993
massachusetts
institute
of
technology
50 memorial
drive
Cambridge, mass.
02139
COMPARING APPLES TO ORANGES:
PRODUCTIVITY CONVERGENCE AND
MEASUREMENT
ACROSS INDUSTRIES AND COUNTRIES
Andrew
6.Bernard
Charles
I.Jones
M.I.T.
LIBRARIES
JUL
12
1994
Comparing
Apples
to
Oranges:
Productivity
Convergence
and Measurement
across Industries
and
Countries*
Andrew
B.Bernard
Chaxles
I.Jones
Department
ofEconomics
Department
ofEconomics
M.I.T.
Stanford University
Cambridge,
MA
02139
Stanford,CA
94305
March,
1994
*We
thank Roland Benabou, Antonio Ciccone, Steven Durlauf, Michael Kremer, PaulRomer
RobertSolow, John Taylor,and Alwyn Youngforhelpfulcomments as well as seminarparticipants at Boston
Uni-versity, U.C. Berkeley,Harvard, Stanford, and the
NBER
Growthgroup.We
aJso thank Kevin Hetherington and Huijdng Li for excellent research<issistance. All errors are ours.Abstract
This
paper examines
the role of sectors in the convergenceof aggregate productivity levels in 14OECD
countriesfrom
1970-1987.The
major
finding is thatmanufacturing
shows
little evidence of either labor productivity or multi-factor productivity convergence while other sectors, especially services, are driving the aggregate convergence result.
The
paper
introduces a
new
measure
of multi-factor productivitywhich
avoidsproblems
inherent to traditionalTFP
measures
when
comparing
productivity levels.A
model
of trade,learning-by-doing,
and
spillovers is developedwhich
can explain convergence insome
sectorsand
divergence in others.
1.
Introduction
Comparisons
ofproductivityperformance
across countries are central tomany
ofthe ques-tions concerning long-runeconomic
growth: are less productive nations catchingup
to themost
productive countries,and
ifso,how
quicklyand by
what
means?
Groups
as disparateas
economic growth
theoristsand
business leaders expressprofound
interest in theanswer
to the question of
whether
the U.S. canmaintain
its role as the world productivity leader.^The
question itself is potentially misleading; shouldwe
be interested in the productivity ofthe entire private sector or that of individual industries;
and whatever
the level of analysis, arewe
concerned with labor productivityoramore
generalnotion oftechnologicaladvance?
Using data
for agroup
of 14 industrialized countriesfrom
1970-1987.we
askwhether
trendsin aggregate productivity are also reflected at the individual industry level taking care to distinguish
between
productivity of laborand
that of all factors taken together. In the process,we
consider the complicated question ofhow
tocompare
multi-factor productivitylevels across
economies
and
provide anew
measure
oftotal technological productivity.The
results for individual industries are quite striking.While
aggregate productivitywas
converging over the period, the sectorsshow
disparate behavior. For allmeasures
of productivity, themanufacturing
sectorshows no
or little convergence, while other sectors,especially services,
show
strong evidence in favor of convergence. This finding for servicestogether with the declining share of
manufacturing
in all 14 countries contributes to theconvergence
found
at the aggregate level.The
lack of convergence withinmanufacturing
overthis seventeen year periodindicates that convergenceis not
an automatic
phenomenon.
Most
theoriesofeconomic growth
predict thatopenness
and
spilloversfrom
R&D
investmentwould
contribute to convergence across countriesand
thus are not easily reconciled withthese findings.
However,
we
interpret this result in the context ofa
simplemodel
of tradeand
learning-by-doingand
argue that the lack of convergence withinmanufacturing
may
not be all that surprising.
These
results are especiallypertinent to thestudy ofconvergencein countries at
more
heterogeneous levels of development. In a recentpaper
Young
(1992)showed
that whileHong Kong
and
Singapore apparentlyfollowed similargrowth
paths, theirproductivity
performances were
quite dramatically different.Our
results suggest further that convergenceofaggregate productivitymay
mask
substantial differences at the sectorallevel.
Previous
work
on
convergence across countries has concentrated almost exclusivelyon
labor productivity using
GDP
per capitaas the measure. Thisisdue
largely toa lack ofdataon
laborand
capital inputs necessary to construct broadermeasures
of productivity.Using
cross-section regressions,
Baumol
(1986),Barro
and
Sala-i-Martin (1991, 1992)and
Mankiw.
Romer
and Weil
(1992) argue that countriesand
regions are converging, or catching-up,since initially
poor
areasgrow
fasterthan
their richer counterparts.However,
thecross-section evidence is not uniform.
Barro
(1991)and
DeLong
(1988)show
that the particularsample
ofcountries determineswhether
catch-up holds.Time
series resultson
longer series forOECD
countries alsoshow
evidence ofcommon
trends butno tendency
for convergencein levels (for
example,
seeBernard
and Durlauf
1991).The
use of labor productivity necessarily entails restrictionson
thedepth
of analysis.By
its very definition, achange
in labor productivityconfounds
potential changes intech-'Forexample,
nology
and
factor accumulation.Convergence
in a neo-classicalgrowth framework
placesheavy emphasis on
the accumulation of capital as the driving force behind convergence, but analysis oflabor productivity does not allow theidentification ofseparate influences oftechnology
and
capital.To
thisend
we
considerboth
multi-factor productivitymeasures
and
labor productivity measures.To
conduct
our analysis of convergencewe
requireboth growth
rates of productivityand
the productivity levels themselves.Most
analyses of productivity concentrateon
thechanges, thus avoiding complicated issues concerning the
measurement
and comparison
ofproductivity levels across industries
and
countries,which
is particularly difficult for multi-factor productivity. In section 2.we
describe in detail ourmeasure
of Total Technological Productivity(TTP).
Thismeasure
is constructed to ensure thatwe
canconduct
cross-country
and
cross-industrycomparisons
with as fewassumptions
as necessary.1.1.
Aggregate
Convergence
The
fundamental
piece ofevidenceon
cross-nationalgrowth
in theOECD
countries is thatproductivity
and output
per capita differenceshave
narrowed
overtime.Log
levels oflabor productivity,Yj
L,and
TFP
areshown
for total industry, excludinggovernment,
for 14OECD
countriesfrom
1970-1987 in Figure 1.^y/i
hasgrown
on
average at a rate of2.4%
per year, but thegap between
themost
productive country, the U.S. over the entire period,and
the least productive country declined consistentlyfrom
1970 to 1987.The same
qualitative results hold for the
measure
ofTFP;
there is substantialnarrowing
of thegap
between
the leader, again the U.S.,and
the less productive countries.However,
liie--degiee_of catch-up is less for the
TFP
measure, suggesting that capitalaccumulation
is playing arole in the convergence oflabor productivity.
The
reduction in cross-section dispersion can be seen again in the lower halfofFigure 1which
plots the cross-section standard deviations ofY
jL
and
TFP.
Cross-section dispersion declines steadilythroughout
the periodfrom
24%
to 14%
forboth
labor productivityand
from
17%
to12%
for multi-factor productivity. Tests for catch-up, regressions of averagegrowth
rateson
initial levels ofthe productivitymeasures
for the 14 countries, confirm the visual evidence.'^ (i.i; 0.71-(l),=
-
^
(i):"
3coef
0.3109-0.0298
R
s.e. (0.0501) (0.0052)'^Y/L isconstructed asoutput per worker.
TFP
isconstructed asaweighted averageofcapital andlaborproductivities vnth theweights being the averagefactor shares over timeand across countries. All analysis
with productivity is done using the logs of the levels. Throughout the paper we maintain the assumptions
ofconstant returns toscale and perfectcompetition. This means wecalculateour laborshares usingoutput
rather than cost shares, notan innocent assumption. Here wehold the laborshareconstant across countries
and time. In Section 2 we discuss this assumption in greater detail. The countries in the sample are the U.S.,Canada, Japan, Germany, France, Italy, U.K., Australia,theNetherlands, Belgium, Denmark, Norway,
Sweden and Finland. The U.S. is denoted by a "o" and Japan by a "-(-" in most figures.
"'Average growth rates here and throughout the paper are constructed as the trend coefficient from a
regression of the log level on a constant and a linear trend. This minimizes problems with measurement
ATFP,
=
a
+
f3TFP}^'°
+
coef
0.1428-0.0226
Js.e. (0.0322) (0.0056)
(1.2)
R^
: 0.54The
coefficientson
the initial levels are negativeand
strongly significant forboth
mea-sures.
Both
laborand
total factor productivitymeasures
for aggregateoutput
indicate thatless productive countries are catching-up to the
most
productive countries."*Based on
thesimple
model
presented in the third section, these estimatesimply
that labor productivity is converging at a rate of3.85%
per year, faster than the2.87%
forTFP.^
The
resultsfrom
Equations
1.1and
1.2 suggest that convergence is continuing for theseeconomies even
intothe 1970"s
and
1980's.To
understand
what
is drivingthis strongevidenceofconvergencefortotal industry pro-ductivity,we
now
turn to the evidencefrom
the sectoral data. First,we
examine problems
with simple
TFP
measures
and
construct an alternativemeasure
called total technological productivity, orTTP.
We
then construct six broadly defined sectors for eacheconomy
and
test for
convergence
in labor productivityand
TTP
within each sector across countries. Finallywe
develop amodel
of trade, learning-by-doingand
spilloverswhich
accords withmany
of the empirical factson
sectoral convergence.The
rest of thepaper
is divided into 5 parts: Section 2 discussesproblems measuring
multi-factor productivity levels
and
introduces anew
measure; Section 3 presents asimplemodel
of technologicalchange
within sectors; Section 4 analyzes themovements
of laborproductivity
and
technological productivity within industries across countriesand
tests forconvergence; Section 5 develops a
model
of trade, leaning-by-doingand
spillovers; Section6 concludes
and
discusses further research.2.
Measuring
Factor
Productivity
Beginning
with thework
ofSolow
(1957),growth
accountingand comparisons
of factorproductivity
have
played aprominent
role inmacroeconomics.
Most
such analyseshave
compared
growth
rates ofmulti-factorproductivity(MFP),
and
the theoretical foundationsfor
measuring
multi-factor productivitygrowth
rates are well-established. FollowingSolow
(1957).
one
can defineMFP
growth
as theamount
by which output would
grow
iftheinputswere
held constant,and
thisgrowth
rate can be calculated asAlnYt
-
aAlnLt
-
(1-
a)\lnKt,
""Time series testsalso provideevidenceofconvergence for measuresofTotal Industry TFP. SeeBernard
and Jones (1993).
^In contrast, Barroand Sala-i-Martin (1992) havefound
2%
convergenceforaggregateoutput per capitai.e. as the
Solow
residual,where q
is labor's share of final output.The
motivation for this calculation is extremely general;no
assumptionson
the specific functionalform
oftheproduction function are required.^ In recognition of the fact that the labor share variesover
time, it is
common
toemploy
a Divisia index of multi-factor productivity growth,which
in this case corresponds to the
Solow
indexwhere
Qt=
.5(at+
Q(_i) is used in place ofa
(e.g. see Caves, Christiansen,
and
Diewert (1982)). This is themeasure
of multi-factorproductivity
growth
thatwe
employ throughout
the paper. In contrast, the question ofconvergence is intrinsically a question of
comparing
productivity levels, notgrowth
rates.Moreover,
the theoreticalfoundations forcomparing
multi-factorproductivity levels arelesswell established.^
Combining
these observations, theproblem
ofcomparing
productivitylevels at all pointsin time reduces to a
problem
ofcomparing
productivity levels at asingle point in time: theremaining
levels can be calculated using the Divisia productivitygrowth
rates. In thecontext of convergence, then, it is natural to think of the
problem
asone
ofcomparing
initial levels of multi-factor productivity.
In this section,
we
argue that themost
obviousmethod
ofcomparing
multi-factorpro-ductivity levels,
examining
Hicks-neutralTFP
level measures, results incomparisons
thatcan be arbitrarily altered
under
very simple assumptions.We
document
the use of suchmeasures
in empiricalwork
relevant to this paper. Finally,we
introduce anew
measure
of multi-factor productivity.Assuming
aCobb-Douglas
production function,Y
=
AK^'"'
L^
, the Hicks-neutralmea-sure of
TFP
is givenby
A,which
is equal to a weighted average of capitaland
labor productivity:lnTFP
=
aln{^)
+
{l-a)ln{'^).
(2.1)L
A
The
problem
with thismeasure
is that iftheparameter
a
differs across countries,com-parisons ofthis
measure
ofTFP
can be misleading, for at leasttwo
reasons. First,suppose
that
two
countrieshave
exactly thesame
inputs (i.e. thesame
capitaland
thesame
labor)as well as the
same
level ofA, but theyhave
different q's. Clearly, thesetwo
countries willproduce
different quantities of output.The
problem
withA
as ameasure
of technology here is that it is incomplete: the technology of production varies with thea
parameters
a^ well as with the A's,and
the simple Hicks-neutralmeasure
ofTFP
does not take this intoaccount.
However,
there is anothermore
seriousproblem
with the Hicks-neutral measure;ar-bitrarily small differences in the
a
parameters
across countriesimply
that changes in theunits of
measurement
for an input canchange
the ranking of productivity levels. This iseasily seen in equation 2.1 above.
Suppose
thattwo
countrieshave
capital-output ratiosthat are equal to one, so that the
TFP
is simply equal to(Y/L)f.
Notice thatTFP
isnow
measured
in, forexample,
dollars perworker
raised tosome power
that differs across countries.By
changing
the units ofmeasure
(e.g.measuring
labor in millions ofworkers),^The key assumptions, ofcourse, are constant returns and competitive factor markets.
'Authors suchas Kendrick and Sato(1963), Christiansen, Jorgenson, and Lau (1971), and Caves, Chris-tensen, and Diewert (1982) haveproposed methods for comparing multi-factor productivity levels, and we
this will rescale
TFP
by
a factor that varies across countries. It is easy toshow
formallythat
one
can always reverse ranks in pairwisecomparisons
ofTFP
levels given arbitrarilysmall differences in the
a
parameters.^It is
tempting
to infer that thesame
problem
must
exist incomparing
TFP
levels attwo
points in time, implying thatcomputations
ofTFP
growth
rates are arbitrary. Infact, this is the motivation for using Divisia
growth
rateswhen
factorexponents
vary overtime. In the Divisia calculation, the
same
factor share (an average) is used tocompare
theproductivitylevels in
two
different years toproduce
agrowth
rate,eliminating the problem.As
the intervalbetween
thetwo
periods gets small, the changes in factor shares also getsmall so that usingtheaveragefactorshare
imposes
verylittledistortionon
theproductivity measure.The
problem
with cross-countrycomparisons
is that there isno
sense inwhich
the factor shares will necessarily be getting closer together:
we
can reduce differences intime
by
increasing the frequency ofobservationand
invoking continuity;we
cannot reducedifferences across countries.
2.1.
A
Solution:
Total Technological Productivity
(TTP)
According
to the results in the previous section, if factor shares vary substantially across countries,comparisons
of productivity levels using the Hicks-neutralmeasure
ofTFP
can be misleading.The
first questionwe must
ask, therefore, iswhether
or not thisvariation infactor shares is a
problem
empirically. Figure 2 illustrates that it is: for total industry inour data, the labor share varies substantially
both
across countriesand
over time.^With
this motivation,
we
turnnow
toa
new method
forcomparing
productivity levels.The
joint productivity of capitaland
labor varies withboth
the"A"
term
in front oftheproduction
functionand
with the factor exponents.To
captureboth
ofthese contributionsto productivity,
we
definea
new
measure
that will be referred to as total technologicalproductivity
(TTP). At
any
point in time for country (or country-sector) i,TTP
is definedas
TTP,t^FiKo,Lo,i,t).
(2.3)TTP
has a very intuitive interpretation: itshows which
countrywould produce
more
output
if all countriesemployed
exactly thesame
quantitiesof capitaland
labor. Since A'^and
Loare constant across time
and
country or sector,comparisons
using thismeasure
incorporate only variation in the production function itself, not in the quantities of the inputs. In'We
show the following: Ifthe factor exponents in the production function differ, then a pairwisecom-parison of
TFP
using the simple measuredefined above can generatedifferences that are arbitrarily largeand either positive or negative bychoosing the appropriate unit ofmeasure for asingle input.
Proof: Considercomparing
TFP
in region 1 wdthTFP
in region 2. Without lossof generality, alter the units used to measurethe labor input by amultiple, 9. Thedifferencebetween the twoTFP
levels, denotedDtfp{S) is
DTFp{e)
=
[nAi{8)-\nA2{9) (2.2)=
ln(yi/y2)-ln(A'i/A'2)-l-ailnA'i-
02InA'2-
ailn{eLi)+
a2\n(dL2)=
DTFp{l)+lRS{a2-ai).
By choosing non-negative valuesof9, Dtfp(9) can takeon any value.
QED
^Laborsharevariesover timeandacrosscountriesforothersectorsas well,especially manufacturingand
this sense, this definition of multi-factorproductivity is closely related to the definition of
MFP
growth
givenby Solow
(1957). In practice,we
willassume
that the function F(-) isCobb-Douglas
so thatIn
TTP^t
=
In A,t+
(1-
a.*)In h'o+
a,t In!„
(2.4)where
In Ait is defined as:In A,t
=
(1-
a,() In(^^)
+
au
In(|^)
(2.5)Here, the labor share is allowed to vary across countries, sectors,
and
time to allow for thepossibility that different industries in different countries
have
access to differenttechnolo-gies. Similarly, recognizing that
we
are usually dealing with aggregate data,we
allow theexponents
in the aggregate production function to vary over time. This variation couldresult
from
true technological variation orfrom changing
sectoral composition within acountry.
It is easy to
show
that this definition of multi-factor productivity is robust to thecrit-icisms of Hicks-neutral
TFP
given above. First,by
its very definition, countries with thesame
levels ofinputsand
thesame
technology willproduce
thesame
output. Second, themeasure
is alsorobust tochanges inthe units used tomeasure
the inputs. Intuitively,what-ever scaJe
changes
areinduced
by
changes in the units ofan
input affect the calculation ofIn
A
in exactly the opposite way, leavingTTP
unaffected.2.2.
Other Production
Functions
and
Productivity
Measures
The
variation in factor shares across countriesand
over time suggests that the standardCobb-Douglas
production functionmust
be generalized.We
choose to generalize in thestraightforward
way
of allowing the factorexponents
in theCobb-Douglas form
to varyacross countries, sectors,
and
time.However, two
alternative generalizations are theCES
production function
and
the translog production function,which
have been
used elsewherein the literature
on
productivity comparison.While
extending our analysis to thesemore
generalfunctionalforms
might
be useful,we
discussbelow
thelimitationsofsuchan
exercise.One
alternative is theCES
specification,recommended
by Kendrick and
Sato (1963),which
allows factor shares to vary monotonically with the capital-labor ratio. In our data,however, it appears that factor shares
do
not vary monotonically with the capital-laborratio, nor
do
the factor sharesbehave
similarly across countries.Within
a country, forexample,
the relationship is typically not monotonic,and
across countries, factor sharesdiffer substantially.
Thus,
toexamine
productivity differences using theCES
productionfunction,
we
would have
to allow theelasticity of substitutionbetween
factors tovary across countriesand
even, perhaps, overtime.Another
alternativeis thedefinitionofproductivityproposed
by
Caves, Christensenand
Diewert (1982). Theirdefinitionisbased
on
the translogproductionfunctionfirst consideredby
Christensen, Jorgenson,and
Lau
(1971).While
we
feel itwould
be useful to extendthe empirical results in this
paper
using the translog definition of productivity, tentativeexplorations in this direction suggest that the extension
would
notbe
straightforward. Forproduction function
depend on
thelevelof capitaland
thelevel of labor. Specifically, Caves, Christensen,and
Diewert (1982)show
thatSit
=
/3l+
f3KLInK,t+
Pll
InLa
where
sa represents factorpayments
to labor asa
shareofoutput. Noticethat the interceptin this equation is allowedto vary
by
country, but the other coefficients are constant across countriesand
over time. Empirical estimates of this equation using ourdata
reveal that the null hypothesis that the coefficientson
InK
and
InL
are constant across countries isstrongly rejected. For
example,
theF
test ofthis hypothesis for thetotalindustry aggregateproduces
a statistic of 9.35compared
to the1%
critical value of 1.70; for manufacturing,the statistic is 7.54,
which
can becompared
to thesame
critical value.Using
either theCES
or translog production setup does not address thefundamental
problem
that theparameters
of the production functionmay
vary across countries. Forthis reason
and
withan
appeal tosimplicity,we
maintain
theassumption
ofCobb-Douglas
functional
form
and
allow the factor shares to vary across time, country,and
sector.As
willbe
discussed inmore
detail later, Dollarand Wolff
(1993) also focuson
produc-tivity
convergence
using industrydata
and employ
the followingmeasure
ofproductivity:J'ppPW _
'^nIt
aUt^[l-a)Ku
where
a
is the labor share oftotalcompensation,
assumed
constant across units of obser-vation.It iseasy to
show,
using thearguments
provided above,thatthismeasure
ofproductivity is not robust toa
change
ofunits. Forexample, by
choosing the units inwhich
tomeasure
L,
one
canmake
the contributionofL
tothismeasure
arbitrarily small sothatcomparisons
win
look exactly likecomparisons
of capital productivityY/K.
Similarly,by
choosing the units inwhich
tomeasure K, one
canmake
the contribution ofK
arbitrarily small so thatcomparisons wiU
look exactly likecomparisons
of labor productivity. If the rankings of capital productivityand
labor productivity differ fortwo
countries, theneither country canbe
shown
to be themore
productiveby
choosingthe appropriate units atwhich
tomeasure
the inputs.
Our
data
suggests that suchproblems
are not simply theoretical oddities: forall three key aggregates (total industry, manufacturing,
and
services) in 1970,Japan
has a highercapital productivity levelthan
the U.S. while the U.S. has higher labor productivity.Thus,
productivitycomparisons
of the U.S.and
Japan
using themeasure
ofDoUar
and
Wolff
(1993) willdepend
criticallyon
the units inwhich
capitaland
labor aremeasured.
In addition, it is
worth
noting that theproblem
heremay
bemore
severethan
with themeasure
ofTFP
discussedabove
becausethis criticism holdseven
when
thefactorexponents
(the q's) are constant across countries. This
measurement argument
providesone
possibleexplanation for the differences
between
our resultsand
thoseemphasized
by
DoUar
and
Wolff.
2.3.
Remaining
Issues
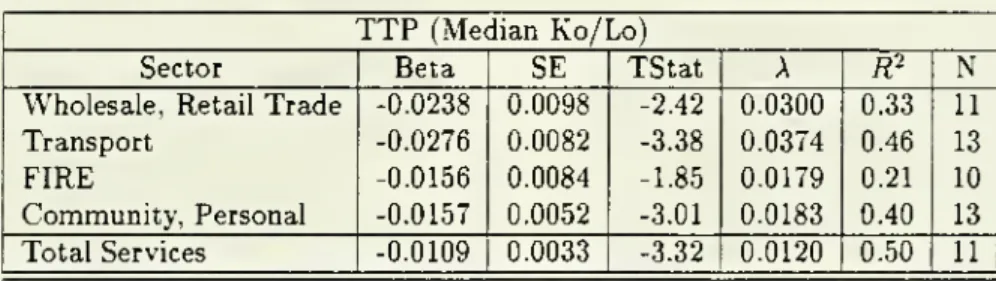
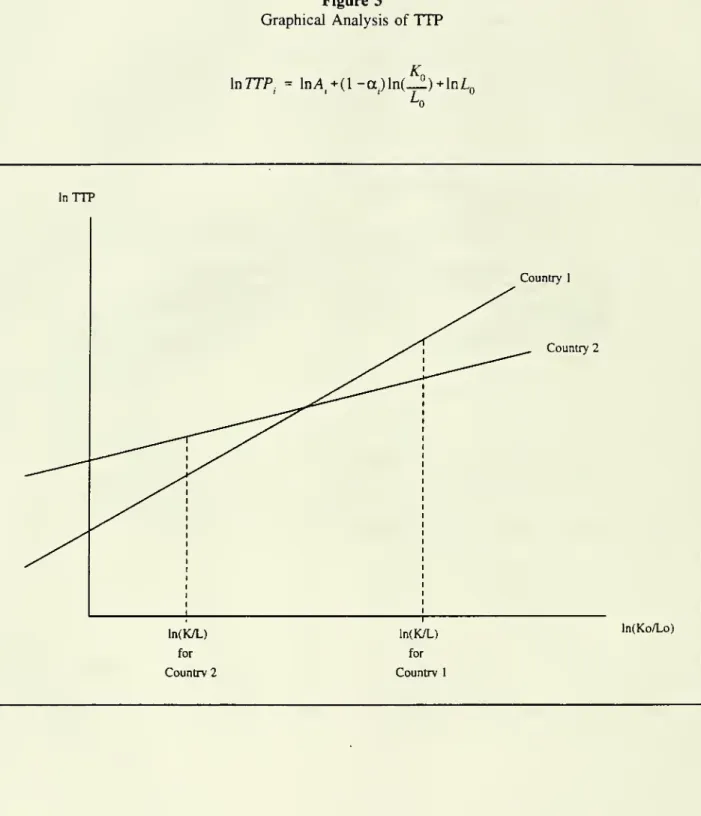
Several issues concerning Total Technological Productivity
remain
to be discussed. First,comparisons
ofTTP
may
be sensitive to the capital-labor ratioKol
Lo, as is obviousfrom
Equation
2.4. Iftwo
countrieshave
different capital-labor ratios theTTP
measure
may
change
rankdepending on which
capital-labor ratiois chosen. This isshown
graphically inFigure 3.
This aspect ofthe
TTP
measure
is unfortunate. Ideally,we
would
likea
singleanswer
to the question, "In the aggregate,
which
country ismore
productive, the U.S. orJapan?"
However,
theanswer
may
depend
onwhether
we
use the U.S. capital-labor ratio or theJapanese
capital-labor ratio. This is analogous to the classic indexnumber
problem.Sup-pose
we
wishtocompare
the totaloutput oftwo economies
thatproduce
different quantitiesofapples
and
oranges.Depending on
the relative price used to weight applesand
oranges,one
countrymay
appear
to bemore
productivethan
the other.^°Several other candidate
measures
of multi-factor productivity also share this problem. Forexample,
one
canimagine
constructing aTFP
measure by
converting labor units into dollars tomake
themeasured
labor inputcomparable
to capitaland
labor.However,
the choice of the realwage
used in the conversion can alter the productivity rankings. Itcan be
shown
that this choice is analogous to choosing a capital-labor ratio since thetwo
are related
under
cost minimization.By
focusing onlyon
the '"A"term
in the productionfunction, this
measure
can alsoprovide misleadingresults.Once
again, countries(orsectors)with identical
K,
L,and
A
terms canhave
differing outputs as a result of different factorexponents.
A
comparison
ofthe"A"
terms would
not capturethis productivity differential.Alternatively,
one
could return to the "naive"measure
ofTFP
basedon
constant factorexponents
across countriesand
time. Thismeasure
now
seems
less naive because it is the onlyTFP
measure
that iscomparable
across countriesand
time.However,
the choice of the factorexponent
still remains,and
the rankings of the productivity levelswiU
typically besensitive to this decision. Moreover, this
measure
has thedrawback
ofignoring convergencethat results
from
intertemporalmovement
in the factor exponents.That
is, it looks at onlyone
ofthetwo
dimensions alongwhich
factorproductivity varies. Despite thesedrawbacks,
we
will report results basedon
the Hicks-neutralmeasure
ofTFP
for comparison.There
does notseem
tobe an
easyway
around
the choice of the appropriatecapital-labor ratio. In the
remainder
of the paper,we
proceedby
evaluatingTTP
at themedian
capital-labor ratiofor the initial year in the
sample and
thenexamine
robustness.^^2.4.
Comparing
TFP
and
TTP
Our
proposed
method
forcomparing
productivitylevels isTTP
whose
construction requiresa
measure
oftotalfactor productivity(TFP),
factor shares,and
capitaland
labor data.To
construct
TTP
levels in practice for 1970-87,we
applyEquation
2.4 to calculate the level in 1970and
generate levels for the subsequent yearsby cumulating
the Divisia multi-factorproductivity
growth
rates.The
1970 level is used as an initial value.^^Figure 1
compared
labor productivityand
theconstant-ameasure
ofTFP
basedon
con-stant factor shares across timeand
countries,and
the resultswere
fairly similar.However,
'°Wethank John Taylorfor pointing this out to us.
''The results are robust to this choice. Choosing the lowest capital-labor ratio causes convergence for
total industry andagriculture to weaken.
'^As an alternative, wealsoused
TTP
levelscalculated ateachpointintime using theTTP
formula. Thefactor shares vary across time
and
countries, aswas
shown
earlier. Therefore, this simpleTFP
measure
may
distort productivity comparisons. Figure 4 plots aTTP
measure
as well asa
TFP
measure
constructed using q's that vary across country, i.e. ameasure
that issubject to the
problems
discussed above.The
differencesbetween
thetwo
measures
are readily apparent.The
cross country standard deviation for the varyinga
version ofTFP
shows
episodesofsome
convergenceand
divergenceleaving the overall dispersion essentiallyunchanged.
In addition, the relative ranks ofcountries are dramatically different, with theU.S. in the
middle
of the 14 countrygroup
and Japan
near thebottom.
In contrast,TTP
is well-behaved
and
consistent with thedata on
labor productivity.TTP
for total industryexhibits substantial
convergence
over the period 1970-1987, as is obviousfrom both
partsof the figure.
3.
A
Basic
Model
of
Productivity
Convergence
The
neoclassicalgrowth
model
without technology predicts convergence inoutput
perworker
for similar, closedeconomies
basedon
theaccumulation
of capital.However, even
in the neoclassical
model,
if theexogenous
technology processes follow different long-run paths across countries, then therewill beno tendency
foroutput
levels to converge.To
seethis
we
construct a simplemodel
ofproductivity catch-up.We
abstractfrom
issues of multi-factor productivitymeasurement
and assume
that multi-factor productivity, Pa, evolves according toInP.t
=
7ij+
AlnAt+lnP.t-i
+lne.t (3.1)with 7,j being the
asymptotic
rate ofgrowth
of sector j incountry
i, \ parameterizingthe speed of catch-up
denoted by
Da,
and
e,t representingan
industryand
country-specificproductivity shock.
We
allowDa,
thecatch-upvariable,tobe
a functionof theproductivitydifferentialwithin sector jin country i
from
that incountry 1, themost
productive country.lnA(
=
-InP.t-i
(3.2)where
a hat indicatesa
ratio of a variable in country i to thesame
variable incountry
1, i.e.Pu
=
^.
(3.3)This
formulationofproductivity catch-up impliesthat productivity gapsbetween
coun-tries are
a
function of the laggedgap
in thesame
productivity measure. Forexample,
if
TTP
is themeasure
of productivity, then laggedgaps
inTTP
determine
the degree ofcatch-up.
This
simple diffusion process is subject to criticism.Dowrick
and
Nguyen
(1989) allow the catch-upinTTP
tobe determined by
labor productivitydifferentials; however, itseems
appropriate tosuppose
that technological catch-upmay
be
occurringindependent
of capital deepening.This
formulation ofoutput
leads toa
naturalpath
for productivity:In this
framework,
values ofA>0
provide animpetus
for "catch-up": productivitydiffer-entials
between two
countries increase the relativegrowth
rate of the country with lowerproductivity.
However,
only ifA>0
and
if 7,=
71 (i.e. if the asymptoticgrowth
rates ofproductivity are the
same)
will countries exhibit a tendency to converge. Alternatively, if A=
0, productivity levels willgrow
at diiferent ratespermanently
and
show
no tendency
to converge asymptotically.^'^ Considering the relationship
between
long-rungrowth
rates across countries,we
can rewrite the difference equation in 3.4 to yieldPi
=
--(^-(^-^n,
6
1^
InAo
+
^7;E
(1- ^f~'
(7.-
71+
Ini,j ) (3.5)^
^
j=0where
p, denotes the averagegrowth
rate relative to country 1between
timeand
timeT.^'* This is the familiar regression of long-run average
growth
rateson
the initial level,where
catch-up isdenoted
by
a negative coefficienton
the level.^^This simple set-up for analyzing productivity
movements
across countriesis convenient because the regression specificationis notdependent on
theform
oftheproductionfunction.4.
Convergence
inIndustry Productivity
In this section
we
present cross-section convergenceresults forlabor productivity, a "naive"measure
ofTFP,
and
ourproposed
measure
ofTTP
for six sectors for 14 countries.We
describe thedata
set before looking at thechanging
compositionofoutput
across countries.Results for /^-convergence
and
cr-convergence foUow. Finally,we
review previous empiricalwork
on
industry productivityand
convergence.4.1.
Data
The
empiricalwork
for thispaper
employs
data for six sectorsand
total industry for (amaximum
of)fourteenOECD
countriesovertheperiod 1970to 1987.The
fourteen countries are Australia. Belgium,Canada,
Denmark,
Finland, France, Italy, Japan, Netherlands,Norway, Sweden,
U.K., U.S.,and
West Germany.
The
six sectors are agriculture, mining, manufacturing, electricity/gas/water(EGW),
construction,and
services.The
basicdata
source is
an updated
version of theOECD
IntersectoralDatabase (ISDB),
constructedby
Meyer-zu-Schlochtern (1988).^^'^Ofcourse, if the country with the lower initial level has a higher 7,, the countries
may
appear to beconvergingin small samples- thiscaseis extremely difficult to rule outin practice.
'*An alternative testing approach, employed in Bernard and Jones (1993), is to estimate Equation 3.4
directly. IfA
>
0, then the difference betweenthe technology levels in the twocountries will be stationary. Ifthereisnocatch-up (A=
0), then the difference ofTFP
in countryifrom thatin country 1 willcontain aunit root. Thedriftterm 7i-7i willtypicallybe small but nonzeroifthe countries'technologiesaredrivenby
differentprocesses(i.e. underthehypothesisofnoconvergence). Underthehypothesisofconvergence,7,
=
71is plausible.
'^Forpotential problems with this typeofregression,see Bernard and Durlauf(1993).
'^With the exception ofthe services aggregate, all the other sectors are taken directly from the ISDB.
The services aggregate is constructed by summing Retail Trade, Transportation/Communication, F.I.R.E.,
and Other Services. GovernmentServices areexcluded. Ourmeasureofaggregate outputalso excludes the
governmentsector.
The ISDB
database containsdata
on
GDP,
totalemployment,
number
of employees,capital stock,
and
thewage
bill.AU
of the currencydenominated
variables are in 1980dollars,
having been
convertedby
theOECD
usingpurchasingpower
parities.We
constructour labor productivity
and
multi-factor productivitymeasures
using these variables. In particular, sincewe
do
nothave
hours data,we
measure
laborby
totalemployment.
We
measure
labor productivity as the log of value-added per worker. Sincewe must
obtain levelsof multi-factor productivity to
conduct
our convergence analysis,we
construct ameasure
of the log of total factor productivity(TFP),
designated A,t. Thismeasure
is constructedinastandard way,as aweighted
averageof capitaland
labor productivity,where
the weights are the factor shares calculated
assuming
perfect competitionand
constantreturns to scale. In order to be able to
make
cross-country comparisons,we
restrict our labor share tobe
sector-specific, i.e. it is calculated asan
average overtimeand
country foreach
sector.^^ Finally,we
constructdata
on
TTP
by
applying theformula
in equation 2.4,evaluated at the
median
capital-labor ratioforeachsectorin 1970.Whatever
themeasure
ofproductivitylevels
we
employ,we
continue to use the Divisiagrowth
rates,and
subsequent productivity levels are calculatedby cumulating
thegrowth
rates using the initial level topin the series
down.
To
summarize
the data.Table
6.1 reports averageannual
labor productivityand
Divisiagrowth
ratesby
countryand
sector for the period 1970 to 1987.^* Similarly, Figures 5and
6 plot the log of labor productivity
and
TTP
respectivelyby
sector for each country.^^The
table
shows
substantial heterogeneity ingrowth
rates acrossboth
industriesand
countries.Average
sectoralgrowth
rates of labor productivity varyfrom 4.0%
per year inmining
to0.9%
in construction.The
Divisiagrowth
ratesshow
similar variation with agricultureex-periencing the fastest multi-factorproductivity growth, 3.0%,
and mining and
constructionactually
showing
negativegrowth
over the period.Within
sectors, thereis alsosubstantiallydifferent
growth
experiences.Manufacturing growth
inlabor productivity variesfrom
a highof
5.9%
inJapan
toa low
of1.7%
inNorway.
MFP
growth
inmanufacturing was
highest inBelgium,
3.5%
per year,and
lowest again inNorway, 0.7%
per year.Labor
productivity inservices, the largest sector in these economies,
grew
ata
2.8%
rate inJapan
and
only0.6%
in Italy.
For every sector, average labor productivity
growth was
fasterthan
MFP
growth
sug-gesting a continuingrole for capital
accumulation
in changes in labor productivityeven
forthese developed
economies
over the 1970'sand
1980's.The
differencewas
most dramatic
in
mining which
had
the fastest labor productivitygrowth
but the lowest,even
negative, multi-factor productivity growth.The
differencesbetween
labor productivityand
multi-factor productivitywas
smallest in services.As
a
checkon
the validity of thesenumbers,
we
cancompare
thegrowth
rates forproductivity in the U.S. to productivity
growth
rates calculatedby
theBureau
ofLabor
Statistics (1991), as
shown
in the following table:^°''We relax this assumption later.
'*For a fewsectors, 1986is taken as the endpoint because ofdata avaUability.
'^The
TFP
figures look verysimilar.^°The
BLS
usedataon labor hours as opposed to the total employment measureused by the ISDB.Y/L
MFP
Total Ind.
Manufac.
Total Ind.Manufac.
BLS
ISDB
1.5%
0.6%
2.8%
2.6%
0.8%
0.2%
2.2%
1.8%
The
growth
rates forthemanufacturing
sectoragreenicely, while thosefor totalindustryare
somewhat
different.Because
the keyfindings in thispaper
focuson
themanufacturing
sector, the slightly
anomalous
results for the total industrymeasure
is less disconcerting.Looking
at the labor productivityand
TTP
levelsby
sector in Figures 5and
6,we
can see several
immediate
differencesfrom
the aggregatemovements shown
earlier. Sectorsdo
notshow
thesame
patterns in either trend or dispersion over time. Neither laborproductivity nor
MFP
show
much
change
in dispersion formanufacturing, while in services,both measures
display anarrowing
of thegap
between
the highest productivity countryand
the lowest.The
figures also bear out the substantial heterogeneity of productivityperformances
across sectors.One
perhaps
puzzling feature of the figures concernsJapanese
productivity in theser-vices sector.
According
to the labor productivity measure,Japanese
productivity in theservice sector in 1970
was
at thebottom
ofthe sample, while theTTP
measure
(and theTFP
measure, although this is not reported) placeJapan
right at the top.As
acompari-son, Baily (1993) cites
numbers
from
theMcKinsey
Global Institute that suggest that totalfactor productivity in
Japanese
generalmerchandise
retailingwas
only55%
of that of theU.S. as of 1987,
which
suggests thatmeasurement
errormay
plague theservice sector data.Once
again, however,as longas themanufacturing data
areaccurate, the key resultsofthispaper
hold up.4.2.
Industry Shares
inGDP
To
help usfocuson
the sources ofconvergencein totalindustry productivitywe
firstexamine
the share of sectors in
GDP.
Even
if there is convergence within sectors, aggregate conver-gencemay
not occur. Forexample, ifoutput shares of industriesvary across countries, then once all sectorshave
converged to theirsector-specific long-run productivitylevelsthere willstill be differences in aggregate productivity levels across countries.
Convergence
inoutput
shares together with sector-specific convergence is sufficient for aggregate convergence. In
this section,
we
examine
the evidenceon
the share ofoutputaccounted
forby each
ofoursix sectors.
Figure 7
shows
the share oftotal industry output (excluding thegovernment)
for each country in the sixbroad
sectors.Both
the leveland change
in shares differs dramatically over time.Within
manufacturing, services, construction,and
agriculture,most
countriesshow
similartrends overtime. Generally, the share ofmanufacturing
is declining(Japan
is a notable exception to this trend), as are the shares ofconstructionand
agriculture. Servicesis the only sector to
show
substantial sharegrowth
formost
countries, accounting for atleast
49%
and
asmuch
as64%
oftotal industry output in 1987.These
figures suggest thatmanufacturing and
services mcikeup
at leasttwo
thirds of totaloutput
in every countrythroughout
the period.^^^To test whether these countries are becoming more similar inoutput composition, broadlydefined, we
In testing for convergence at the industry level,
we
will concentrateon
the results forthese
two
sectors.4.3.
Cross-Country
Convergence
Distinct definitions of convergence
have emerged
in recent empirical work. Cross-sectionanalyses focus
on
thetendency
of countries with relatively high initial levels ofoutput
per
worker
togrow
relatively slowly (/3-convergence) oron
the reduction in cross-sectionalvarianceof
output
perworker
(^-convergence), as inBarro
and
Sala-i-Martin (1991, 1992).This idea of
convergence
as catching-up is linked to the predictedoutput
pathsfrom
aneo-classical
growth
model
with different initial levels of capital.Once
countries attain their steady-state levels of capital, there isno
further expected reduction in cross-sectionoutput
variance.Time
series studies define convergenceas identical long-run trends, either deterministic or stochastic. This definitionassumes
that initial conditionsdo
notmatter
within
sample and
tests for convergence using theframework
ofcointegration.^'^The
model
ofcatch-up in Section 3 implies thatboth
types ofconvergence should holdgiven a long
enough
sample. If the 14OECD
countries areon
their long-run steady stategrowth
paths as of 1970 then the appropriateframework
for testing industry levelconver-gence
is that of cointegration.However,
if technology catch-up is still taking place as of1970 then the cross-section tests are
more
informative. In this paper,we
wiU
focuson
thecross-section analysis of convergence
and examine
/3-convergenceand
cr-convergence.Else-where (Bernard
and
Jones, 1993)we
have
tested for convergence using the sectoraldata
ina
time
seriesframework.
Tables6.2 presents the results
on
/^-convergencefor labor productivity. Foreach
sector,the
growth
rate of productivity is regressedon
its initial level(and a
constant) generatingan
estimate of f3.The
implied speed of converge. A, is then calculated using theformula
from Equation
3.5. In thisframework,
the speed of convergence A can be interpreted asthe rate at
which
the productivity levelis converging tosome
worldwide
productivity level,which
may
itselfbe growing
over time.For labor productivity, the basic convergenceresult for totalindustry
shown
inEquation
1
appears
to hold forsome
sectors but not forothers. Forservices, construction,and
EGW,
a significant negative estimate of /3 is obtained, implying that there has
been
calch-up inlabor productivity during this period.
The
convergencerates for these industries varyfrom
2.46%
per yearinEGW
to2.83%
peryearin services.However, even
withintheseconvergingsectors,thesimpleregressionformulationdifferswidelyinits ability toexplain cross-country
testedfor convergencein thesectoraloutput shares. Only agricultureand constructionshowed anarrowing
of the differences of output shares across countries during the sample. Mining shares diverge, due most
Likelyto dramatic changesin theoUindustry, whUeshares ofmanufacturing,servicesand
EGW
donotshowmuch
chajigein thecross-countrydispersion. Thecross-sectiongrowthrateregressionsconfirmtheseresults.Agricultureandconstruction showconvergencein shares with negative andsignificant coefficientson initial
levels, Services is negative and significant at the
10%
level, and the others have negative coefficients butare insignificcint. These resultson sectoral output shares suggest that whileservices is growing as a share
ofoutput and majiufacturingis decliningin most countries, there remain substantial differences in sectoral
shares across countries. In particular,thereislittletendencyforshares tobecome more simUar, asmeasured
by standard convergencecriteria.
^^For a discussion ofthe theoretical and empirical inconsistenciesassociated with these two measures of
convergencesee Bernard and Durlauf (1993).
growth
rates. In services, the regression accountsfor56%
oftotal cross-countrygrowth
rate variation whileR^
is only 0.19 in the construction sector.Surprisingly, the evidence for convergenceis
weak
inmanufacturing
as thenullhypoth-esis of
no
convergenceis not rejectedeven
at the10%
level.The R^
is correspondingly low. Similar results hold formining
and
agriculture as well.Table 6.3
shows comparable
results for theTFP
measure
of multi-factor productivity.Looking
atTFP, we
find less evidence for convergence withinmanufacturing
as theco-efficient, although still negative, is smaller
and
the f-statistic is lower.The
R'^ for themanufacturing
regression is also smaller at 0.02. Services, once again,shows
convergenceat a rate of
1.34%
per yearand
the simple regression explains56%
of the cross-countryvariation. Agriculture
now
shows
strong evidence of convergence, suggesting that capitalaccumulation
may
even
be offsetting technological convergence. Mining, construction,and
EGW
allshow
broadly similar patterns forTFP
and
labor productivity.Table
6.4 reports our preferred estimates of /3-convergence in multi-factor productivity usingTTP.
We
see resultson
convergence roughly similar to thosefrom
the laborand
TFP
productivitymeasures
used earlier.However, manufacturing
now
shows
even lessconvergence,
both
the leveland
significanceofthe coefficient arereducedand
theR^
isnow
negative. Total industry
TTP
is catching-up at a rate of2.68%
per year. Thiscompares
to apoint estimate for the
manufacturing
sector ofonly0.86%
yearwhich
is insignificantlydifferent
from
zero.Four
sectorsshow
strong evidence of convergence inTTP,
services,agriculture, construction
and
EGW
with negative significant estimates of /3and
high R'^statistics.
To more
clearlyunderstand
themovements
and
convergence of productivity,we now
turn to a
measure
of cr-convergence, the cross-section standard deviation of productivity over time.'^"^ In the graphs, cr-convergenceis indicatedby a
declining standard deviation,reflecting the fact that countries' productivity levels are getting closer together over time.
The
different sectoralcontributions toaggregate laborproductivity can be seenmore
clearlyin Figure 8
which
plots the cross-country sectoral standard deviations of labor productivity over time. Servicesand
EGW
display substantial evidence ofcatch-up, as at is decliningthroughout
the period.The
results formanufacturing
are particularly interesting: duringthe 1970s there is gradual convergence as the standard deviation ofproductivity falls
from
22%
to18%;
however, after 1982 the standard deviation rises sharply for theremainder
ofthe 1980s reaching
more
than
23%
by
1987.Evidence on
theother sectors is less clear-cut,construction
and
agriculture fall initiallyand
then steady,and mining
rises dramaticallyand
then fallsback somewhat.
These
resultsdo
notchange
ifthe U.S. isremoved
from
thesample. In fact, the increase in
manufacturing
TFP
dispersion isaugmented.
Figure 9 plots the cross-country standard deviation in the log of
TTP
for the sixmajor
sectors.^'*
The
results are similar to those for labor productivityand
the /3-convergenceregressions. Services, agriculture,
and
EGW
all exhibit substantial convergence,confirming the regression results. In contrast, productivity in themanufacturing
sectorshows no
convergence
in the 1970sand
diverges during the 1980s.^^Combining the 13- and <T-convergence results allows us to avoid potential problems associated with
Galton's Fallacy.
Quah
(1993) shows that negative coefficients on /? are consistent with a constantcross-section distribution.
^*The resultsfor the
TFP
measureare similar.4.4.
Convergence
within
Manufacturing and
Services
To compare
our results with previouswork
we
also estimate /?-convergence regressions for9 2-digit sub-sectors of
manufacturing
and
4 2-digit sub-sectors of services.^^ Table 6.5presents the results for manufacturing.
Only
4 of the 9manufacturing
industriesshow
evidence of convergence, textiles, chemicals,
non-metaUic
minerals,and
basic metaJs.Ma-chinery
and
equipment,
a sectorwhich
hasbeen
associated withgrowth
in recent work,shows
little evidence of convergence in TTP.'^^ This suggests that the lack of convergencefor
manufacturing
as awhole
extends to individual industries as well.The
convergence
regressions for services areshown
in Table 6.6.Once
again thegeneralfinding of
convergence
in servicesisborne
outby
negativeand
significant estimates of/3 in3 of the 4 sub-sectors.
Only
the coefficient for Finance, Insuranceand
Real Estate is notsignificant at the
5%
level.The
explanatorypower
ofthe regressions is higher here as well.4.5.
Robustness
of
the
TTP
Results
The
TTP
results of the previous section highlightone
ofthekey
results ofthis paper: theaggregate
convergence
in technological productivity within theOECD
economies
over thelast
two
decades is drivenby
thenon-manufacturing
sectors; within manufacturing,there isvirtually
no
evidence ofconvergenceand
evenweak
evidence for divergence.These
resultsare
based
on
TTP
evaluated at themedian
capital-labor ratio for each sector in 1970. Thisresult does not
appear
to be sensitive to the choice of the capital-labor ratio, however, apoint
we
now
examine
inmore
detail.Instead of presenting additional tables of regression results,
we
demonstrate
the point graphically. Figures 10and
11 plot the log ofTTP
for total industryand
for themanu-facturing sector for a
subsample
of theOECD
economies.Log
ofTTP
is plotted for eachcountry
for 1970and
1986, together with U.S.TTP
in 1970and
1986.The
symbol
'o' inthe figure indicates the U.S. capital-labor ratioforeach year (togetherwith the
min
and
themax
for each sector), while thesymbol
'x" does thesame
thing for anotherOECD
economy.
Figure 10illustrates that the convergenceof
TTP
intotalindustryisrobust tothechoice ofthe capital-labor ratio, at least in these pairwise comparisons.Within
the relevant range (i.e.between
themin
and
ma.x capital-labor ratio for the sector), there are few crossings of theTTP
lines,and
the convergence result appears to apply at virtually every capital-laborratio.
As
an example,
consider the picture for Japan. U.S.TTP
grows
relatively slowlyduring this period, indicated
by
the relatively smaller shiftupward
in theTTP
line forthe U.S.
when
compared
to the shift for Japan. This is true at all (relevant) capital-laborratios, indicating that regardless of the capital-labor ratio chosen,
Japanese
technologicalproductivity
was
catchingup
to U.S. productivity in total industry.Figure 11 illustrates that thelack ofconvergence within
manufacturing
is alsorobust tothe choice of the capital-labor ratio. For
example,
consider the picture forWest Germany.
U.S.
TTP
growth
is clearly fasterthan
West
German
TTP
growth
at all capital-labor ratiosthat are relevant, including the U.S.
and
West
German
capital-labor ratios. Since the U.S. ^^There are often fewer countriesfor the regressions within sub-industriesthus the results must be takenas suggestive.
^®The labor productivity results forthese sectorsshoweven less convergence withsome industries
regis-tering positive coefficients.
is the technological leader here, there is divergence in technological productivity for these
two
countries.Of
the six pairwisecomparisons
in the figure, onlyJapan
(and perhaps
Italy) potentially are converging to the U.S.
TTP
level over this period, ajideven
thisconvergence
appears to be sensitive to the choice of capital-labor ratio (e.g. evaluated atthelargest capital-labor ratio of11.5,
TTP
growth
forthe U.S.isfasterthan
that ofJapan).Overall, the results
from
this section confirm that the empirical results forTTP
docu-mented
earlier are robust to the choice ofthe capital-labor ratio.4.6.
Previous Empirical
Work
on
Sectors
Most
previouswork
on
convergence has concentratedon
aggregate data, looking inpartic-ular at
output
per capita or labor productivity, output per worker.A
notable exceptionto this is
work
by
Dollarand
Wolff (1988),Wolfr (1991),and
especially Dollarand
Wolff (1993)who
consider convergence using industry data.DoUar
and
Wolff (1993) considermany
of thesame
issues addressed in this paper, such as convergence within sectorsand
the differences
between
labor productivityand
TFP.
Largely in opposition to our findings,they conclude that therehas
been
substantial convergenceinmost
sectors,and
in particularwithin
manufacturing
during the period 1963-1985.However,
theyshow
thatmost
ofthe convergence occurred prior to 1973,and
since that timeany
convergence hasbeen
weak
atbest for
most
sectors.Several
important
differences indata
and methodology
existbetween
Dollarand Wolff
(1993)
and
this analysis. First, they usean
early versionoftheOECD
data
setwe
employ,
which
may
contribute to the different findings.A
symptom
oftheproblems
with theirdata
is that Dollar
and
Wolff (1993) findNorway
tobe
themost
productive countryafter 1982, aresult not confirmed
by any
outside source.However,
thedominant
disparitiesbetween
theempirical analyses in that
work
and
those in thispaper
stem from
differences themeasures
of multi-factor productivity.
As
discussed in Section 2, theirprimary
measure
of multi-factor productivity is not robust to a simple choice of units(and
this is trueeven
if the factorexponents
do
not differ across countries or sectors).Stockman
(1988)and CosteUo
(1993)have
alsoexamined
industry-leveldata
forOECD
economies,
although
not in the context ofconvergence.Stockman
(1988)decomposed
thegrowth
rate of industrial production for eightOECD
countriesand
ten two-digitmanufac-turingindustriesinto
a
country-specificcomponent
and an
industry-specificcomponent
(by using the appropriatecombination
of indicator variables).With
this setup,Stockman
re-ports the fraction ofthe varianceof
output growth
that is explainedby
the country-specificcomponent,
the industry-specificcomponent,
and
the covariationbetween
the two. Hisre-sults indicate that the
two
types ofshocks explain roughly thesame
percentageof variationin
output growth.
Costello(1993)follows the
methodology
ofStockman
(1988) butfocuseson
multi-factorproductivity
(MFP)
growth
instccid ofoutput
growth
and examines
five industries in sixcountries. Costello's results areconsistent with thoseof
Stockman
and
suggest the presenceofnationaleffectsthatare atleast as
important
as sectoraleffectsinexplaining thevariation ofMFP
growth.
Costello alsoprovidessome
evidence usingpairwise correlations suggestingthat