HAL Id: inserm-01075584
https://www.hal.inserm.fr/inserm-01075584
Submitted on 18 Oct 2014
HAL is a multi-disciplinary open access
archive for the deposit and dissemination of
sci-entific research documents, whether they are
pub-lished or not. The documents may come from
teaching and research institutions in France or
abroad, or from public or private research centers.
L’archive ouverte pluridisciplinaire HAL, est
destinée au dépôt et à la diffusion de documents
scientifiques de niveau recherche, publiés ou non,
émanant des établissements d’enseignement et de
recherche français ou étrangers, des laboratoires
publics ou privés.
Unbiased recurrence plot quantification of chaotic
dynamic systems by eliminating sojourn points
Amira Zaylaa, Jean-Marc Girault, Jamal Charara
To cite this version:
Amira Zaylaa, Jean-Marc Girault, Jamal Charara. Unbiased recurrence plot quantification of chaotic
dynamic systems by eliminating sojourn points. 2nd International Conference on Advances in
Biomed-ical Engineering, Sep 2013, Tripoli, Lebanon. pp.187 - 190, �10.1109/ICABME.2013.6648879�.
�inserm-01075584�
Unbiased Recurrence Plot Quantification Of Chaotic
Dynamic Systems By Eliminating Sojourn Points
Amira Zaylaa
and Jean-Marc Girault
Imaging and Brain Laboratory, School of Medicine
UMR Inserm U930, Universit´e Franc¸ois-Rabelais de Tours, PRES Centre-Val de Loire Universit´e, Tours, France Email: [email protected],[email protected]
Amira Zaylaa
and Jamal Charara
Signal and Image Laboratory, Faculty of Sciences, Lebanese University, Hadath, Lebanon Email: [email protected], [email protected]
Abstract—Recurrence plots are nonlinear tools used to visual-ize the behavior of trajectories of Dynamic Systems. Occurrence of false points known as ’sojourn points’ have biased recurrence plots. To solve this contentious issue, the use of high embedding dimension was proposed. However it required a lot of computa-tion and was based on the phase space. For that, we proposed in this paper to compare four quantification techniques, by dropping out sojourn points from the recurrence test of time series. Firstly, a recurrence plot and embedding of two were used as reference methods. Secondly, the number of points in the pattern used for testing recurrences was increased and a m-pattern recurrence plot was introduced. Thirdly, a single system’s output and its corresponding derivative were proposed. Numerical inference showed that it was sufficient to work on a single measurement regardless of the degrees of freedom of the considered system and thus the embedding dimension. The proposed techniques succeeded in eliminating sojourn points. They provided a tool for a clean unbiased recurrence plots which permits better analysis of chaotic dynamic systems.
Index Terms—Chaotic systems and signals, Recurrence Plot, m-Pattern Recurrence Plot, Derivative-Based Recurrence Plot, Sojourn points.
I. INTRODUCTION
Recurrence plots (RPs) are popular nonlinear tools for featuring recurring patterns in chaotic systems and signals, thanks to their simple use [1], [2]. Such representation, enables to visualize in 2-Dimension, the recurrences of D-dimensional patterns. This could be achieved by computing a distance norm between two neighbouring points in d-dimensional embedded space, or between d-embedded signals, at two different instants of time. Based on the knowledge of the time-series, merely, two preliminary steps are required to reconstruct the RP: the first is looking the d-dimension of the embedded system out, while the second is looking the time-delay out between d-signals that ensures their independence. The previous steps were well-known as Taken’s theorem [1], [2]. One could wonder if this heavy procedure could be simplified, as the core information is solely present in the time-series. A certain number of researchers investigated the possibility of directly working on the original time-series i.e. ind = 1. However, the simplified assumption have biased the RP representation and its corresponding recurrence quantification analysis (RQA) [3].
This drawback have triggered the presence of false recurrences (or sojourn points) which were, for instance, identified by N. Marwan [3]. The correct analysis of recurrences from time-series is accompanied with sojourn points and is based prob-ably on embedding dimensions [3], [4], [5]. One could won-der about the optimal embedding dimension, which removes sufficiently false recurrences to obtain unbiased recurrence quantification. A question could flush to minds: Are there another methods capable of supplying unbiased quantification? To answer the previous question, we aimed to correctly remove false recurrence points, in order to obtain unbiased RQA. We proposed to compare four techniques, to obtain unbiased recurrence quantification. We worked on RP (with-out embedding) and (RP2) with fixed embedding dimension
(d=2). Then we worked on what we called Derivative-Based Recurrence Plot (RP3) and m-time Pattern Recurrence Plot
(RP4). Through this work, the sine and triangular waves
were considered for illustration. To mimic chaotic biomedical systems we worked on the time-series derived from the logistic map.
The originality of the proposed work lies behind the fact that techniques permitting unbiased quantification of RP, could be investigated regardless of the degrees of freedom of the dynamic system.
II. NONLINEARANALYSISMETHODS
A. Recurrence Plots and Sojourn Points
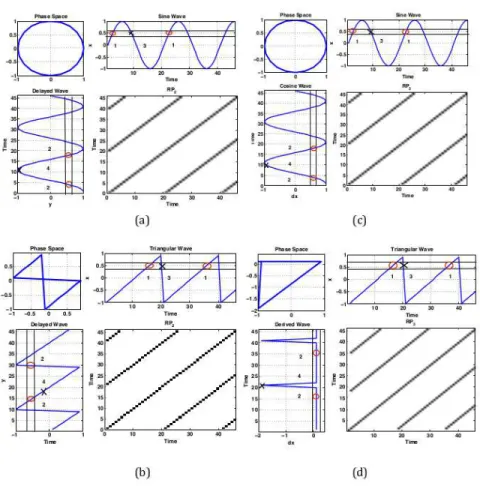
In order to illustrate the recurrence test on a single time series we introduced some simulations and reported them in Fig. 1. Fig. 1 represented a schema of (a) a sine wave, x(t), its time delayed version, y(t) = x(t + T /4), their circular phase space (x(t) versus y(t)), (b) a sine wave, x(t), its derivative, ˙x(t), their circular phase space (x(t) versus ˙x(t) ), (c) a triangular wave x(t), its time delayed version y(t) = x(t + T /4), their eight shaped rotated-square phase space and (d) a triangular wavex(t), its derivative ˙x(t), demi-square phase space.
To vividly understand how the recurrence test works out, recall that RP is a two-dimensional squared matrix with black and white dots and two time-axes, where each black dot at
Fig. 1. Schematic illustration of Phase Space, Recurrence test computation of (a),(b) a sine and triangular waves x(t) and y = x(t + τ ) and (c),(d) a sine and triangular waves x(t) and y= ˙x(t).
the coordinates (i,j) represents a recurrence of the system’s state Xi with another state Yj. It is expressed, for a fixed
embedding dimension d and threshold r, as :
RP= Θ(r − ∥Xi− Yj∥), Xi∈ Rd, (1) where Xi ∈ Rd stands for the point in phase space at which
the system is situated at time i, Θ(·) is the Heaviside function, ∥ · ∥ the L∞ norm and i, j = 1, . . . , N − d + 1.
For any chaotic system with a single observation, one can reconstruct the RP for Yj =Xi+τ based on two parameters,
the time delay ’τ ’ andd. Denote RP by RP1(without
embed-ding).
Fig. 1 (a) pointed out the recurrence of the points denoted 1 and 3 (existing within the same slice). The problem was that 1’s were true recurrences, however, 3 was a sojourn point. To eliminate the number of sojourn points a commonly used technique consisted in increasing the embedding dimension. We shortly denoted this throughout the paper by RP2. The
recurrence test [3], [4], [5] involved in RP2 was computed
with Yj =Xi+τ. To schematize this, RP2 was used in Fig. 1
(a). Within this figure and recalling that point 3 was not a true recurrence, points denoted as 1’s in signalx(t), corresponding to points denoted as 2’s and marked as red circles in the delayed signaly = x(t+τ ), have existed within the slice. But, the point denoted as 3 and marked as a redx(t), corresponded
to a point denoted as 4 in signaly(t). Since this point was not situated within the slice, it was not considered in the test. In this manner, it was vividly evident that 3 was a sojourn point. Note that RP2 in Fig.1 (a) and (b) corresponding to d = 2
withy = x(t + τ ), were similar for two different signals. Instead of finding what was the best time delay τ and em-bedding dimensiond that permit to reconstruct a topologically acceptable phase space and an unbiased RP, another approach discussed in the following section could be used.
B. Derivative-Based Recurrence Plot
The proposed Derivative-Based Recurrence Plots are based on the derivative of time-series. This approach neither requires searching for the time-delay nor embedding dimension. It was denoted by RP3for Yj= ˙Xi. Note that in Fig. 1 (a) and (c), the
following equation:x(t + τ ) = ˙x(t) was verified, whereas, in (b) and (d) was not, i.e.,x(t + τ ) ̸= ˙x(t). In Fig. 1 (c) and (d), points denoted by 1 occurred at the same level in the signal ˙x(t) and possessed the same value, however, point 3 which corresponded to point 4 in signal ˙x(t) occurred at different level. This vividly evidenced that point 3 was a sojourn point and should not be counted in the recurrence test.
Note that, though ˙x(t) of the sine and triangular signals differ, the same quantification process was applicable. In Fig. 1 (c) and (d) the RP3were in general made up of five diagonal
Fig. 2. The cost-function and optimization test of the embedding dimension and time delay.
structures, but as a zoom in, they started at different instants of time, this evidenced that the technique was sensitive to the derivative of the signal solely.
Although this method requires two signals, it is not an embedding process, since the embedding process requires the minimization of the mutual information, while RP3 requires
the minimization of the number of sojourn points. C. m-Pattern Recurrence Plot
Based on the previous method, it was essential to have additional information on the recurrence test. For that, m-Pattern Recurrence Plot was introduced. Instead of considering a point-point recurrence computation, a multi-pattern could be involved, for instance, 2-point to 2 point or 3-point to 3-point computation until m-point-m-point computation. De-noted mathematically by RP4, it was given by Eq. 1 for
Yj=Xj.
III. RESULTS
A. Application To Sine Wave
A sine wave of 200 points has been simulated. Moreover, in RP2, producing unbiased quantification required few primer
computations. To select the optimal values of d and τ , we have solved the optimization problem given by Eq. 2, through minimizing the cost function J(θk).
θ∗
k= arg minθ (J(θk)), (2)
where θk=(dk, τk) was the kth embedding dimension and time
delay to be optimized and J was the number of false recurrence points defined as follows:
J(θk) = %CrossDiagonal =
!N
a=aminaP (a)
N
"
i,j=1
RP (θk)
× 100, (3)
where P(a) was the number of cross-diagonal lines of length a, amin the minimum length of cross-diagonal line [6] and
θk=1 in RP3 and RP4.
Fig. 2 (top) represented the cost function as a function of d, while holding τ fixed to quarter the period, and (bottom) the cost function as a function of the time delay while holding d fixed to 2. As inferred from Fig. 2 (top), the first zero-crossing of J occurred at d = 2. Consequently, d = 2 was used in the
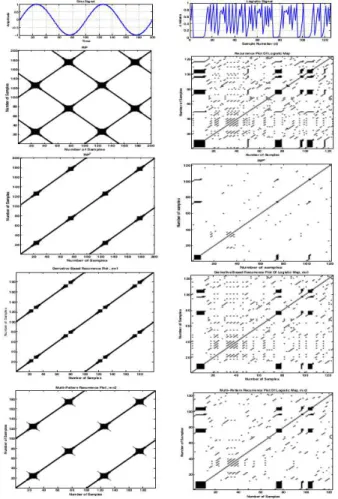
Fig. 3. RP, RP2, RP3and RP4of (left) the simulated sine wave and (right) the Logistic signal.
optimization. Then τ was tested in the range 0 ! τ ! 55. This led to an optimized range rather than a unique value.
Note that the time-delay proposed in Taken’s theorem, was verified in 2 (bottom) to be (τ = T /4) i.e. within the optimal range obtained. The solution of the minimization of the mutual information was a special case of the solution obtained by the minimization of the false recurrence function J. Consequently, it was not necessary to chose another value, i.e. (τ̸= T /4).
After applying the discussed techniques, the results were depicted in Fig.3 (left) as followed: RP1, RP2 for (τ =T/4),
RP3 for m=1 and RP4 for m=2. RP1 in Fig.3 constituted few
diagonal and cross-diagonal lines presenting periodicity. RP2
revealed that the cross-diagonal lines, which were present in the first image, have vanished totally. However, the size of the diamond-shaped patterns have decreased as compared to RP1. RP3manifested how the cross-diagonal lines, which were
present in RP, have totally vanished. However, it showed a drawback which was the loss of the junction points, presence of gaps and a doubling in the number of diamond-shaped patterns. RP4, showed how the cross-diagonal lines have
vanished when increasing the wavelength. Although sojourn points have approximately vanished, few points lying along the cross-diagonal were left intact. This was a sort of a drawback of RP4. As a global visual evidence, sojourn points have been
eliminated using RP2, RP3 and RP4.
B. Application To Logistic Map
As a convention and in order to mimic dynamical biomed-ical systems, the four techniques were applied on the chaotic mathematical system, known as the Logistic Map. The time-series derived from the logistic map was represented by Fig.3 (top right) and defined as:
xn+1= b ∗ xn∗ (1 − xn), (4)
where b was 2.8 and n, the number of points, was 200. Fig.3 (right) represented the RP, RP2 for τ = 4, RP3 for m=1
and finally RP4 for pattern m=2. RP1 of the Logistic
time-series x showed various small diagonal and cross-diagonal lines reflecting the chaotic nature of the simulated system. RP2
revealed that almost all cross-diagonal lines have vanished, still, significant vertical lines and patterns have vanished too. RP3showed how the cross-diagonal lines which were present
in the reference image of the RP have vanished. However, the other small structures remained unchanged. The RP4, revealed
that once the wavelength increased, the cross-diagonal lines vanished, even though, there were non-negligible loss in the vertical information as compared to RP3. So sojourn points
were well-eliminated by means of RP3and RP4of the Logistic
signal.
To quantify the number of sojourn points, DET [7] and J cost-function were calculated. Table I represented the %DET values along the diagonal and J(% Cross-Diagonal) of values in RP1, RP2, RP3 and RP4 of a Sine and logistic signal. For
a sine wave, %DET and J values of RP1 were close. This
was in synchronization with the theory, provided that, RP1
was uniform. However, %DET of RP2, which was 80 %, has
increased as compared to RP1 and J which was 20%, have
decreased. Specifically, 10% out of 50.3% cross-diagonal lines were detected, i.e., 5.0 % of sojourn points remained on the cross-diagonal lines and 90 % were eliminated. Moreover by RP3 , J was 24%, i.e.,12 % out of 50% or 6.0 % of sojourn
points remained and 76% were eliminated. Then J by RP4
was 29%, i.e., 14.5% out of 50.3% remained and 71% were dropped out. RP4was capable of eliminating the sojourn point
5% more than RP3. This evidenced that mathematically the
unbiased RP4
quantification was the most sensitive.
For the logistic signal, from 63% by RP1to 61% by RP2the
number of the points detected along the diagonal decreased, this could be due to some large diagonal lines that were transformed into separate discrete points; this was reflected in the increased number of points detected along the cross-diagonal lines. The trivial comparison of the cross-cross-diagonal values with respect to the detected points forming the cross-diagonal lines obtained through the standard RP1shows that (i)
14.4% out of 37% cross-diagonal points were detected in RP2,
(ii) 13.3% out of 37% cross-diagonal points were detected in RP3, however, in (iii) 13% out of 37% cross-diagonal points
were detected in RP4.
Note that RP2 was comparable with RP3. However, the
calculation of RP3and RP4was time-effective and required no
TABLE I
SOJOURN POINT QUANTIFICATION BY%DETANDJOFRP1, RP2, RP3 ANDRP4OF A SINE AND LOGISTIC TIME SERIES.
Dynamic System Sine Wave Logistic Map Determinism (% Number Diagonal Cross- Diagonal Cross-Of Points Remaining On Diagonal (J) Diagonal (J)
RP1 49.7% 50.3% 63% 37%
RP2 39.8% 5.0% 38.4% 5.3%
RP3 37.8% 6.0% 40.3% 4.9%
RP4 35.8% 7.3% 40.5% 4.8%
a prior information. They were directly manipulated from the time series, being in this work either the sine signal (or triangu-lar signal) and the Logistic signal. As an overall, they did not drop out vertical or diagonal information as RP2. Moreover,
even though RP3 was advantageous over RP4 in eliminating
sojourn points, some true recurring points (junction points) were lost. This offsets that the technique had overestimated the quantification of sojourn points. Nevertheless, RP4 was
advantageous over RP3 in the sense that all the diagonal
information were preserved, anyhow, most of the sojourn points were eliminated. As well as RP4 was better than RP2,
such that no constraints were implicated, it preserved the size of junctions. There was always a compromise between the small cross-diagonal lines and junction points.
IV. CONCLUSIONS
It was possible throughout this work to establish unbiased quantification by eliminating sojourn points. These unbiased quantifications, have provided a tool for a clean RP which permits better analysis of chaotic dynamic systems. As a future prospect, we ought to validate the findings on real biomedical signals.
ACKNOWLEDGEMENTS
The authors are grateful to the Lebanese University and National Council for Scientific Research in Lebanon for sup-porting this work.
REFERENCES
[1] F. Takens, “Dynamical Systems and Turbulence,” Lecture notes in mathematics, Springer, 898, pp. 366–381, 1981.
[2] J. P. Eckmann, S. O. Kamphorst, and D. Ruelle, “Recurrence plots of dynamical system,” Europhys. Lett, vol. 4, pp. 973–977, 1987. [3] N. Marwan, N. Wessel, U. Meyerfeldt, A. Schirdewan, and J. Kurths,
“Recurrence-plot-based measures of complexity and their application to heart-rate-variability data,” Phys. Rev. E APS, vol. 66, no. 2, 026702, 2002.
[4] J. P. Zbilut, A. Giuliani, C. L. Webber Jr. and D. Ruelle, “Detecting De-terministic Signals In Exceptionally Noisy Environments Using Cross-Recurrence Quantification,” Europhys. Lett A, no. 246, pp. 122–128, 1998.
[5] N.H. Packed and J. P. Crutchfield, J.D. Farmer, R.S. Shaw, “Geometry from a time series,” Phys. Rev. Lett. 45, vol. 246, no. (1-2), pp. 122–128, 1998.
[6] C. D. Nguyen, J. S. Wilson and S. Crozier, “Automated Quantification of the Synchrogram by Recurrence Plot Analysis,” in IEEE Trans Biomed Eng, School of Information Technology and Electrical Engineering, vol. 59, pp. 946-955, 2012.
[7] J. Gao and H. Cai,“On the structures and quantification of recurrence plots.,” in Physics Letters A, vol. 270, pp. 1563–1572, 2000.