SCIENTIFIC ARTICLE
Comparison of pre-operative dGEMRIC imaging
with intra-operative findings in femoroacetabular
impingement: preliminary findings
Bernd Bittersohl&Harish S. Hosalkar&
Sebastian Apprich&Stefan A. Werlen&
Klaus A. Siebenrock&Tallal Charles Mamisch
Received: 13 May 2010 / Revised: 8 August 2010 / Accepted: 19 September 2010 / Published online: 13 October 2010 # ISS 2010
Abstract
Objectives To study standard MRI and dGEMRIC in patients with symptomatic FAI undergoing surgical inter-vention and compare them with intra-operative findings to see if they were corroborative.
Methods Sixteen patients with symptomatic FAI that warranted surgical intervention were prospectively studied. All patients underwent plain radiographic series for FAI assessment followed by standard MRI and dGEMRIC. Subsequently, patients were surgically treated with safe dislocation and the joint was evaluated for any macroscopic signs of damaged cartilage. Data were statistically analyzed. Results A total of 224 zones in 16 patients were evaluated. One hundred and sixteen zones were intra-operatively rated as normal with mean T1 values of 510.1 ms±141.2 ms. Eighty zones had evidence of damage with mean T1 values of 453.1 ms ±113.6 ms. The difference in these T1 values was significant (p=0.003). Correlation between standard MRI and intra-operative findings was moderate (r=0.535, p<0.001). Intra-operative findings revealed more damage than standard MRI. On standard MRI, 68.6% zones were graded normal while 31.4% had evidence of damage. On
intra-operative visualization, 56.4% zones were graded normal and 43.6% had evidence of damage. Correlation between dGEMRIC and intra-operative findings turned out to be weak (r=0.114, p<0.126). On T1 assessment 31.4% of zones were graded as normal and 68.6% as damaged. Conclusions dGEMRIC was significantly different between normal and affected cartilage based on intra-operative assessment. The correlation for morphological findings was limited, underestimating defects. By combining morphological with biochemical assessment dGEMRIC may play some role in the future to prognosticate outcomes and facilitate surgical planning and intervention.
Keywords MRI . Hip . Cartilage . FAI . dGEMRIC . Surgery
Introduction
Femoroacetabular impingement (FAI) results from an impaction between the proximal femur and the acetabular rim that is induced by an abnormal morphology of the femoral head–neck region (cam-FAI), the acetabulum (pincer-FAI) or both (mixed-FAI). Mixed-FAI type is the most common form. Cam-FAI results from a non-spherical shape of the femoral head that may be combined with poor head–neck offset. While entering the hip joint during flexion and internal rotation, the femoral head–neck junction abuts anterior–superior in the acetabular rim causing labral damage, cartilage shearing, and separation among cartilage, the labrum, and the subchondral bone. Pincer-FAI occurs due to acetabular over-coverage or improper configuration and shape of the acetabulum.
Untreated symptomatic FAI is a risk factor for the development of premature osteoarthritis (OA) in the hip
B. Bittersohl
:
S. Apprich:
K. A. Siebenrock:
T. C. Mamisch (*) Department of Orthopedic Surgery, University of Bern, Inselspital,3010 Bern, Switzerland
e-mail: [email protected] H. S. Hosalkar
Department of Orthopedic Surgery, Children’s Hospital, San Diego, CA, USA
S. A. Werlen
Department of Radiology, Sonnenhof Hospital, Bern, Switzerland
[1–3]. Multiple reports have shown good outcomes following early surgical intervention in patients with pre-existing mild-changes of OA, but poor results in patients with advanced degenerative changes [2, 4, 5]. Therefore, it is understandably critical for the treating clinician to be able to detect cartilage changes of damage and degeneration not only in detail, but also at an early stage to maximize patient benefit.
Currently, routine magnetic resonance imaging (MRI) and/or MR arthrography, which use intra-articular injected contrast medium gadolinium for better depiction of labral and cartilage defects, remain the imaging techniques of choice [6]. MR arthrography has been proved to be superior to routine MRI, for accurate and reliable diagnosis of labral pathologies [7–10]. Despite these advantages the ability of MR arthrography to detect varying grades of cartilage damage is fairly limited. Also, based on the technology of these current techniques, early histological and biochemical changes at the beginning of OA cannot be detected.
The MRI technique of delayed gadolinium-enhanced MRI of cartilage (dGEMRIC) is a histologically validated [11, 12] and well-documented [13–24] method that is sensitive to the charge density of cartilage contributed by glycosaminoglycans (GAGs) [25,26]. GAGs are important structural components of cartilage and relevant to main-taining the intrinsic mechanical properties that are lost early in the process of OA [27, 28]. The dGEMRIC technique utilizes the anionic, negatively charged contrast agent gadolinium-diethylene triamine penta-acetic acid (Gd-DTPA2−), which is also used as standard contrast agent for MR arthrography in the daily clinical set-up. Gd-DTPA2− distributes within cartilage inversely to the negatively charged GAG content. Thus, the Gd-DTPA2−concentration will be low in normal cartilage in contrast to the relatively high concentration of Gd-DTPA2−, which accumulates in degenerated cartilage due to the decreased GAG. Gd-DTPA2− shortens the T1 relaxation time. Thereby, subse-quent T1 measurement described as the dGEMRIC index or T1Gd reflects the GAG content within a certain cartilage region [14]. Recently, fast T1 assessment utilizing dual flip angle (FA) gradient echo (GRE) in place of standard inversion recovery (IR) for T1 mapping has been validated in phantom studies and was used in vivo, enabling faster imaging times and three-dimensional (3D) T1 mapping [22,
29–31].
Thus, the dGEMRIC technique has the potential to detect early cartilage damage, which in turn is very helpful to clinicians for decision-making regarding timely inter-vention. To the best of our knowledge there are no reported studies in the literature that have compared the pre-operative imaging findings of MRI using dGEMRIC for symptomatic FAI patients, with the subsequent
intra-operative findings in the same cohort following safe surgical dislocation. The purpose of this present study was to prospectively study the standard MRI (morphological imaging) and dGEMRIC (biochemical imaging) findings in patients with symptomatic FAI undergoing surgical inter-vention and compare them with intra-operative findings to see if they were corroborative.
Materials and methods
Study population
Fifty consecutive patients with a diagnosis of FAI by history, clinical examination and X-ray underwent contrast MRI with additional dGEMRIC for this prospective study. The dGEMRIC index was compared in a preliminary study with the X-ray and MRI measurements [31]. Sixteen of these patients had surgery within 3 months and were included in this study. The mean time gap between imaging and surgery was 60.3 days±13.9 days (range 47 days to 90 days).
There were 8 female and 8 male patients. Mean age ± SD was 31±11.3 years (range 17 to 57 years). Twelve hips involved the right side and 4 involved the left side. The degree of arthritis in 11 cases (68.8%) was Tonnis grade 0 and in 4 cases Tonnis grade 1 (25.0%). The mean Merle D’Aubigné scores were 15.4±1.4 with a range of 13–17. Exclusion criteria such as any other hip pathology, previous hip surgery, advanced OA (Tonnis grade above 1), risks or contraindications for MRI including risks for Gd-DTPA2− administration such as compromised renal function and allergies to contrast agent were ruled out. Potential side effects were clarified to the patients and their written informed consent obtained before the study was initiated. Patients in whom there was a time gap between the MRI and surgical intervention of more than 3 months were excluded. Thus, any possible dynamic and progressive effects of cartilage damage were minimized. The study was approved by the local ethics committee and written informed consent was given by each participant.
MRI and dGEMRIC
Magnetic resonance imaging was performed using a 1.5-T system (Magnetom Avanto; Siemens, Erlangen, Germany) and a body matrix-phased array coil, following 45 min after contrast administration (0.4 ml/kg Gd-DTPA2−, Magnevist®; BayerSchering AG, Germany) and 15 min of exercise before the start of the standard MR protocol to reach appropriate gadolinium infiltration [29, 31]. The coil was placed to examine each hip, ensuring that the device was accurately centered on top of the joint. The MRI protocol included the
standard hip protocol and additionally a sequence for 3D T1 mapping:
1. Axial 2D turbo spin echo (TSE) with T1-weighting (repetition time (TR)/echo time (TE)=491 ms/13 ms, 3-mm slice thickness, 160-3-mm field of view (FOV), 512×256 matrix, acquisition time (TA) =4.14 min) 2. Coronal oblique 2D TSE with proton-density
(PD)-weighting (TR/TE = 3,060 ms/9.1 ms, 2-mm slice thickness, 130-mm FOV, 256 × 205 matrix, TA= 5.35 min)
3. Sagittal 2D TSE with PD-weighting (TR/TE = 2,900 ms/9.1 ms, 2-mm slice thickness, 130-mm FOV, 256×205 matrix, TA=5.35 min),
4. Axial 2D fast low angle shot (FLASH) with T1-weighting (TR/TE=250 ms/12 ms, 2-mm slice thick-ness, 120-mm FOV, 256×205 matrix, TA=3.52 min) 5. Radial 2D TSE with PD-weighting around the
femoral neck and perpendicular to the acetabular rim (TR/TE = 1,800 ms/13 ms, 4-mm slice thickness, 180-mm FOV, 512 × 256 matrix, TA= 4.30 min), and for T1-mapping
6. Dual FA 3D GRE volumetric interpolated breath-hold examination (VIBE) utilizing inline T1 measurement (TR/TE/FA=25 ms/3.6 ms/10° and 35°, 0.78-mm slice thickness, 200-mm FOV, 256×256 matrix, voxel size= 0.78 mm3(isotropic), slab=96, TA=8.46 min)
The complete examination, including contrast agent administration, standard MRI, and dual FA 3D GRE for T1 mapping, lasted approximately 90 min.
Standard MRI analysis
Radial 2D TSE PD-weighted images around the femoral head were utilized to evaluate the presence of cartilage damage and were: anterior, anterior–superior, superior– anterior, superior, superior–posterior, posterior–superior, and posterior (the former = main direction). Within each radial image, cartilage was assessed in two zones: at the acetabular rim and centrally, close to the fovea, which included femoral and acetabular cartilage as one entity. Based on the observations, cartilage was graded as normal or damaged (surface irregularity, signal alter-ation, and tissue aberration) for each zone (central and peripheral).
T1Gd analysis
Analysis was performed by an experienced musculoskeletal radiologist who was blinded to patient findings and intra-operative results. For T1 analysis (T1Gd, dGEMRIC index),
the 3D data sets (morphological dual FA VIBE slab and resulting T1 maps) were transferred to a Leonardo®
workstation (Siemens, Erlangen, Germany). Seven radial reformats concentric within the femoral head center, 30° apart and perpendicular to the femoral neck were created by using multi-planar reconstruction (MPR) software. Thus, radial T1 maps were: anterior, anterior–superior, superior– anterior, superior, superior–posterior, posterior—superior, and posterior (the former = main direction) resulted in further topographic T1Gd measurement and comparison
with standard MRI and intra-operative findings. Within each radial T1 map, T1Gdwas assessed in two zones: at the
acetabular rim and centrally, close to the fovea, which included femoral and acetabular cartilage as one entity. We exercised care in drawing the region of interest (ROI) field within cartilage boundaries while not extending into bone tissue. Therefore, the corresponding morphological VIBE slab was equally processed in order to create seven identical radial reformats that served as anatomical references. Based on the intra-operative observations T1 mapping values were initially divided into two similar groups as normal or damaged.
For translating the T1 values into morphological findings we classified T1 values for peripheral and central zones: normal and below-normal based on the actual value of the T1. We used our own normative data from previously published studies of asymptomatic volunteers [29–31]. Accordingly, based on the mean value of 592.3 ms with a SD of 95.1 ms in the previous asymptomatic volunteer group, T1 values >500 ms were assumed to be normal and T1 values ≤500 ms were regarded as below-normal. Lower values indicated GAG loss due to cartilage degeneration.
Intra-operative analysis
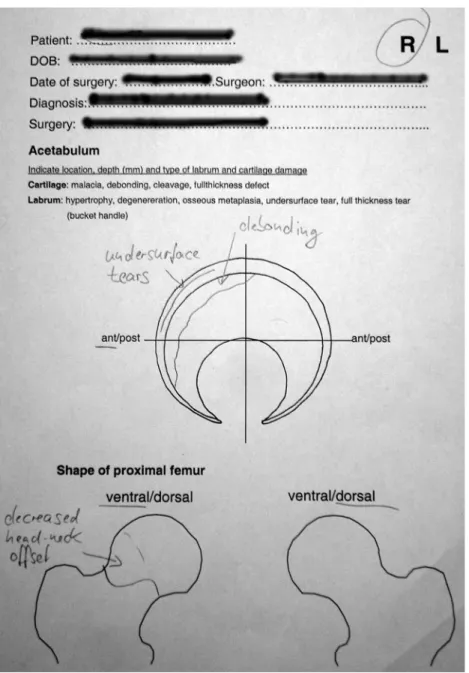
Following safe surgical hip dislocation [32, 33], an approach that allows for examination of the entire joint during surgery, the femoral and acetabular cartilage was evaluated for any signs of damaged cartilage. These findings were documented and classified according to the macroscopic damage and the accurate zonal location clockwise on the same basis as in standard MRI and T1, as normal or damaged. All surgeries and intra-operative evaluations were performed by two senior orthopedic surgeons well trained in these procedures. A standard evaluation sheet (Fig. 1) was used during every case to document the exact size (peripheral and/or central) and nature of damage. Descriptions included surface injury, malacia, debonding, and cleavage [34]. Other findings, such as labrum pathologies, were not considered in this present study. In addition to the classification into normal and damaged, a sub-analysis of the damaged cartilage was performed for malacia versus debonding/cleavage as typical findings in FAI [34].
Statistical analysis
Two hundred and twenty-four zones (112 peripheral and 112 central) were evaluated with advanced imaging including standard MRI, T1-mapping and open intra-operative visualization.
Cartilage lesion frequencies noted with standard MRI and intra-operatively in the respective regions are shown as descriptive data. Corresponding T1Gdvalues are expressed
as mean values and SD. To assess the statistical differences between the T1Gdvalues in cartilage categorized as normal
by standard MRI or by intra-operative inspection and the T1Gdvalues in cartilage categorized as damaged, Student’s
t test (parametric variables, independent samples) [35] was utilized. The comparison between standard MRI findings and dGEMRIC with intra-operative findings was addressed
by the Spearman’s rank correlation coefficient (nonpara-metric measure of correlation) [36]. A p value below 0.05 was considered to be statistically significant. Analysis was performed for each radial section, and for the peripheral and central zones in addition. SPSS software (Version 16.0; SPSS Institute, Chicago, IL, USA) was utilized for all statistical analyses.
Results
T1 dGEMRIC and intra-operative findings
One hundred and sixteen zones were rated as normal based on intra-operative findings. The mean T1 value of the respective zones that correlated to these was 510.1 ms±
Fig. 1 Intra-operative reporting sheet documenting the exact site and nature of damage including surface injury, cartilage malacia, debonding, and cleavage
141.2 ms. Eighty zones were rated as having evidence of cartilage damage on intra-operative inspection. In this group the mean T1 value was 453.1 ms±113.6 ms. There was a statistically significant difference between the T1 values in the cartilage rated normal and those areas that had evidence of damage on intra-operative inspection (p=0.003).
The correlation between dGEMRIC and intra-operative findings was very weak (Kappa correlation was 0.114, p< 0.126) [37]. Based on intra-operative visualization 56.4% zones were graded as normal and 43.6% were graded as damaged (Fig. 2). On the other hand, based on T1 assessment 31.4% of zones were graded as normal and 68.6% were graded as damaged. Details of the results are presented in Table1.
Forty-one of the damaged cartilage zones were classified as malacia, and 39 as delamination (debonding/cleavage). Mean dGEMRIC index of the zones classified as malacia were significant lower (452.72 ms ±108.2) than zones classified as delamination of the cartilage (551.3 ms ± 107.9; p=0.02)
Morphological MRI and intra-operative findings
The correlation between standard MRI observations and intra-operative findings was moderate (Kappa correlation was 0.535, p<0.01) [37]. Based on standard MRI, 68.6% zones were graded as normal, while 31.4% were graded as having evidence of damage (Figs.3,4). On the other hand, based on intra-operative visualization 56.4%, zones were graded as normal and 43.6% were graded as having evidence of damage (Figs. 5, 6). Details of results are presented in Table2.
Peripheral and central findings
Mean dGEMRIC T1 values were non-significantly (p= 0.469) lower in the peripheral area (483.7±138.3 ms) compared with those of the central area (510.4 ±144.6 ms). Specificity for assessment of cartilage intra-operatively assessed as damaged with dGEMRIC was higher in the central zone (76.2%) compared with the peripheral zone (60%). Sensitivity was 37.3% in the central and 49.5% in the peripheral zone.
The correlation between standard MRI observations and dGEMRIC was higher for the central zone (r=0.250, p= 0.008) compared with the peripheral zone (r=0.093, p= 0.330). In the central zone based on standard MRI, 90% of zones were graded as normal, while 10% were graded as having evidence of damage. On the other hand, based on dGEMRIC 51.4% zones were graded as normal and 48.6% were graded as having evidence of damage.
Discussion
Current advances in imaging of cartilage are focused more and more on identifying better methods of delineating the biochemical changes of early cartilage damage. dGEMRIC and T1rho are currently the techniques that hold some promise in this direction. The key role of these techniques is their potential to detect early cartilage damage, which in turn is very helpful to clinicians for decision-making regarding timely intervention. The eventual goal of all pre-surgical imaging is better understanding of the disease process, enhanced communication between the radiologist
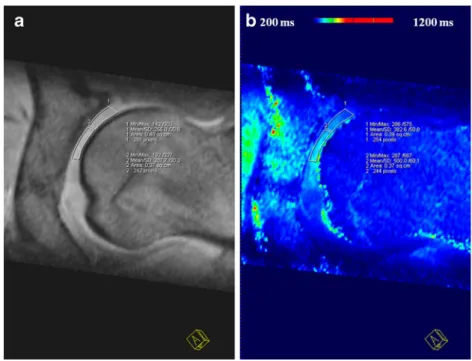
Fig. 2 a Morphological VIBE image and b corresponding T1 map depicting the regions of interest analysis for T1 measurements in the peripheral and central zones. Note that the T1 values are decreased in the peripheral zone (382.6 ms) compared with the central (500 ms)
and the treating clinician, and timely intervention (i.e., surgery when needed) that would help to positively change the outcome of the disease process (in this case FAI).
The purpose of this present study was to prospectively study the standard MRI and dGEMRIC findings in patients with symptomatic FAI undergoing surgical intervention and compare them with intra-operative findings to see if they were corroborative. To the best of our knowledge this is the first study that compares the pre-operative imaging findings of MRI using dGEMRIC for symptomatic FAI patients, with the subsequent intra-operative findings in the same cohort following safe surgical dislocation. It is important to realize that the focus was to identify the obvious morpho-logical damage during intra-operative visualization; there-fore, corroboration of the imaging findings included the extent of topographic damage rather than the degree of biochemical changes.
In our study we found that the correlation between standard MRI observations and intra-operative findings was
moderate in that MRI underestimates intra-operative dam-age of the cartildam-age. Direct surgical (morphological) visualization has also been reported to be better than standard MR imaging in some previous reports [38, 39]. This in some ways may be related to the contrast, resolution, and technique of standard MR imaging, which is likely to miss some areas of cartilage (based on the thickness of the cut and the number of cuts obtained, as well as the averaging involved). Intra-operative visualiza-tion, on the other hand, allows more complete visualization of both the femoral and the acetabular sides of the joint and the macroscopic areas of suspected cartilage damage or areas with direct evidence of damage can be clearly identified.
Knowing what we know regarding the sensitivity of dGEMRIC to pick up early changes of cartilage damage (based on GAG content), it is not surprising that the correlation between dGEMRIC and intra-operative findings was moderate in our studies for a localized comparison of
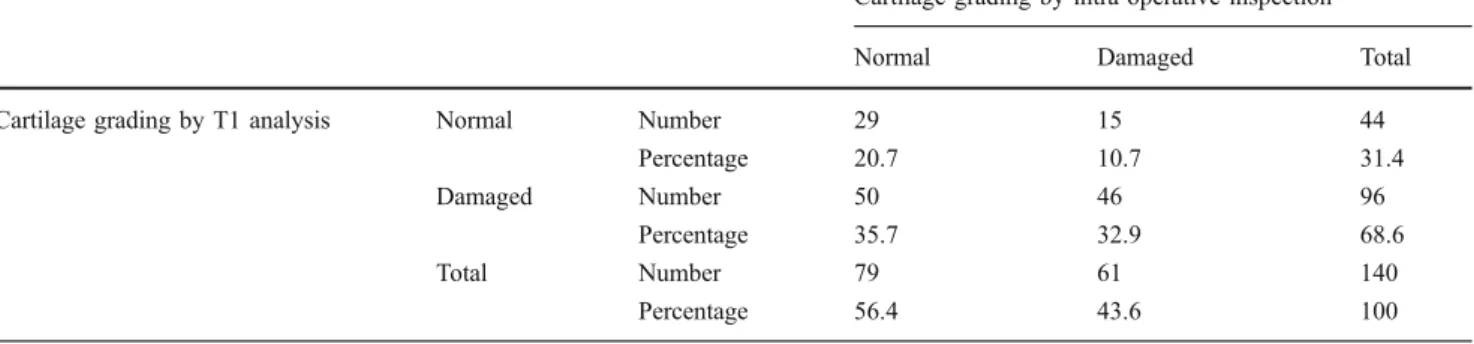
Table 1 The correlation between dGEMRIC and intra-operative findings was very weak (Kappa correlation was 0.114, p<0.126). T1-mapping findings were more sensitive than intra-operative findings in delineating the status of the damaged cartilage. Based on
intra-operative visualization, 56.4% of zones were graded as normal and 43.6% were graded as damaged. Based on T1 assessment, 31.4% of zones were graded as normal and 68.6% were graded as damaged
Cartilage grading by intra-operative inspection
Normal Damaged Total
Cartilage grading by T1 analysis Normal Number 29 15 44
Percentage 20.7 10.7 31.4
Damaged Number 50 46 96
Percentage 35.7 32.9 68.6
Total Number 79 61 140
Percentage 56.4 43.6 100
Fig. 4 Radial 2D TSE PD-weighted image depicting the cartilage damage at the acetabular rim in a cam-type patient in the superior-anterior region (arrow 2)
Fig. 3 Radial 2D TSE PD-weighted image depicting the central femoral head cartilage lesion with cartilage flap formation (arrow 1) in the posterior part
different radial zones through the joint. Although there are no reports on specific timeframes of how and when the biochemical changes of cartilage damage become macro-scopically visible in a hip joint with symptomatic FAI, presumably there is a time lag. This in turn is the likely reason why the surgeon’s visualization of the extent of cartilage damage on intra-operative visualization notably underestimated the ability of dGEMRIC to do the same through the joint at cartilage surrounding the defect.
However, we noted significantly lower T1 dGEMRIC values in affected cartilage compared with normal cartilage in total. This is similar to studies by Bittersohl et al. [31], where decreased T1 values were also found in morpholog-ically affected cartilage in patients with FAI using dGEM-RIC. Within this study, the morphological changes were graded by MR arthrography, which are less sensitive based on our findings. In this context, it is of interest that areas of cartilage delamination showed a wide range of dGEMRIC index with significantly higher values compared with areas
with cartilage malacia. As cartilage delamination is frequent in impingement [6, 37], this could be an additional explanation for the moderate correlation of dGEMRIC index and intra-operative findings. These differences in the dGEMRIC index for delaminated cartilage and the role of the outcome of surgery have to be further explored.
In addition, we assessed zonal differences in the dGEMRIC index from the peripheral to the central area. In the peripheral area, where typically cartilage lesions appear to be more frequent [6, 37], more patients with decreased dGEMRIC index were also found. However, the decrease in dGEMRIC values was less localized compared with the intra-operative assessment of cartilage changes, which were located in the anterior to superior region. Therefore, the correlation with the intra-operative findings was weak compared with the central area, with fewer changes, but more localized. Therefore, dGEMRIC can add sensitivity in the detection of cartilage lesions; however, based on our data it also reflects whole joint being affected
Table 2 The correlation between standard MRI observations and intra-operative findings was moderate (Kappa correlation was 0.535, p<0.001). Intra-operative findings were noted to be more sensitive than standard MRI in delineating the morphological status of damaged
cartilage. Based on standard MRI, 68.6% of zones were graded as normal, while 31.4% were graded as showing evidence of damage. Based on intra-operative visualization, 56.4% of zones were graded as normal and 43.6% were graded as having evidence of damage
Cartilage grading by intra-operative inspection
Normal Damaged Total
Cartilage grading by standard MRI Normal Number 72 24 96
Percentage 51.4 17.1 68.6
Damaged Number 7 37 44
Percentage 5.0 26.4 31.4
Total Number 79 61 140
Percentage 56.4 43.6 100
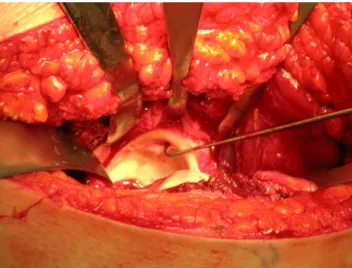
Fig. 6 Intra-operative photograph of the exposed acetabulum follow-ing safe surgical dislocation demonstratfollow-ing full thickness cartilage abrasions
Fig. 5 Intra-operative photograph of the exposed acetabulum follow-ing safe surgical dislocation demonstratfollow-ing the damage to acetabular cartilage and the rim tear consequent to the cam lesion. Note that the location is very classical for a cam lesion (anterior-superior)
because of impingement disease. Further studies have to show how much this changes the impact of the onset or preservation of further degeneration, similar to dGEMRIC data available for hip dysplasia [17].
There are limitations to this study. Our study population was relatively small. Although this was a limitation the prospective nature of the study offers strength to the data; therefore, these findings are preliminary and have to be confirmed in larger trials. One major limitation was the absence of an additional diagnostic gold standard in the form of histological analysis or intra-operative stiffness measurements, which better attempt to classify cartilage structure. In addition, we made no attempt to differentiate between acetabular and femoral cartilage as it was not possible to separate the two cartilage layers at an image resolution obtained with 1.5 T. Therefore, in our study ROI analysis included acetabular and femoral cartilage as one combined entity. In some areas of severe or considerable damage it was difficult to differentiate between joint effusion and cartilage. ROI analysis obtains only mean values that represent the entire encircled area and therefore minor, but remarkable changes may have been possibly underestimated. However, this is the current limitation of the clinical use of dGEMRIC at 1.5 T and therefore the current status for comparison with intra-operative findings. Finally, there may have been some minor subjective variations in reading the intra-operative damage/changes by the surgeons as a part of human error.
In summary, dGEMRIC as a modality of advanced imaging of cartilage damage has the potential to signifi-cantly enhance capabilities in identifying and delineating topographically the areas of cartilage degeneration in hip joints of symptomatic patients with FAI. However, these changes are different to macroscopic changes found within surgery and dGEMRIC does not increase the diagnostic sensitivity of macroscopic changes. Therefore, the value and the role in surgical treatment planning has to be further defined based on outcome.
Conflict of interest The authors declare that there is no conflict of interest.
References
1. Ganz R, Parvizi J, Beck M, Leunig M, Notzli H, Siebenrock KA. Femoroacetabular impingement: a cause for osteoarthritis of the hip. Clin Orthop Relat Res. 2003;(417):112–20.
2. Murphy S, Tannast M, Kim YJ, Buly R, Millis MB. Debridement of the adult hip for femoroacetabular impingement: indications and preliminary clinical results. Clin Orthop Relat Res. 2004; (429):178–81.
3. Wagner S, Hofstetter W, Chiquet M, Mainil-Varlet P, Stauffer E, Ganz R, et al. Early osteoarthritic changes of human femoral head cartilage subsequent to femoro-acetabular impingement. Osteoar-thritis Cartilage. 2003;11:508–18.
4. Beck M, Leunig M, Parvizi J, Boutier V, Wyss D, Ganz R. Anterior femoroacetabular impingement. II. Midterm results of surgical treatment. Clin Orthop Relat Res. 2004;(418):67–73. 5. Spencer S, Millis MB, Kim YJ. Early results of treatment of hip
impingement syndrome in slipped capital femoral epiphysis and pistol grip deformity of the femoral head-neck junction using the surgical dislocation technique. J Pediatr Orthop. 2006;26:281–5. 6. Pfirrmann CW, Mengiardi B, Dora C, Kalberer F, Zanetti M,
Hodler J. Cam and pincer femoroacetabular impingement: characteristic MR arthrographic findings in 50 patients. Radiolo-gy. 2006;240:778–85.
7. Czerny C, Hofmann S, Neuhold A, Tschauner C, Engel A, Recht MP, et al. Lesions of the acetabular labrum: accuracy of MR imaging and MR arthrography in detection and staging. Radiol-ogy. 1996;200:225–30.
8. Locher S, Werlen S, Leunig M, Ganz R. MR-Arthrography with radial sequences for visualization of early hip pathology not visible on plain radiographs. Z Orthop Ihre Grenzgeb. 2002;140:52–7.
9. Petersilge CA. MR arthrography for evaluation of the acetabular labrum. Skeletal Radiol. 2001;30:423–30.
10. Petersilge CA, Haque MA, Petersilge WJ, Lewin JS, Lieberman JM, Buly R. Acetabular labral tears: evaluation with MR arthrography. Radiology. 1996;200:231–5.
11. Bashir A, Gray ML, Hartke J, Burstein D. Nondestructive imaging of human cartilage glycosaminoglycan concentration by MRI. Magn Reson Med. 1999;41:857–65.
12. Nieminen MT, Rieppo J, Silvennoinen J, Toyras J, Hakumaki JM, Hyttinen MM, et al. Spatial assessment of articular cartilage proteoglycans with Gd-DTPA-enhanced T1 imaging. Magn Reson Med. 2002;48:640–8.
13. Bashir A, Gray ML, Boutin RD, Burstein D. Glycosaminoglycan in articular cartilage: in vivo assessment with delayed Gd(DTPA) (2-)-enhanced MR imaging. Radiology. 1997;205:551–8. 14. Burstein D, Velyvis J, Scott KT, Stock KW, Kim YJ, Jaramillo D,
et al. Protocol issues for delayed Gd(DTPA)(2-)-enhanced MRI (dGEMRIC) for clinical evaluation of articular cartilage. Magn Reson Med. 2001;45:36–41.
15. Cunningham T, Jessel R, Zurakowski D, Millis MB, Kim YJ. Delayed gadolinium-enhanced magnetic resonance imaging of cartilage to predict early failure of Bernese periacetabular osteotomy for hip dysplasia. J Bone Joint Surg Am. 2006;88:1540–8. 16. Gillis A, Bashir A, McKeon B, Scheller A, Gray ML, Burstein D.
Magnetic resonance imaging of relative glycosaminoglycan distribution in patients with autologous chondrocyte transplants. Invest Radiol. 2001;36:743–8.
17. Kim YJ, Jaramillo D, Millis MB, Gray ML, Burstein D. Assessment of early osteoarthritis in hip dysplasia with delayed gadolinium-enhanced magnetic resonance imaging of cartilage. J Bone Joint Surg Am. 2003;85-A:1987–92.
18. Kurkijarvi JE, Mattila L, Ojala RO, Vasara AI, Jurvelin JS, Kiviranta I, et al. Evaluation of cartilage repair in the distal femur after autologous chondrocyte transplantation using T2 relaxation time and dGEMRIC. Osteoarthritis Cartilage. 2007;15:372–8. 19. Tiderius CJ, Olsson LE, de Verdier H, Leander P, Ekberg O,
Dahlberg L. Gd-DTPA2)-enhanced MRI of femoral knee carti-lage: a dose-response study in healthy volunteers. Magn Reson Med. 2001;46:1067–71.
20. Tiderius CJ, Olsson LE, Leander P, Ekberg O, Dahlberg L. Delayed gadolinium-enhanced MRI of cartilage (dGEMRIC) in early knee osteoarthritis. Magn Reson Med. 2003;49:488–92.
21. Tiderius CJ, Svensson J, Leander P, Ola T, Dahlberg L. dGEMRIC (delayed gadolinium-enhanced MRI of cartilage) indicates adaptive capacity of human knee cartilage. Magn Reson Med. 2004;51:286–90.
22. Trattnig S, Mamisch TC, Pinker K, Domayer S, Szomolanyi P, Marlovits S, et al. Differentiating normal hyaline cartilage from post-surgical repair tissue using fast gradient echo imaging in delayed gadolinium-enhanced MRI (dGEMRIC) at 3 Tesla. Eur Radiol. 2008;18:1251–9.
23. Vasara AI, Nieminen MT, Jurvelin JS, Peterson L, Lindahl A, Kiviranta I. Indentation stiffness of repair tissue after autologous chondrocyte transplantation. Clin Orthop Relat Res. 2005; (433):233–42.
24. Williams A, Sharma L, McKenzie CA, Prasad PV, Burstein D. Delayed gadolinium-enhanced magnetic resonance imaging of cartilage in knee osteoarthritis: findings at different radiographic stages of disease and relationship to malalignment. Arthritis Rheum. 2005;52:3528–35.
25. Cova M, Toffanin R. MR microscopy of hyaline cartilage: current status. Eur Radiol. 2002;12:814–23.
26. Poole AR, Kojima T, Yasuda T, Mwale F, Kobayashi M, Laverty S. Composition and structure of articular cartilage: a template for tissue repair. Clin Orthop Relat Res. 2001;(391 Suppl):S26–33. 27. Buckwalter JA, Roughley PJ, Rosenberg LC. Age-related changes
in cartilage proteoglycans: quantitative electron microscopic studies. Microsc Res Tech. 1994;28:398–408.
28. Venn M, Maroudas A. Chemical composition and swelling of normal and osteoarthrotic femoral head cartilage. I. Chemical composition. Ann Rheum Dis. 1977;36:121–9.
29. Bittersohl B, Hosalkar HS, Haamberg T, Kim YJ, Werlen S, Siebenrock KA, et al. Reproducibility of dGEMRIC in assessment of hip joint cartilage: a prospective study. J Magn Reson Imaging. 2009;30:224–8.
30. Bittersohl B, Hosalkar HS, Hughes T, Kim YJ, Werlen S, Siebenrock KA, et al. Feasibility of T(2) (*) mapping for the evaluation of hip joint cartilage at 1.5T using a three-dimensional
(3D), gradient-echo (GRE) sequence: a prospective study. Magn Reson Med. 2009;62:896–901.
31. Bittersohl B, Steppacher S, Haamberg T, Kim YJ, Werlen S, Beck M, et al. Cartilage damage in femoroacetabular impingement (FAI): preliminary results on comparison of standard diagnostic vs delayed gadolinium-enhanced magnetic resonance imaging of cartilage (dGEMRIC). Osteoarthritis Cartilage. 2009;17:1297– 306.
32. Ganz R, Gill TJ, Gautier E, Ganz K, Krugel N, Berlemann U. Surgical dislocation of the adult hip: a technique with full access to the femoral head and acetabulum without the risk of avascular necrosis. J Bone Joint Surg Br. 2001;83:1119–24.
33. Lavigne M, Parvizi J, Beck M, Siebenrock KA, Ganz R, Leunig M. Anterior femoroacetabular impingement. I. Techniques of joint preserving surgery. Clin Orthop Relat Res. 2004;(418):61– 6.
34. Beck M, Kalhor M, Leunig M, Ganz R. Hip morphology influences the pattern of damage to the acetabular cartilage: femoroacetabular impingement as a cause of early osteoarthritis of the hip. J Bone Joint Surg Br. 2005;87:1012–8.
35. Bowalekar SK. Statistics in medical research. IV. Sampling distribution, statistical testing of hypothesis and student's t-test. J Postgrad Med. 1994;40:46–51.
36. Myers JL, Well A. Research design and statistical analysis. In: Mahwah, NJ: Erlbaum; 2003.
37. Landis JR, Koch GG. An application of hierarchical kappa-type statistics in the assessment of majority agreement among multiple observers. Biometrics. 1977;33:363–74.
38. Knuesel PR, Pfirrmann CW, Noetzli HP, Dora C, Zanetti M, Hodler J, et al. MR arthrography of the hip: diagnostic performance of a dedicated water-excitation 3D double-echo steady-state sequence to detect cartilage lesions. AJR Am J Roentgenol. 2004;183:1729–35.
39. Schmid MR, Notzli HP, Zanetti M, Wyss TF, Hodler J. Cartilage lesions in the hip: diagnostic effectiveness of MR arthrography. Radiology. 2003;226:382–6.