Markus Rudin
Received: 11 August 2006 Revised: 6 February 2007 Accepted: 13 February 2007 Published online: 6 March 2007 # Springer-Verlag 2007
Imaging readouts as biomarkers or surrogate
parameters for the assessment of therapeutic
interventions
Abstract Surrogate markers and biomarkers based on imaging readouts providing predictive information on clinical outcome are of increasing importance in the preclinical and clinical evaluation of novel therapies. They are primarily used in studies designed to establish evidence that the therapeutic principle is valid in a representative patient population or in an individual. A critical step in the development of (imaging) surrogates is validation: correlation with
established clinical endpoints must be demonstrated. Biomarkers must not fulfill such stringent validation criteria; however, they should provide insight into mechanistic aspects of the therapeutic intervention (proof-of-mechanism) or document therapy efficacy with prognostic quality with regard to the long-term clinical outcome (proof of concept). Currently used imaging biomarkers provide
structural, physiological and metabol-ic information. Novel imaging approaches annotate structure with molecular signatures that are tightly linked to the pathophysiology or to the therapeutic principle. These cellular and molecular imaging methods yield information on drug biodistribution, receptor expression and occupancy, and/or intra- and intercellular signal-ing. The design of novel target-spe-cific imaging probes is closely related to the development of the therapeutic agents and should be considered early in the discovery phase. Significant technical and regulatory hurdles have to be overcome to foster the use of imaging biomarkers for clinical drug evaluation.
Keywords Surrogate . Biomarker . Imaging . Molecular imaging . Drug development
Biomarker/surrogate markers
The term surrogate, from the Latin surrogatum, means substitute/substitution. In the biomedical context a surrogate endpoint substitutes for an established clinical endpoint, i.e., it is expected to predict clinical benefit based on epidemiologic, pathophysiologic or other scientific evidence [1]. Narrowing down even further to the evaluation of novel therapies, surrogates are parameters that predict the effect of treatment in clinical studies. Such readouts might be of a structural, physiological, metabolic, cellular or molecular nature.
A critical aspect when considering the use of surrogates is validation: the parameters must show a tight correlation
with classical clinical endpoints requiring large-scale multi-center clinical trials. It is obvious that validation studies for surrogate marker development are both time consuming and expensive, and may involve large patient populations. Biomarkers are not validated to the extent of a surrogate. According to a United States Food and Drug Administra-tion (FDA) definiAdministra-tion, a“biomarker is a characteristic that is objectively measured and evaluated as an indicator of normal biological processes, pathogenic processes, or pharmacological responses to a therapeutic intervention” [2,3]. Biomarkers are typically developed on the basis of mechanistic considerations. Consider a drug aimed at inhibiting a target enzyme. Demonstration that the drug is M. Rudin (*)
Institute for Biomedical Engineering, University of Zürich/ETH Zürich, AIC - HCI E488.2,
8093 Zürich, Switzerland e-mail: [email protected] Tel.: +41-44-633-7604
Fax: +41-44-633-1187 M. Rudin
Institute for Pharmacology and Toxicology, University of Zürich, AIC-HCI E488.2,
effectively inhibiting the enzyme would be regarded as proof of the pharmacological principle. However, it is obvious that enzyme inhibition may not necessarily predict beneficial outcome for patients. There is a reasonable likelihood that normalization of a biomarker (or of a bio-marker profile) might translate into an improved clinical status of the patient; but there is the complementary probability that the prediction might be wrong. In contrast, a surrogate would inevitably predict the therapeutic outcome. Nevertheless, biomarkers are highly attractive for both preclinical and clinical drug evaluations, not necessarily for clinical phase III trials, but rather for small-scale clinical studies aiming at demonstrating that a therapeutic concept is also valid in humans (proof-of-concept studies), critical information in the decision making on further development. Biomarkers are used as indicators of pharmacodynamic endpoints in patients, to assess translatability from animal studies to clinical studies correlating preclinical and clinical data, to establish the optimal dosing regimen and to stratify patient populations, i.e., to identify subgroups of patients that are most likely to respond to treatment. Pharmacody-namic measures reflect the effects of an intervention (e.g., a drug treatment) on the organism, i.e., structural, physiolog-ical or metabolic changes imposed by treatment. In contrast, pharmacokinetics (PK) analyzes how the organism handles a drug, i.e., how it is absorbed, distributed, metabolized and excreted by the body.
Biomarkers in order to be predictive early markers of therapy response have to be linked to the pathophysiology of the disease process. Moreover, the readout should be (1) on the‘critical path’ leading to pathological transformations and (2) downstream of the therapeutic intervention. Otherwise, it will not be useful as an indicator of clinical outcome (Fig. 1). A biomarker not associated to the dominant mechanism leading to disease might well indicate therapy response, however, would not predict clinical outcome. An example is inhibition of acetylcholine esterase (AChE) as symptomatic treatment in Alzheimer’s disease (AD), which can be monitored using suitable radio-labeled enzyme inhibitors. However, AChE inhibition is not disease modifying; the readout will not predict the long-term clinical outcome.
The Critical Path Initiative of the FDA aims at accelerating the drug development process, which for a new molecular entity currently takes more than 10 years and costs about 800 million US dollars. The initiative should ensure that ‘basic scientific discoveries translate more rapidly into new and better medical treatment by creating new tools to find answers about how the safety and effectiveness of new medical products can be demonstrated in faster time frames, with more certainty, at lower cost and with better information’ [2]. In March 2006 the FDA released the Critical Path Opportunity List, which com-prises six key areas; of relevance in the context of this article is the section on new evaluation tools - biomarker and disease models. The agency is convinced that drug
development programs will benefit from the availability of biomarkers, including imaging biomarkers, imaging methods being considered key enabling technologies. The FDA sees a critical role of biomarkers and surrogate endpoints in providing evidence (1) for validation of a therapeutic target, (2) for the elucidation of mechanism of action of drug candidates, (3) for demonstrating proof-of-principle of a therapeutic intervention, (4) for stratification patient populations, and (5) for the evaluation of therapy response or eventual side effects [2].
Imaging biomarkers
There are a number of advantages of gathering information to document the disease course or evaluate therapeutic interventions using imaging methods:
1. ‘Seeing is believing’: Capturing biological processes or consequences thereof as imaging data sets provides evidence of high documentary value that allow an ‘objective’ assessment of the patient status.
Fig. 1 (Imaging) biomarkers should probe disease-relevant path-ways. Moreover, the readout should be downstream of the therapeutic intervention (indicated by the syringe) in order to predict clinical outcome (top). For an intervention downstream of the checkpoint, treatment effects will not be captured (2nd row). In case of multiple mechanisms involved in the pathophysiological process, the therapy effect will be likely missed if the biomarker measurement probes a different pathway than that of the interven-tion (3rd row). In the last case (bottom) the biomarker will capture the drug effect; however, it is not the dominant mechanism leading to disease and may therefore not predict clinical outcome
2. Imaging methods are versatile, i.e., techniques can be used to probe a wide range of pathological conditions. Combining multiple imaging readouts might provide biomarker profiles that are of higher diagnostic relevance than individual markers.
3. Non-invasiveness enables longitudinal studies in individuals: The current status can thus be related to baseline values: Measuring relative changes to a reference state accounts for part of the inter-individual variability and thus enhances statistical power. 4. Imaging results are inherently quantitative: Structural
consequences of a disease process and treatment efficacy can be assessed via morphometric measures such as the volume of a structure. When probing tissue function using exogenous tracers, densitometric anal-ysis is commonly used to estimate local tracer concentrations in tissue or tissue compartments, a prerequisite for deriving quantitative physiological parameters. Obtaining biologically relevant quantita-tive information from an imaging data set is by no means straightforward; major methodological devel-opments are required.
Imaging biomarkers in clinical drug trials: structural, functional and molecular readouts in disorders of the central nervous system (CNS)
Imaging biomarkers are currently being developed for a wide range of human pathologies. It is beyond the scope of this article to comprehensively cover all active areas of research. In the following section we focus on structural and functional imaging readouts used to characterize stroke and neuro-degeneration of the Alzheimer type (AD).
(1) Stroke/focal cerebral ischemia: Multiple aspects of the pathophysiological cascade of focal cerebral ischemia can be monitored in great detail, using, e.g., MRI, from the initial vascular occlusion to post-acute events such as the infiltration of immune competent cells [4]. While many of these imaging procedures are primarily of experimental interest, some have matured to clinically established tools. For assessment of therapy response in stroke, the following imaging readouts are considered relevant:
Exclusion of cerebral hemorrhage for stratification of patients It is widely accepted that CT and MRI can both be used to differentiate ischemic stroke from cerebral hem-orrhage, a critical distinction when considering thrombo-lytic therapy using recombinant tissue plasminogen activator (rt-PA), which is currently the only agent approved by the FDA for the treatment of acute stroke. Large randomized trials that had used CT to exclude brain hemorrhage showed benefit from treatment with rt-PA when administered within 3 h following the insult [5]. Thus, structural imaging biomarkers are routinely used for patient stratification.
Perfusion-diffusion mismatch to predict outcome A critical parameter for predicting therapy response in focal cerebral ischemia is the identification of“tissues at risk” in case of sustained hypoperfusion. CT- or MRI-based perfusion imaging approaches allow rapid identification of areas with compromized perfusion [6]. A second early readout of pathology is the formation of a cytotoxic edema reflecting a redistribution of tissue water between the intra- and extra-cellular compartments due to failure of membrane pumps. These pumps are membrane-spanning proteins that are critical for maintaining concentration gradients across cellu-lar membranes and thus the pocellu-larization of the membrane. Membrane pumps transport ions in and out of cells against concentration gradients, a process requiring energy. Energy failure leads to the breakdown of ion homeostasis, inducing a change in osmolarity and thus to a redistribution of tissue water. This results in a decrease of the apparent diffusion coefficient (ADC) of water. ADC values are sensitive early, yet are not specific indicators of an ischemic insult [7]. The early ischemia markers ADC and CBF are potentially pre-dictive with regard to the final infarct volume: a significant perfusion-diffusion mismatch, a marker for the ischemic penumbra with the‘perfusion lesion’ being larger than that derived from ADC maps, is a strong predictor of lesion growth [8]. Such information may be translated into risk maps [9] describing the likelihood for a specific brain area to become infarcted in the absence of treatment. Deviation from this‘outcome’ might be considered the result of a therapy. Using such imaging readouts, a patient might be used as his/ her own control when assessing treatment response.
Structural versus functional readouts of therapeutic efficacy Cytoprotective therapy using a variety of pharma-cological strategies has been demonstrated to reduce the volume of infarction in animal models of focal cerebral ischemia, infarct volume (and location) being considered a biomarker of outcome [10]. The demonstration that regions spared from becoming infarcted are functional would be convincing evidence that infarct volume is a valid efficacy biomarker of anti-ischemic therapy. Studies in MCA occluded rats that were treated with a calcium antagonist confirmed the hypothesis only in part: recovery of the function in cortical areas spared from becoming infarcted has been observed; however, only a fraction of the animals showed a fully recovered fMRI response, while the remaining animals of the drug-treated group did not recover at all. All animals displayed a similar reduction of the infarct volume as compared to placebo-treated animals; in particular the somato-sensory cortex has been spared from becoming necrotic in all drug-treated animals [11,12]. The results imply that structural integrity is a necessary, yet not sufficient criterion for functional integrity. Correspond-ingly, the biomarker‘infarct volume’ tends to overestimate drug efficacy as far as functional (clinical) recovery is concerned. Whether these findings can be translated to clinical stroke care remains to be shown.
(2) Neurodegenerative diseases/Alzheimer dementia: With an aging population neuro-degenerative diseases have become a major health issue. There is an extensive effort worldwide to develop effective therapies against diseases such as Alzheimer dementia (AD). A major issue with regard to accelerating clinical drug development is the slow pace of disease progression rendering the evaluation of novel therapies tedious, emphasizing the need for biomar-kers for AD that yield early information treatment response. Many imaging techniques have been used to analyze structural, functional or metabolic alteration in patients suffering from AD or from mild cognitive impairment, which is associated with a high risk to develop AD. A number of candidate imaging biomarkers have been proposed. It is beyond the scope of this article to review all of them (see, e.g., [13]). We will focus on well-documented examples.
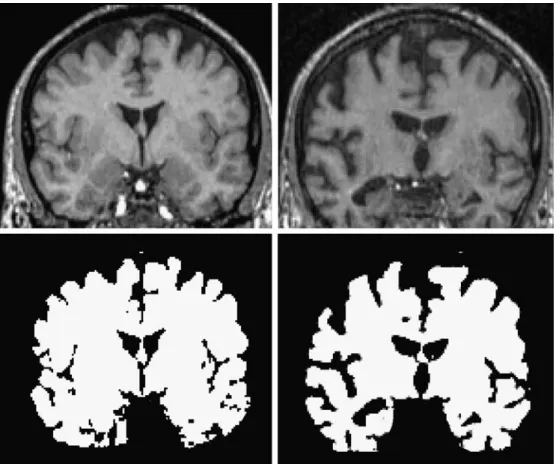
Assessing gross-morphological changes of the brain/ atrophy Neuronal loss in AD is accompanied by both general and focal brain atrophy that can be accurately assessed by volumetric analysis of structural MRI data [13] (Fig.2). It has been shown that the rate of cerebral atrophy, i.e., volume loss per annum, is significantly higher in AD patients as compared to age-matched healthy controls [14, 15]. Hence, measurement of the rate of cerebral atrophy might be considered an indicator of disease severity and
thus be used to assess potential therapeutic interventions that might slow down progression or even cause arrest of brain shrinkage. Issues with this biomarker are the high demands on accuracy of both data acquisition and analysis (image co-registration, criteria used for tissue segmenta-tion) in order to pick up small volume changes reliably and the potentially long duration required for a study (typically several months to more than 1 year for a proof-of-concept study). In addition, atrophy is a rather non-specific marker of AD. Similarly, non-specific functional imaging readouts in dementia include markers of brain function such as cerebral blood flow (CBF) and cerebral glucose utilization, although careful analysis of spatial patterns of abnormal-ities might be more disease specific [16].
Early clinical manifestations of AD include loss of short-term memory and cognitive impairment. A number of fMRI studies have been carried out in patients suffering from mild cognitive impairment and AD using a variety of stimulation paradigms (sensory input, cognitive tasks, working memory tasks). Significant region-specific altera-tions in fMRI signals have been reported; while these changes vary significantly in the different studies, they were consistent in displaying alterations when compared to age-matched controls [17]. Similar experiments have been carried out in transgenic mouse models of AD or of cerebral amyloidosis. The cortical and thalamic fMRI responses to pharmacological and sensory stimulation are
Fig. 2 Brain atrophy as struc-tural biomarker in AD. The rate of brain volume reduction is significantly higher in patients suffering from AD as compared to age-matched healthy persons. Images show a cross-section through the brain of an age-matched healthy volunteer (left) and an AD patient (right) obtained from MRI. The brain volume is extracted by segmen-tation based on intensity thresh-olds. The cross-sectional area (and correspondingly the volume) is significantly smaller in the patient. The accuracy of morphometric analyses critically depends on the initial image quality, in particular the contrast-to-noise ratio, and the performance of the registration and segmentation processing tools. (Images: courtesy of Nitsch R, Division of Psychiatric Research, University of Zürich, Switzerland)
significantly reduced in APP23 mice over-expressing the human amyloid precursor protein (APP) as compared to age-matched controls. The functional impairment was observed before any atrophy could be measured [18].
Readouts of cholinergic transmission AD is characterized by a progressive dysfunction of the cholinergic system and current therapies aim at increasing the availability of acetylcholine (ACh) for synaptic transmission by inhibiting acetylcholine esterase (AChE) [19]. In longitudinal studies, progressive loss of cholinergic activity could be demon-strated using AChE-binding PET ligands [20]. The same tracer has been used to demonstrate pharmacological efficacy: administration of AChE inhibitors has been shown to displace the PET ligands from AchE [21]. Alternatively, the cholinergic system can be probed by analyzing post-synaptic receptors: studies with11C-labeled nicotine demonstrated up-regulation of nicotinic ACh receptors by AChE inhibitors [22]. Functional conse-quences of AChE inhibition have been documented in AD patients following treatment with the AChE inhibitor rivastigmin: Drug treatment led to a significant increase in the fMRI response in multiple brain regions in a
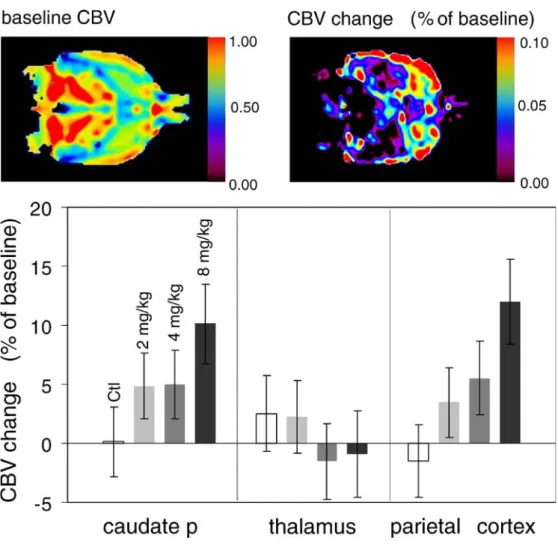
task-dependent manner [23]. These results can be related to data obtained in the rat: administration of rivastigmin prompted a region-specific hemodynamic response (increase cerebral blood volume), which was dependent on the dose of the drug (Fig. 3; [24]). Obviously, these molecular and functional imaging biomarkers provide valuable mecha-nistic information, i.e., clinical proof-of-concept that AChE inhibition infact enhances cholinergic transmission in AD patients. However, they do not unambiguously predict whether inhibiting ACh degradation will translate into an improved clinical outcome (see Fig.1).
Amyloid plaque load as disease indicator The histo-pathological hallmarks of AD are deposits consisting of β-amyloid peptides (amyloid or Aβ plaques), and
neuro-fibrillary tangles composed of hyper-phophorylated tau-protein in brain parenchyma. Quantitative assessment of the parenchymal plaque load would therefore constitute an attractive biomarker for characterizing AD. Attempts to visualize plaques using high-resolution MRI by exploiting the intrinsic contrast of plaques to the surrounding paren-chyma both in tissue specimens from humans [25] and of transgenic mice [26] have shown that translation of this
Fig. 3 Cholinergic activation in rat brain. Oral administration of the AChE inhibitor rivastigmin leads to region-specific increases of local CBV. Images (left) show baseline CBV and CBV changes following dosing with 8 mg/kg rivastigmin. Bar graphs shows regional CBV changes in caudate putamen, thalamus and parietal cortex with a dose dependency in the caudate and parietal cortex (adapted from [24])
approach to a clinical setting is unrealistic due to prohibitively long measurement times as a result of the high demands on spatial resolution. An alternative approach is the selective detection of plaque-related signals by administering Aβ -specific tracer molecules. For example, administration of one such PET tracer to AD patients revealed significant increases in cortical tracer binding with an inverse correlation between amyloid tracer binding and regional glucose metabolism as assessed using [18F]-fluoro deoxyglucose (FDG) as PET label [27]. Similar data have been obtained in genetically engineered mouse models of AD using plaque-binding fluorescent dyes [28]; yet the latter approach is of limited value for clinical applications due to insufficient light penetration through the human skull, but nevertheless constitutes an attractive technique for preclinical evaluation of AD treatments. From a clinical perspective, plaque-selective PET ligands are the most promising imaging agents for visualization and quantifica-tion of the plaque load in humans [29]. However, it has been reported that the correlation betweenAβ plaque load and clinical status in AD patients is rather weak, i.e., significant plaque deposition was observed in completely asymptom-atic elderly people [30]. To what extent quantitative assessment of plaque load constitutes a reliable biomarker of therapy efficacy in AD is currently unclear.
Physiological and molecular markers in cancer
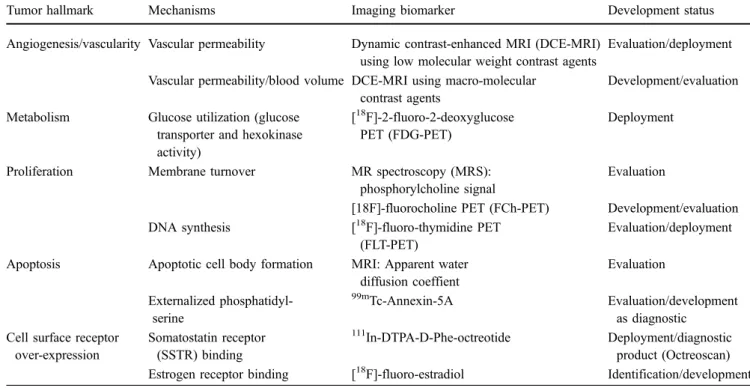
Morphological and physiological manifestations of disease and of therapeutic interventions must be preceded by aberrations at the cellular and/or molecular level. Hence, visualization and quantification of these parameters should increase the sensitivity and specificity of diagnosis and provide earlier evidence of therapy efficacy than the classical imaging readouts. Molecular imaging, which aims at annotating anatomical structures with molecular infor-mation, is currently developed at a rapid pace and beyond doubt will have a major impact on patient management. In this section we will focus on molecular biomarkers for cancer (see Table1).
Several hallmarks are characteristic of neoplastic tissues: excessive proliferation, increased metabolic activity, for-mation of new blood vessels, dysregulation of cellular homeostasis and the tendency to form colonies distant from the primary tumor site. In addition, tumor cells may express specific receptors that might be utilized for tumor targeting. (1) Targeting general tumor hallmarks: The classic readout when assessing tumor proliferation and treatment efficacy is tumor volume using structural imaging methods such as CT, MRI or ultrasound. Although clinically well established, structural readouts are recognized to be poor indicators of response. This is undesirable from several perspectives: from a drug developer’s perspective an early readout is desired in order to optimize the treatment strategy and to reduce development cost. More importantly,
Table 1 Potential imaging biomarkers for oncology
Tumor hallmark Mechanisms Imaging biomarker Development status
Angiogenesis/vascularity Vascular permeability Dynamic contrast-enhanced MRI (DCE-MRI) using low molecular weight contrast agents
Evaluation/deployment Vascular permeability/blood volume DCE-MRI using macro-molecular
contrast agents
Development/evaluation Metabolism Glucose utilization (glucose
transporter and hexokinase activity)
[18F]-2-fluoro-2-deoxyglucose
PET (FDG-PET)
Deployment
Proliferation Membrane turnover MR spectroscopy (MRS): phosphorylcholine signal
Evaluation
[18F]-fluorocholine PET (FCh-PET) Development/evaluation DNA synthesis [18F]-fluoro-thymidine PET
(FLT-PET)
Evaluation/deployment Apoptosis Apoptotic cell body formation MRI: Apparent water
diffusion coeffient Evaluation Externalized phosphatidyl-serine 99m Tc-Annexin-5A Evaluation/development as diagnostic Cell surface receptor
over-expression Somatostatin receptor (SSTR) binding 111 In-DTPA-D-Phe-octreotide Deployment/diagnostic product (Octreoscan) Estrogen receptor binding [18F]-fluoro-estradiol Identification/development
patients may be exposed to potentially ineffective therapy for prolonged periods of time.
Structural growth requires the synthesis of molecular building blocks of cells. DNA, protein and membrane phospholipid synthesis rates are therefore potential in-dicators of proliferation. Imaging approaches, and in particular PET methods, have been developed to probe each of these processes. PET-based approaches use radio-labeled precursor molecules such as radio-labeled thymidine analogues [31], amino acids [32] or choline [33,34].
Proliferation marker Thymidine kinase 1 (TK) is a key enzyme in DNA synthesis. It phosphorylates thymidine, a prerequisite for DNA incorporation. TK activity can be monitored by administration of radio-labeled substrates. The thymidine analogue [18F]-3 ′-fluoro-3′-deoxythymi-dine (FLT) is a substrate for TK, which has been thoroughly evaluated as a potential indicator of DNA synthesis. FLT is taken up by cells and phosphorylated by TK, leading to intracellular trapping [35]. Tumor levels of radio-labeled nucleotides (thymidine analogues) then reflect DNA synthesis and, correspondingly, cell prolifer-ation [36,37]. Clinically, this approach is highly attractive, in particular for tissues with high intrinsic glucose utilization, where the established [18 F]-2-fluoro-2-deoxy-glucose (FDG) method (see below) might be compromised by poor signal-to-background ratios. Clinical validation of FLT as a proliferation marker is ongoing.
Rapid cell proliferation is associated with high protein synthesis rates and high demands on re-supply of amino acids. There is experimental evidence that amino acid transport is up-regulated in experimental tumors. Labeled amino acid precursors (such as [18F]-fluorotyrosine) might be used to monitor protein synthesis. However, preclinical and clinical results up to now using fluorinated amino
acids show that tissue uptake rates are dominated by slow amino acid transport across the cell membrane rather than actual protein synthesis rates [38].
Increased proliferation rates are also associated with increased rates of membranes synthesis, and substrates required for membrane synthesis constitute another po-tential proliferation markers. In fact, magnetic resonance spectroscopy (MRS) studies of tumors revealed some characteristic common spectral features: (i) elevated signals of endogenous phosphomonoester (PME) and -diester (PDE), (ii) elevated intensity of the‘choline’ signal, and (iii) early decreases in the PME signal as predictor of therapy response [39]. These data point to the role of PME and PDE in membrane biosynthesis and degradation pathways. In vivo MRS is currently evaluated by several groups for its potential as a prognostic tool and as a potential biomarker for treatment efficacy. Alternatively, PET using radio-labeled choline derivatives, for example [11C]-choline, first evaluated for imaging of brain tumors, could be used to assess lipid membrane turnover [40]. There is evidence that for tumors located in tissues with high intrinsic glucose utilization (e.g., brain), measure-ment of choline accumulation yields higher tumor-to-background values as compared to FDG PET imaging.
Metabolic marker/glucose utilization Measurement of glucose utilization rates via FDG PET has evolved as a sensitive diagnostic tool for the characterization of primary tumors and for the detection of metastases. FDG is taken up by cells via the glucose transporter and phosphorylated by hexokinase to yield FDG-6-phosphate (FDG-6P). This metabolite is not further processed through the glycolytic chain (due to the lack of a hydroxyl group at the 2-position). Because of the phosphate group added, FDG-6P is charged and trapped in the cell. Hence, the trapping of
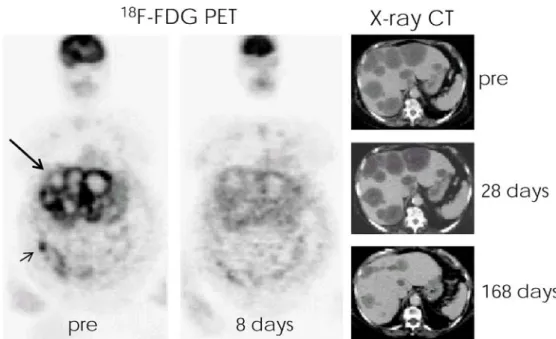
Fig. 4 Effect of tyrosine kinase inhibitor imatinib mesylate in a patient with a bowel GIST (short arrow) suffering from multiple liver and peritoneal metastases (long arrow).18 F-FDG PET and CT studies were carried out prior and at various days following drug treatment. Within 8 days after the start of the imatinib treatment,18F-FDG uptake in neoplastic tissue was completely abolished, while a significant reduction of the liver tumor burden could be observed after 24 weeks only (adapted from [41], reproduced with permission)
FDG-6P by the cells reflects glucose transporter and hexokinase activity and the PET activity becomes a marker for the glycolytic activity of the tissue of interest. There is convincing evidence in several clinical drug trials that changes in glycolytic rate precede effects on the tumor volume. For example, in patients suffering from gastro-intestinal stromal tumors treated with imatinib, an inhibitor of cKIT tyrosine kinase (and of BCR-ABL, an oncogenic tyrosine kinase associated with chronic myeloid leuke-mia), glucose utilization was significantly reduced within 24 h after treatment onset, while there was no effect on tumor volume for several weeks (Fig. 4) [41], indicating that the glucose utilization rate predicts therapy response.
Angiogenesis marker Neo-vascularization is a critical factor promoting tumor growth. A driving factor of angiogenesis is hypoxia, which leads to the expression of angiogeneic factors. Tissue, and in particular tumor hypoxia, can be imaged using PET or MRI approaches [42]. The alternative and more widely used approach to study tumor neovasculature uses so-called dynamic con-trast-enhanced (DCE) MRI methods, which exploits the fact that newly formed immature vessels are characterized by increased vascular permeability. DCE-MRI measures the leakage of low molecular weight contrast agents such as GdDTPA (Magnevist) or GdDOTA (Dotarem) into the extracellular space. The method is currently being evaluated as a biomarker for evaluating anti-angiogenic therapy efficacy [43–45].
The vascular endothelial growth factor (VEGF, also known as vascular permeability factor) is an angiogenic factor induced by most solid tumors. Inhibition of VEGF receptor signaling should be reflected by decreased vascular permeability and potentially also reduced tumor blood volume. This has been demonstrated in rodent tumor models [46,47]. In both an orthotopic kidney tumor model and B16 melanoma model in mice, the VEGF-R tyrosine kinase inhibitor vatalanib (PTK787) significantly reduced vascular leakage in B16 melanoma lymph node metastases, the decrease occurring within 48 h after onset of therapy. Clinical studies in patients with liver metastases yielded corresponding results indicating that, in fact, vascular permeability measures may serve as a biomarker of anti-VEGF drug efficacy [48]. Vascular permeability assessment using DCE-MRI is meanwhile a widely evaluated biomar-ker and has become a gold standard for assessing anti-angiogenic response. The method has been used for translational studies with a number of compounds (vatalanib [46–48], combretastatin [49], ZD6126 [50,51]).
While DCE-MRI is widely used for early clinical evaluation of anti-angiogenic drugs, the approach suffers from shortcomings due to the use of low molecular weight contrast agents: the tracers leak into the interstitial space also in mature vessels, which compromises the dynamic range of the measurement, and display high diffusive mobility. The local concentrations of the contrast agents
and, hence, the signal enhancement at the tumor site are governed by perfusion rates, vascular leakage and inter-stitial diffusion. Using DCE-MRI in combination with macromolecular contrast agents alleviates these limitations (Fig.5): perfusion and extravasation could be more easily separated due to different time scales of the processes, and the contribution of diffusion would be largely negligible [52]. Unfortunately, no macromolecular contrast agents are currently approved for clinical use in this indication.
Apoptosis marker Programmed cell death is an essential process for cell homeostasis, and down-regulation of apoptosis is associated with excessive cellular proliferation associated with malignancies. Induction of apoptosis is an attractive therapy concept in oncology and many cyto-statics display a pro-apoptotic component. Several imag-ing strategies for visualizimag-ing activation of the apoptotic pathway are conceivable.
Cells undergoing apoptosis redistribute aminophospho-lipids to the outer leaflet of the cell membrane [53]. These extracellular aminophospholipids, primarily phosphatidyl-serine, are recognized by phagocytotic cells prompting a signal for cell removal [54]. Externalized phosphatidylser-ine moieties are recognized by annexin-5A [55], which binds to its target with high affinity and specificity. Specific imaging probes have been designed by coupling reporter groups such as radioligands (99mTc-chelates) to annexin-5A [56]. Labeled annexin-5A has been used to demonstrate therapy-induced apoptosis in cancer patients [57] and in animal models. For example, chemotherapy using cyclophosphamide in a murine tumor model led to induction of apoptosis within hours after drug administra-tion as reflected by increased annexin binding [56, 58]. Radiolabeled annexin-5A is currently in clinical develop-ment as a potential radiodiagnostic.
Indirect imaging approaches, sensitive to microstructur-al or metabolic changes associated with apoptosis, have also been proposed. Apoptosis-inducing therapy results in increases in water ADC in a rat glioma model early after treatment onset prior to any changes in tumor volume [59]. The effect was attributed to increases in the extracellular volume due to the formation of apoptotic bodies. Studies in glioma patients also have revealed early increases in ADC following chemotherapy, indicating that ADC values might serve as potential biomarkers to assess pro-apoptotic treatment response [60].
Metastasis formation Detection of metastases is of high diagnostic and prognostic relevance for cancer patients. Today, the gold standard imaging approach for detection of metastasis is FDG-PET, which is characterized by high sensitivity, but poor spatial resolution. The detection limit is currently of the order of 5-mm tumor diameter [61]. An advantage of PET is that the whole body can be efficiently screened for metastasis. Limitations include radiation exposure to patients.
MRI has emerged as an attractive alternative for detection of lymph node metastases. The approach uses the fact that particulate matter and pathogens that are recognized by the immune system are cleared from circulation by the cells of the monocyte phagocytotic system (MPS). This has be exploited by developing long circulating nanoparticles containing a core of iron oxide (small and ultra-small particles of iron oxide: SPIO and USPIO, or mono-crystalline iron oxide nanoparticles: MION), which due to their super-paramagnetic properties have a strong effect on the contrast in MRI (shortening of T2
and T2* relaxation times) [62]. While healthy lymph node
tissue shows massive uptake of USPIO/MION, metastatic tissue does not. There is compelling preclinical and clinical evidence of the improved diagnostic sensitivity and spec-ificity of the approach using USPIO/MION for detection of lymph node metastases [63,64]; approval of the approach by the regulatory authorities is expected soon.
Protease activity marker A characteristic feature of tumors is excessive secretion of proteases, which among other effects, degrades the extracellular matrix and enables tumor infiltration into healthy tissue. Identifying areas of increased protease activity would be attractive with regard to tumor detection and to assess the efficacy of protease
inhibitors. An elegant approach uses activatable or‘smart’ near-infrared fluorescent probes [65, 66] that will only generate a signal upon interaction with their target. Such a probe has been used to assess the efficacy of the matrix metalloprotease (MMP) inhibitor prinomastat in a murine tumor model, providing direct proof-of-mechanism of the therapeutic concept, protease inhibition [67]. For clinical application, this approach is limited due to light scattering in biological tissue, confining penetration of NIR light to a few centimeters requiring the development of endoscopic procedures (e.g., coloscopy for imaging colorectal tumors). The usefulness of a specific protease imaging probe is tightly linked to the validity of the respective protease as drug target. MMP inhibitors are aimed at inhibiting cellular penetration of the basement membrane and, therefore, tissue infiltration by malignant cells. Yet, MMPs have been found to also exert host-protective functions such as suppression of angiogenesis or inacti-vation of chemokines. As a therapeutic strategy MMP inhibition has failed in clinical trials [68]. Currently, it is not clear whether the trials as such failed (trial design, side effects, inappropriate dosing) or whether MMP inhibitors failed as a drug class. Imaging biomarkers might help to resolve this issue, providing relevant mechanistic informa-tion both in animals and eventually in the patient [68]. Fig. 5 DCE-MRI (a) and simulation results (b) for uptake of low
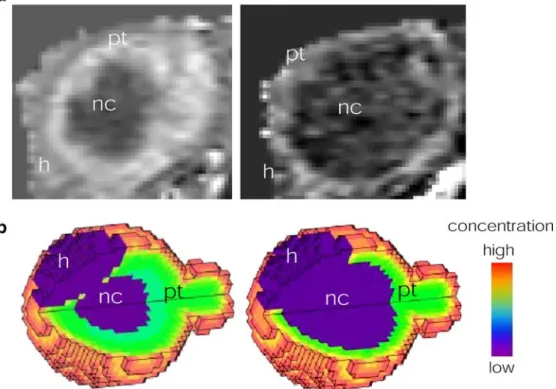
molecular weight (left) and macromolecular contrast agent (right) in subcutaneously implanted mammary tumor in nude mice. Tissue model comprises three compartments: healthy tissue (h), proliferating tumor (pt) and necrotic tumor core (nc), which in contrast to the other two compartments is not vascularized. Tracer transport processes considered in the simulation are perfusion, diffusive transport and
convective transport. Note different patterns of contrast enhancement reflecting local tissue concentrations of the two contrast agents observed 20 min after administration. Simulation results indicate a significant contribution of molecular diffusion for the low molecular weight tracer (experimental MRI data: courtesy of Allegrini P, Novartis Institute of Biomedical Research Basel; Simulation results: Grimm HP, Kuttler A, Rausch M, Rudin M, unpublished)
(2) Targeted tumor probes: Suitable targets for imaging as well as for therapeutic intervention comprise peptide receptors that are frequently over-expressed in specific neoplastic tissue. Targets include the somatostatin recep-tors in neuroendocrine tumors, gastrin-releasing peptide receptors in prostate and breast cancer and neuropeptide Y receptors in breast cancer [69]. Several corresponding peptide ligands have been radio-labeled and are being evaluated as potential imaging probes.
Membrane-bound somatostatin receptors (SSTRs) are highly expressed in neuroendocrine tumors and as such represent attractive targets for a tumor-specific imaging probe. Their endogenous ligand is somatostatin, a neuro-peptide with a short plasma half life. A metabolically stabilized somatostatin analogue, octreotide, has been used as a targeting template to which various reporter groups have been coupled.111In-DTPA-D-Phe-octreotide has been developed to the clinically approved probe111 In-pentetreo-tide (Octroscan) for SPECT imaging. Administration of such ligands leads to highly specific enrichment at the tumor site both in patients suffering from neuro-endocrine tumors [70] and in animal models thereof [71]. There are several other radiopeptides that are currently being evaluated as tumor-specific imaging agents such as bom-besin or cholecystokinin, e.g., in prostate cancer [69].
Inhibition of intracellular signaling via the estrogen receptor (ER) pathway is an established strategy in the therapy of breast cancer [72]. This can be achieved by various strategies, e.g., using ER inhibitors such as tamoxifen that compete with the endogenous receptor ligand, by lowering the concentration of the endogenous agonist (aromatase inhibitors) or by inducting ER degra-dation [72]. Assessment of ER levels would be of high value for diagnostics and in particular for development of new therapies. Several agents are currently being evaluated for PET ER imaging [73,74]. For example, [18 F]-fluoro-estradiol (FES; [75]) shows great promise for assessing the functional ER status in breast cancer patients by PET: quantitative levels of FES uptake in primary tumors correlate positively with the level of ER expression [76] and allow the detection of metastatic lesions in patients with ER-positive tumors [77,78]. A recent study indicated that quantitative FES PET imaging predicts the response to
endocrine treatment in breast cancer and may help guide treatment selection [79]. While such results are certainly encouraging, only multi-center studies designed with adequate statistical power will demonstrate the value of FES-PET for therapeutic decision making.
The Her-2/neu (c-erb B-2) tyrosine kinase receptor is overexpressed in approximately 25% of human breast cancers [80]; higher expression levels have been shown to correlate with poor prognosis. Her-2/neu constitutes a potential target for immunotherapeutic agents such as the humanized monoclonal antibody trastumazab (Herceptin), which has shown promising results in HER2/neu over-expressing cancers [81]. A PET imaging probe has been developed using a68Ga-chelate as a reporter moiety [82]. Initial experiments were carried out using the full mono-clonal antibody with covalently linked DOTA chelating groups revealing excellent tumor targeting in murine tumor xenografts; however, pharmacokinetic (PK) properties of this probe turned out unfavorably. A probe based on antibody fragments showed improved PK characteristics at the expense of a slightly compromised binding affinity. This probe has been used to assess the response to treatment with an inhibitor of heat shock protein 90 (HSP90), which was shown to effectively and potently reduce levels of Her2/neu expression within hours after therapy onset [82], an important feature of a potential biomarker. HSP are stress-induced proteins that are up-regulated in many tumors. HSP are molecular chaperons assisting proper protein folding and stabilizing unfolded proteins, including oncogenic proteins expressed by malignant cells; hence, inhibition of HSP by low molecular weight ligands or antibodies is currently evaluated as anticancer therapy and several of these drugs are in clinical development [83].
Imaging biomarkers: some challenges
Imaging methods providing quantitative structural, func-tional and more recently also cellular and molecular information in a non-invasive manner have become valuable tools for the evaluation of drug candidates. Imaging enables longitudinal studies in an individual allowing the evaluation
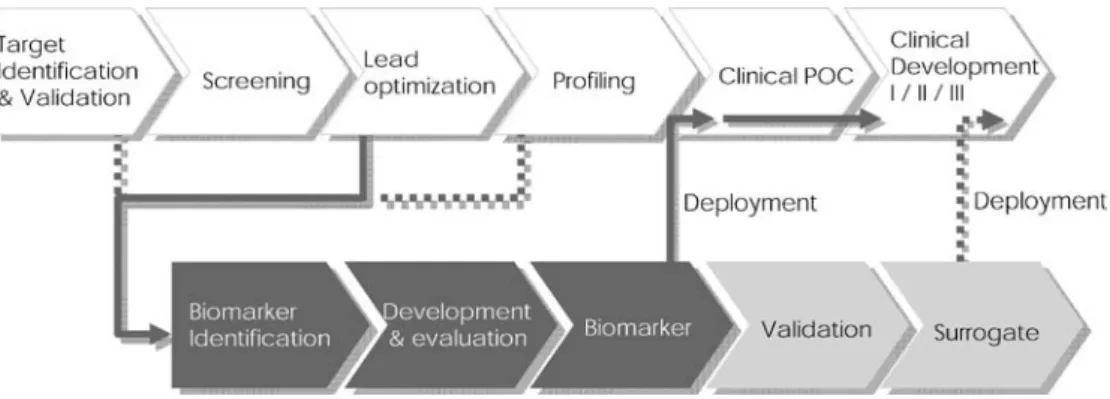
Fig. 6 (Imaging) biomarker development chain. Biomarkers should be available for deploy-ment when the drug enters clin-ical trials, e.g., for clinclin-ical proof-of-concept (POC) studies, requiring timely initiation of the biomarker development process. Development to a surrogate endpoint requires extensive va-lidation studies comparing bio-marker readouts with classically accepted endpoints
of therapy response with respect to a pre-treatment reference state, which will benefit from a significant reduction of the inter-individual variability. Furthermore, non-invasive diag-nostic imaging will allow stratification of patient groups to achieve homogeneous cohorts enhancing the statistical power of a therapy evaluation study.
An important aspect in drug development is the timely availability of biomarkers of therapeutic efficacy (Fig. 6). This is relevant both for the drug developer and for the patient. A considerable number of potential imaging biomarkers are currently in preclinical or clinical evaluation (see Table1listing potential biomarkers for assessment of cancer treatment), and it is likely that several of those will make a major impact on the development of future therapies. Nevertheless, several issues have to be addressed by drug developers, regulators and the imaging community to fully exploit the potential of imaging biomarkers.
1. General versus specific biomarkers: Imaging biomar-kers may reflect alterations of a general disease hallmark as discussed above for tumors (proliferation, metabolism, angiogenesis, apoptosis) or cerebral vas-cular disease (lesion volume, perfusion, cell swelling, metabolism), or alternatively reflect specific molecular interactions at the level of a drug target. Imaging of specific biomarkers is certainly highly attractive from a mechanistic point of view, and the concept of personalized therapy involving a diagnostics/therapeu-tics pair has raised considerable interest recently. However, the more target specific a biomarker is, the higher the risks associated with its development as an imaging tool. As soon as the target is not further pursued by the therapy developer, the biomarker becomes obsolete. Thus, development of imaging biomarkers will focus-at least initially-on more general readouts that are of relevance for a wide range of diseases such as the markers of tumor hallmarks already mentioned or markers of inflammation (e.g., antigens expressed activated endothelium, infiltration of mono-cytes and lymphomono-cytes). Specific biomarkers will be developed as diagnostics for‘high value’ targets, such as the examples already discussed in the cancer area (e.g., Her-2/neu) or, e.g., a probe targeting monomeric or aggregatedAβ peptide as a marker of AD, which would be of relevance for large patient populations. 2. Validation studies: Validation of a surrogate requires
correlation with established clinical endpoints, e.g., survival in a cancer study, involving large-scale clinical studies, in particular when targeting chronic diseases. The surrogate in order to be acceptable for regulatory authorities must reliably predict clinical outcome at the level of the individual and when considering a population. The prognostic value of the surrogate is given by its dynamic range and its variability. The dynamic range describes the sensitivity to the disease process and the therapeutic intervention: how small a
change can be reliably detected? The ability to detect small changes might translate in earlier readouts of efficacy. Factors determining surrogate variability are biological and methodological variation. From the point of view of multicenter trials, standardization of the measurement process (hardware, measurement proto-cols and analysis procedures) becomes a critical issue. Few imaging readouts have been developed to the surrogate stage so far. For example, MRI outcome measures have been shown to provide objective evidence for the clinical endpoints in multiple sclerosis (MS). Despite this, imaging readouts cannot be considered fully validated surrogates of clinical out-come in MS. While they capture the inflammatory component of the disease, axonal loss leading to progressive disability is not reflected. Nevertheless, when considering therapeutic interventions that aim at preventing relapses, new Gd-enhancing and T2lesions
can be considered a surrogate outcome measure; these MRI readouts qualify as the primary measure for evaluating the anti-inflammatory treatment efficacy of novel MS drugs [84,85].
Response Evaluation Criteria In Solid Tumors (RE-CIST) were modified in 2000 to objectively character-ize the effect of treatment on tumor volume [86,87]. Based on radiological (principally CT) readouts, anti-tumor effects are classified into complete response, partial response, no change and progressive disease. This RECIST classification has become an integral part of most clinical cancer therapy studies-however, they are not surrogates replacing the clinical endpoint, which is patient survival, but rather constitute supportive evidence. There are instances of both clinical benefit without tumor regression and tumor regression without clinical benefit [86].
Biomarkers are not validated to the extent of surrogates. More often they reflect mechanistic aspects of the disease process or the therapeutic intervention or provide (early) objective evidence that an individual is responding to treatment. Criteria for the development of biomarkers are mechanistic plausibility, availability of methods and technologies, and translatability into the clinics. Whether these readouts will predict clinical outcome is not their primary purpose. For example, measurement of vascular leakiness is a widely used biomarker for evaluating anti-angiogenic therapy. DCE-MRI provides early information about whether a patient responds to the therapy-important information for the drug developer. However, the readout will, in general, not predict clinical outcome (tumor regression and patient survival).
When developing an imaging biomarker for clinical use, important aspects to consider are technical feasibility (for example, the application of optical imaging techniques in the clinics will be severely impaired by limited tissue penetration of light),
performance of clinical vs. preclinical instrumentation, translatability of experimental protocols, accuracy and reproducibility of the biomarker measurement, dynamic range of the biomarker and the availability of contrast-enhancing agents for clinical use (see, e.g., discussion about low molecular weight and macromolecular con-trast agents for assessing vascular permeability). 3. Standardization: A validated (imaging) biomarker must
deliver quantitatively consistent results independent of the observer, instrumentation or institution. This requires standardization of the study design, acquisi-tion protocols and data analysis procedures as clinical studies are commonly designed as multi-center trials. 4. Biomarker profile instead of individual biomarkers: A
single biomarker cannot capture the complex aspects of a disease such as cancer. This has, for example, been demonstrated in clinical studies of colorectal cancers evaluating the biomarker potential of both vascular (perfusion, blood volume) and metabolic parameters (glucose utilization) for the evaluation of therapy effects. Treatment with the monoclonal antibody bevacizumab significantly reduced readouts reflecting vascularity as derived from perfusion CT, but did not affect glucose utilization rates [88]. In contrast, a decrease of the glucose utilization rate was highly indicative for treatment response to imatinib in GIST tumors [41]. The suitability of a biomarker to assess therapy of malignant tumors depends on the tumor type and the therapeutic principle; complementary informa-tion provided by different biomarkers will enhance the diagnostic/prognostic value.
Combination of the multiple imaging modalities will allow comprehensive characterization of pathophysio-logical processes and therapeutic interventions at the receptor level by monitoring individual signaling cascades, and finally via the morphological, physio-logical and metabolic consequences of these molecular events. For the drug developer multimodality imaging should become an important instrument for under-standing drug effects at the level of the whole organism. The combination of multiple readouts results in a biomarker profile, similar to proteomics and metabonomics [89], enhancing the specificity and sensitivity of diagnostic tools. Profiles might be analyzed using statistical tools such as a generalized linear model (GLM). This approach has been applied, e.g., to generate risk maps from perfusion and ADC data in patients suffering from stroke [9]. GLM-derived information can be used to evaluate therapeutic interventions by comparing what the model predicts would happen to each voxel in the absence of therapy with the actual outcome following treatment at the level of individuals. Of course, this approach is not limited to stroke studies, but constitutes a general concept. A methodological limitation is the basic assumption that parameters should be related in a linear
fashion, which is unlikely to be the case for a complex biological system. More sophisticated non-linear approaches are therefore required. Clinical parameters such as age [90], general health status and genetic factors are likely to affect outcome and might be considered in more general statistical approaches. The inclusion of both genotypic and phenotypic informa-tion will thus become increasingly important factors in predictive models [9,90]. As stated in the context with the Critical Path Initiative, ‘a multidimensional and continuous model needs to replace the current single dimension, binary model of clinical effect’ [3]. 5. Improved tools for quantification: It is essential to
translate primary imaging data into biomedically relevant quantitative information. Extraction of mor-phometric information is, in general, straightforward provided that there is high enough contrast-to-noise for image segmentation. Accurate estimation of physiolog-ical and molecular parameters is more difficult and requires the development of tissue models of various degrees of sophistication. As such models are currently largely inadequate, imaging readouts are frequently expressed by parameters derived from primary imaging data sets, such as the area under the signal enhancement curve during the first 90 s following tracer administra-tion in DCE-MRI studies of tumors [44], or as relative deviations of parameter values from the normal, healthy state. This raises the principal question: how normal is ‘normal’? Is the reference region a valid control? Furthermore, as already stated, biological systems are not linear. Considering brain perfusion, there are thresholds for cell function and cell survival; hence, minimal changes in the blood flow to the tissue may have dramatic consequences [91]. Clearly, improved methods for modeling biological systems are required. 6. Regulatory issues: Currently, the development and
registration of a new diagnostic agent are comparable to the development of a novel therapeutic, despite a significant lower market potential. As a result, there are only a very limited number of diagnostic imaging agents currently available for large-scale clinical usage. For example, the manufacturer of ferumoxtran-10 (Combidex/Sinerem) submitted a marketing authoriza-tion applicaauthoriza-tion (MAA) for the compound as a functional molecular MRI imaging agent to aid in the differentiation of normal from metastatic lymph nodes to the European Medicines Agency (EMEA) only in December 2006 [92]. The product had been refused by the FDA for the same use in 2004 despite clear evidence of efficacy. The overall development process took more than 10 years, similar to that of a therapeutic. Of course, not all imaging biomarkers involve the development of novel diagnostics; never-theless, in the context of the Critical Path Initiative, it becomes obvious that the approval process for diag-nostics tools has to be carefully analyzed, and the
agencies seem willing to do so. A step in the right direction is the so-called ‘microdosing concept’ [93], which holds for tracers that are administered in sub-pharmacological doses (at least two orders of magni-tude lower than doses prompting a pharmacological response). In this case, the requirement for application of the tools in clinical studies would be only evaluation for acute toxicological and safety effects of the tracer. Both regulatory agencies, the EMEA [94] and the FDA [95], support the concept as stated in their recent position papers.
Conclusion
Imaging is increasingly being applied in the preclinical and clinical evaluation of novel therapies. Being non-invasive, imaging allows sample sizes to be reduced by comparing outcome measures with pretreatment values (baseline), which will allow reducing trial costs significantly. The primary role of such studies is to establish proof-of-concept, i.e., to demonstrate that the pharmacological principle is valid in patients.
Current largely established imaging biomarkers are based on structural (e.g., RECIST for tumors, infarct volume for stroke, lesion load for MS) or physiological readouts (e.g., DCE-MRI and glucose utilization rates for tumors). However, it is clear that a next generation of (molecular) imaging approaches will provide specific mechanistic information tightly linked to the therapeutic pharmacological principle, the design of novel molecular imaging probes being closely related to the development of the therapeutic agents (111In-pentetreotide and octreotide are an example of such a pairing).
The FDA Critical Path Initiative [2], which aims at modernization of the development process for medical products, is also a milestone for the development and deployment of biomarkers as tools for therapy evaluation. Definitions for biomarkers, surrogate endpoint and clinical outcome accepted by a regulatory authority set guidelines for drug developers. As outlined above, imaging-based biomarkers and surrogate endpoints may provide informa-tion on critical aspects during therapy development such as target validation or proof-of-concept of the therapeutic principle. Nevertheless, there are few imaging biomarkers and even fewer surrogates based on imaging readouts that are currently accepted by the FDA as appropriate tools in clinical trials. There are, however, a significant number of candidates currently in the pipeline as illustrated for cancer biomarkers (Table 1); some of them might soon become available for clinical drug development.
Obviously there are of number of regulatory issues associated with the use of biomarkers in drug development that need to be resolved. As already pointed out, proper validation is an expensive and time-consuming process.
Regulatory acceptance of biomarkers that do not fulfill stringent validation criteria, but provide insight into mechanistic aspects of the therapeutic intervention, with documentation of biomarker usefulness in a disease-specific manner would help advance the field [2,3]. The main driver of the process will be the pharmaceutical industry in collaboration with academia and regulators. Development of biomarkers, including imaging biomarkers, will become an important new aspect in the development of a novel therapeutic; these tools must be ready for deployment when the clinical phase is entered (Fig.6). Clear regulatory criteria for the development and use of such markers as well as guidelines for efficient co-development of therapeutic/ biomarker pairs are required [3].
Apart from being accepted as biomarkers or surrogate endpoints by regulatory agencies, rapid readouts on efficacy and mechanism will provide valuable information for early‘go/no-go’ decision making with regard to further development of the drug/therapy as illustrated for treatment of cancers with anti-angiogenic drugs [43–51] or tyrosine kinase inhibitors [41]. Positive outcomes of proof-of-concept studies provided confidence for the initiation of large-scale phase III trials.
While the availability of imaging biomarkers during the early clinical phases is highly attractive and clearly favors an early embarking in marker development, potentially during the lead optimization or profiling phase, this strategy also carries substantial risk in view of the high attrition rates involved in the drug development pipeline. This becomes even more relevant when considering a molecular biomarker that is tightly linked to the mechanism of action of a therapeutic, i.e., a specific target. As this target is dropped (e.g., because of lack of efficacy or because of safety issues), the marker will most likely become obsolete, while the indication as such might still be of interest. Therefore, many of the markers that are currently being evaluated reflect generic properties of pathology. For cancer imaging probes for processes such as proliferation, angiogenesis, metabolism and apoptosis are being evaluated by many centers, while only few probes targeting tumor-specific antigens (receptors) are being considered (herceptin, octreotides). In contrast, for brain imaging a number of target-specific PET ligands probing various neurotransmitters systems have been described; these tracers are attractive to characterize a large variety of CNS disorders or effects of neuro-active compounds [96]. Imaging has become an established tool in pharmaceu-tical research, in particular at the preclinical level during lead optimization and profiling, where it is used for more than 2 decades to characterize drug effects in animal models of human disease [10]. Translation of these methods into clinical studies, however, has been less straightforward than anticipated; few biomarkers are currently being used for clinical drug evaluations. There are technical reasons accounting for this deficiency: the clinical imaging toolset is more limited than that at the
preclinical level, safety regulations are more stringent, and contrast agents might not yet be approved for clinical use. Clinical trials are in general designed as multi-center studies raising issues regarding standardization of data acquisition and analysis, which become even more problematic in view of the rapidly evolving imaging hardware, acquisition protocols, analysis tools and novel contrast-enhancing principles. Also, lack of sufficient
evaluation/validation of imaging biomarkers has prevented their use in early clinical studies. The major stakeholders, i.e., the regulatory authorities, drug development industry and academic partners involved in the process have identified these issues and seem willing to rigorously address them. Thus, it is to be expected that the number of imaging biomarkers markers deployed for clinical drug evaluation will substantially increase during the next decade.
References
1. Lesko LJ, Atkinson AJ (2001) Use of biomarkers and surrogate endpoints in drug development and regulatory decision making: criteria, validation, strategies. Annu Rev Pharmacol Toxicol 41:347–366
2.http://www.fda.govCderregulatorymed Imagingdefault.htm. Innovation or Stagnation, Challenge and Opportunity on the critical Path to New Medical Products (March 2004)
3. Woodcock J (2004) A Framework for Biomarker and Surrogate Endpoint Use in Drug Development.http://www.fda. govohrmsdocketsac04slides2004-4079S2_03_Woodcock.ppt
4. Rudin M, Weissleder R (2003) Molecular imaging in drug discovery and development. Nature Rev Drug Disc 2:123–131
5. Caplan LR (2004) Thrombolysis 2004: the good, the bad, and the ugly. Rev Neurol Dis 1:16–26
6. Keir SL, Wardlaw JM (2000) System-atic review of diffusion and perfusion imaging in acute ischemic stroke. Stroke 31:2723–2731
7. van der Toorn A, Sykova E, Dijkhurzen RM, Vorisek I, Vargova L, Skobisova E, van Lookeren-Campagne M, Reese T, Nicolay K (1996) Dynamic changes in water ADC, energy metabolism, extracellular space volume, and tortu-osity in neonatal rat brain during global ischemia. Magn Reson Med 36:52–60 8. Neumann-Haefelin T, Wittsack HJ,
Wenserski F, Siebler M, Seity RJ, Mödder U, Freund HL (1999) Diffu-sion- and perfuDiffu-sion-weighted MRI: the DWIPWI mismatch region in acute stroke. Stroke 30:1591–1597 9. Miller JC, Sörensen AG (2005)
Imaging biomarkers predictive of diseasetherapy outcome: ischemic stroke and drug development. In: Rudin M (ed) Imaging in drug discovery and development. Birkhäuser Basel, pp 319–356
10. Rudin M, Beckmann N, Porszasz R, Reese T, Sauter A (1999) In vivo magnetic resonance in pharmaceutical research: current status and
perspectives. NMR Biomed 12:69–97 11. Reese T, Porszasz R, Baumann D,
Bochelen D, Boumezbeur F, McAllister KH, Sauter A, Bjelke B, Rudin B (2000) Cytoprotection does not preserve brain functionality in rats during acute post-stroke phase despite evidence of non-infarction provided by MRI. NMR Biomed 13:361–370 12. Sauter A, Reese T, Pórszász R,
Baumann D, Rausch M, Rudin M (2002) Recovery of function in cytoprotected cerebral cortex in rat stroke model assessed by functional MRI. Magn Reson Med 47:759–765 13. Lehericy S, Marjanska M, Mesrob L,
Sarazin M, Kinkingnehun S (2007) Magnetic resonance imaging of Alzheimer’s disease. Eur Radiol 17(2):347–362
14. Schott JM, Price SL, Frost C, Whitwell JL, Rossor MN, Fox NC (2005) Measuring atrophy in Alzheimer disease: a serial MRI study over 6 and 12 months. Neurology 65:119–124 15. Jack CR Jr, Petersen RC, Xu YC,
O’Brien PC, Smith GE, Ivnik RJ, Boeve BF, Waring SC, Tangalos EG, Kokmen E. (1999) Prediction of AD with MRI-based hippocampal volume in mild cognitive impairment. Neurology 52:1397–1403
16. Rapoport SI, Hatanpaa K, Brady DR, Chandrasekaran K (1996) Brain energy metabolism, cognitive function and down-regulated oxidative phosphorylation in Alzheimer disease. Neurodegeneration 5:473–476 17. Yetkin FZ, Rosenberg RN, Weiner MF,
Purdy PD, Cullum CM (2006) FMRI of working memory in patients with mild cognitive impairment and probable Alzheimer’s disease. Eur Radiol 16:193–206
18. Mueggler T, Sturchler-Pierrat C, Baumann D, Rausch M, Staufenbiel M, Rudin M (2002) Compromised hemo-dynamic response in amyloid precursor protein transgenic mice. J Neuroscience 15:7218–7224
19. Ibach B, Haen E (2004) Acetylcholin-esterase inhibition in Alzheimer’s Disease. Curr Pharm Des 10:231–251 20. Kuhl DE, Koeppe RA, Minoshima S, Snyder SE, Ficaro EP, Foster NL, Frey KA, Kilbourn MR (1999) In vivo mapping of cerebral acetylcholinester-ase activity in aging and Alzheimer’s disease. Neurology 52:691–699 21. Shiraishi T, Kikuchi T, Fukushi K,
Shinotoh H, Nagatsuka S, Tanaka N, Ota T, Sato K, Hirano S, Tanada S, Iyo M, Irie T (2005) Estimation of plasma IC50 of donepezil hydrochloride for brain acetylcholinesterase inhibition in monkey using N-[11C]methylpiperidin-4-yl acetate ([11C]MP4A) and PET. Neuropsychopharmacology 30:2154–2161
22. Nordberg A, Lundqvist H, Hartvig P, Andersson J, Johansson M, Hellstrom-Lindahi E, Langstrom B (1997) Imaging of nicotinic and muscarinic receptors in Alzheimer’s disease: effect of tacrine treatment. Dement Geriatr Cogn Disord 8:78–84
23. Rombouts SA, Barkhof F, Van Meel CS, Scheltens P (2006) Alterations in brain activation during cholinergic enhancement with rivastigmine in Alzheimer’s disease. J Neurol Neurosurg Psychiatry 73:665–671 24. Rausch M, Gentsch C, Enz A,
Baumann D, Rudin M (2005) Char-acterization of CNS drugs by mapping changes in regional CBV in the rat: a study paradigm allowing for automated comparison of three-dimensional data obtained multiple imaging sessions. NMR Biomed 18:260–268
25. Benveniste H, Einstein G, Kim KR, Hulette C, Johnson GA (1999) Detec-tion of neuritic plaques in Alzheimer’s disease by magnetic resonance microscopy. Proc Natl Acad Sci USA 96:14079–14084
26. Zhang J, Yarowsky P, Gordon MN, Di Carlo G, Munireddy S, van Zijl PC, Mori S (2004) Detection of amyloid plaques in mouse models of Alzheimer’s disease by magnetic resonance imaging. Magn Reson Med 51:452–457
27. Klunk WE, Engler H, Nordberg A, Wang Y, Blomqvist G, Holt DP, Bergstrom M, Savitcheva I, Huang GF, Estrada S, Ausen B, Debnath ML, Barletta J, Price JC, Sandell J, Lopresti BJ, Wall A, Koivisto P, Antoni G, Mathis CA, Langstrom B (2004) Im-aging brain amyloid in Alzheimer’s disease with Pittsburgh Compound-B. Ann Neurol 55:306–319
28. Hintersteiner M, Frey P, Kinzy W, Kneuer R, Neumann U, Rudin M, Staufenbiel M, Wiederhold KH, Gremlich HU (2005) In vivo detection of amyloid deposits by near-infrared fluorescence imaging using a novel oxazine derivative as contrast agent. Nat Biotechnol 23:577–583
29. Verhoeff NP, Wilson AA, Takeshita S, Trop L, Hussey D, Singh K, Kung HF, Kung MP, Houle S (2004) In-vivo imaging of Alzheimer disease beta-amyloid with [11C]SB-13 PET. Am J Geriatr Psychiatry 12:584–595 30. Parvathy S, Davies P, Haroutunian V,
Purohit DP, Davis KL, Mohs RC, Park H, Moran TM, Chan JY, Buxbaum JD (2001) Correlation between A(x-40-, A (x-42-, and A(x-43-containing amyloid plaques and cognitive decline. Arch Neuro 58:2025–2032
31. Shields AF. Grierson JR, Kozawa SM, Zheng M (1996) Development of labelled thymidine analogues for im-aging tumor proliferation. Nucl Med Biol 23:17–22
32. Laverman P, Boerman OC, Corstens FHM, Oyen WJG (2002) Fluorinated amino acids for tumor imaging with positron emission tomography. Eur J Nucl Med 29:681–690
33. Hara T, Kosaka N, Shinoura N, Kondo T (1998) PET imaging of prostate cancer using carbon-11-choline. J Nucl Med 39:990–995
34. DeGrado TR, Coleman RE, Wang S, Baldwin SW, Orr MD, Robertson CN, Polascik TJ, Price DT (2000) Synthesis and evaluation of 18F labeled choline as an oncologic tracer for positron emission tomography: initial findings with prostate cancer. Cancer Res 61:110–117
35. Shields AF, Grierson JR, Kozawa SM, Zheng M (1996) Development of labeled thymidine analogs for imaging tumor proliferation. Nucl Med Biol 23:17–22
36. Carnochan P, Brooks R (1999) Radio-labelled 5′-iodo′2′deoxyuridine: a promising alternative to [18F]-2-fluoro-deoxy-D-glucose for PET studies of early response to anticancer treatment. Nucl Med Biol 26:667–672
37. Sato K, Kameyama M, Ishiwata K, Katakura R, Yoshimoto T (1992) Metabolic changes of glioma following chemotherapy: An experimental study using four PET tracers. J
Neuro-Oncol 14:81–89 38. Busch H, Davis JR, Honig GR,
Anderson DC, Nair PV, Nyhan WL (1995) The uptake of a variety of amino acids into nuclear proteins of tumors and other tissues. Cancer Res 19:1030–1039
39. Gillies RJ, Morse DL (2005) In vivo magnetic resonance spectroscopy in cancer. Annu Rev Biomed Eng 7:287–326
40. Hara T, Kosaka N, Shinoura N, Kondo T (1997) PET imaging of brain tumor with [methyl-11C]choline. J Nucl Med 38:842–847
41. Stroobants S, Goeminne J, Seegers M, Dimitrijevic S, Dupont P, Nuyts J, Martens M, van der Borne B, Cole P, Sciot R, Dumez H, Silberman S, Mortelmans L, van Oosterom A (2003) 18f Positron emission tomography for the early prediction of response in advanced soft tissue sarcoma treated with imatinib mesylate (Gleevec (r)). Eur J Cancer 39:2012–2020 42. Padhani AR, Krohn KA, Lewis JS,
Alber M (2006) Imaging oxygenation of human tumours. Eur Radiol. Oct 17; DOI10.1007s00330-006-0431-y
43. Padhani AR (2002) Dynamic contrast-enhanced MRI in clinical oncology: current status and future directions. J Magn Reson Imaging 16:407–422 44. Leach MO, Brindle KM, Evelhoch JL,
Griffiths JR, Horsman MR, Jackson A, Jayson GC, Judson IR, Knopp MV, Maxwell RJ, McIntyre D, Padhani AR, Price P, Rathbone R, Rustin GJ, Tofts PS, Tozer GM, Vennart W, Waterton JC, Williams SR, Workman P; PharmacodynamicPharmacokinetic Technologies Advisory Committee, Drug Development Office, Cancer Research UK (2005) The assessment of antiangiogenic and antivascular thera-pies in early-stage clinical trials using magnetic resonance imaging: issues and recommendations. Br J Cancer 92:1599–1610
45. Drevs J, Schneider V (2006) The use of vascular biomarkers and imaging stu-dies in the early clinical development of anti-tumour agents targeting angiogen-esis. J Int Medicine 260:517–529
46. Drevs J, Müller-Driver R, Wittig C, Fuxius S, Esser N, Hugenschmidt H, Konerding MA, Allegrini PR, Wood J, Hennig J, Unger C, Marmé D (2002) PTK787ZK 222584, a specific vascular endothelial growth factor receptor tyrosine kinases inhibitor, affects the anatomy of the tumor vascular bed and the functional vascular properties as detected by dynamic enhanced magnetic resonance imaging. Cancer Res 62:4015–4022
47. Rudin M, McSheehy PMJ, Allegrini PR, Kindler-Baumann D, Bequet M, Brecht K, Brueggen J, Ferretti S, Schaeffer F, Schnell C, Wood J (2005) PTK787ZK222584, a tyrosine kinase inhibitor of vascular endothelial growth factor receptor, reduces uptake of the contrast agent GdDOTA by murine orthotopic B16BL6 melanoma tumors and inhibits their growth in vivo. NMR Biomed 18:308–321
48. Morgan B, Thomas AL, Drevs J, Hennig J, Buchert M, Jivan A, Horsfield MA, Mross K, Ball HA, Lee L et al (2003) Dynamic contrast-enhanced magnetic resonance imaging as a biomarker for the pharmacological response of PTK787ZK 222584, an inhibitor of the vascular endothelial growth factor receptor tyrosine kinases, in patients with advanced colorectal cancer and liver metastases: results from two phase I studies. J Clin Oncol 21:3955–3964
49. Galbraith SM, Maxwell RJ, Lodge MA, Tozer GM, Wilson J, Taylor NJ, Stirling JJ, Sena L, Padhani AR, Rustin GJ (2003) Combretastatin A4 phos-phate has tumor antivascular activity in rat and man as demonstrated by dynamic magnetic resonance imaging. J Clin Oncol. 21:2831–2842
50. Robinson SP, McIntyre DJ, Checkley D, Tessier JJ, Howe FA, Griffiths JR, Ashton SE, Ryan AJ, Blakey DC, Waterton JC (2003) Tumour dose response to the antivascular agent ZD6126 assessed by magnetic resonance imaging. Br J Cancer. 88:1592–1597
51. Evelhoch JL, LoRusso PM, He Z, DelProposto Z, Polin L, Corbett TH, Langmuir P, Wheeler C, Stone A, Leadbetter J, Ryan AJ, Blakey DC, Waterton JC. (2004) Magnetic reso-nance imaging measurements of the response of murine and human tumors to the vascular-targeting agent ZD6126. Clin Cancer Res. 10:3650–3657