DOI 10.1007/s00422-012-0538-y O R I G I NA L PA P E R
From lamprey to salamander: an exploratory modeling study on
the architecture of the spinal locomotor networks in the
salamander
Andrej Bicanski · Dimitri Ryczko · Jean-Marie Cabelguen · Auke Jan Ijspeert
Received: 23 March 2012 / Accepted: 20 November 2012 / Published online: 6 March 2013 © Springer-Verlag Berlin Heidelberg 2013
Abstract The evolutionary transition from water to land required new locomotor modes and corresponding adjust-ments of the spinal “central pattern generators” for locomo-tion. Salamanders resemble the first terrestrial tetrapods and represent a key animal for the study of these changes. Based on recent physiological data from salamanders, and previous work on the swimming, limbless lamprey, we present a model of the basic oscillatory network in the salamander spinal cord, the spinal segment. Model neurons are of the Hodgkin– Huxley type. Spinal hemisegments contain sparsely con-nected excitatory and inhibitory neuron populations, and are coupled to a contralateral hemisegment. The model yields a large range of experimental findings, especially the NMDA-induced oscillations observed in isolated axial hemisegments and segments of the salamander Pleurodeles waltlii. The model reproduces most of the effects of the blockade of AMPA synapses, glycinergic synapses, calcium-activated potassium current, persistent sodium current, and h-current. Driving segments with a population of brainstem neurons yields fast oscillations in the in vivo swimming frequency range. A minimal modification to the conductances involved This article forms part of a special issue of Biological Cybernetics entitled “Lamprey, Salamander Robots and Central Nervous System”. A. Bicanski (
B
)· A. J. IjspeertBiorobotics Laboratory, School of Engineering, École Polytechnique Fédérale de Lausanne, Station 14, 1015 Lausanne, VD, Switzerland e-mail: [email protected]
http://biorob.epfl.ch D. Ryczko
Groupe de Recherche sur le Système Nerveux Central, Département de Physiologie, Université de Montréal, Montréal, QC H3C 3J7, Canada J.-M. Cabelguen
INSERM U862—Neurocentre Magendie, Motor System Diseases Team, Université de Bordeaux, 146 rue Leo Saignat,
33077 Bordeaux Cedex, France
in burst-termination yields the slower stepping frequency range. Slow oscillators can impose their frequency on fast oscillators, as is likely the case during gait transitions from swimming to stepping. Our study shows that a lamprey-like network can potentially serve as a building block of axial and limb oscillators for swimming and stepping in salamanders.
Keywords Locomotion · Central pattern generator · Segmental oscillators· Salamander · Lamprey
1 Introduction
Central pattern generators (CPGs), i.e., neural networks transforming simple inputs into precisely timed oscilla-tory signals, are recognized as good models of the neural infrastructure underlying vertebrate locomotion [for review, seeGrillner(2003,2006),Chevallier et al.(2008a); for mam-malian studies, seeMcCrea and Rybak(2008),Daun et al. (2009)]. Some studies suggest that the design of axial loco-motor CPGs is evolutionary conservative from limbless ver-tebrates to tetrapods [for review, seeKatz and Harris-Warrick (1999),Falgairolle et al.(2006),Ryczko et al.(2010b)]. This concept recasts the notion that once a well-functioning sys-tem has evolved, it is easier to modify it rather than to develop a new system from scratch.
In the endeavor to better understand the evolution of the vertebrate locomotor systems, the salamander plays an intriguing role. This tetrapod resembles the first terrestrial vertebrates and is regarded as an animal from which the evo-lutionary changes from aquatic to terrestrial locomotion can be inferred [Gao and Shubin(2001); for review, see Grill-ner and Wallén(1985),Cohen et al.(1988)]. Its repertoire of aquatic and terrestrial locomotor patterns shares similarities
both with limbless vertebrates and mammals [for review, see Cabelguen et al.(2010)]. The close resemblance between the swimming modes of lampreys (Williams et al. 1989) and sala-manders (Frolich and Biewener 1992;Delvolvé et al. 1997) has led to the notion that the neural infrastructure underlying salamander locomotion can—to a first approximation—be viewed as a lamprey nervous system extended by neural cen-ters for the limbs (Ijspeert 2001;Bem et al. 2003;Ijspeert et al. 2005,2007). Recent experimental data revealed that the global architecture of the salamander axial locomotor CPG is similar to that observed in lampreys but the detailed orga-nization of the network is unknown (Ryczko et al. 2010a).
Even in lower vertebrates the complexity of the ner-vous system renders it extremely difficult to identify and characterize all neurons at the pre-motoneuron level, that are functionally relevant to locomotion. In the well-studied lamprey this is evidenced by the co-existence of different models of the basic locomotor network. In the models by Grillner and co-workers the lateral inhibitory interneuron is no longer present [compareWallén et al.(1992) toKozlov et al. 2007,2009], while it is still featured in other lamprey models (Mullins et al. 2011). Nevertheless, modeling of the neural infrastructure for locomotion has been singularly suc-cessful for the lamprey.
For the salamander, neurophysiological data on spinal interneurons and sensory neurons is scarce. Here we present an exploratory study on the salamander axial CPG architec-ture based on a lamprey neuron model, extended to account for salamander-specific findings. This minimal axial sala-mander CPG model outlines one possibility of phylogenetic conservatism of axial locomotor network design. Using a sin-gle parameter set across all conditions the model can account for electrophysiological data obtained from isolated axial hemisegments and segments in the salamander Pleurodeles waltlii (Ryczko et al. 2010a). A priori many different config-urations of ionic channels could produce neural oscillators (Prinz et al. 2004). However, we take the fact that this model adequately reproduces a variety of pharmacological experi-ments with a single parameter set as indirect evidence that the underlying rhythm generating composition of ionic chan-nels is adequately represented to a first approximation.
The spinal neurons were built by minimally modifying low to intermediate complexity Hodgkin–Huxley models from studies on the lamprey locomotor system (Grillner et al. 1988; Brodin et al. 1991; Ekeberg et al. 1991; Hellgren et al. 1992; Wallén et al. 1992; Ekeberg 1993;Tråvén et al. 1993;Tegnér et al. 1997;Ullström et al. 1998;Kotaleski et al. 1999a,b;Kozlov et al. 2007,2009;Huss et al. 2007,2008). Spinal hemisegments contain 50 sparsely connected excita-tory neurons that project to 30 inhibiexcita-tory neurons. Inhibiexcita-tory neurons project to all neurons of the contralateral hemiseg-ment. Excitatory neurons target their contralateral counter-parts. When activated by a simulated NMDA bath,
hemiseg-ments produced in vitro-like frequencies that were faster than in segments. Similarly to biological data blocking recipro-cal inhibition between hemisegments led to the emergence of synchronous oscillations, enforced by excitatory cross-connections. Furthermore, blocking the calcium-dependent current (IKCaN), hyperpolarization-activated cation current
(Ih), persistent sodium current (INaP) or AMPA synapses
had effects on the frequency and duty cycle of oscillations corresponding to those observed experimentally.
Using the same parameter set, we were able to generate in vivo-like frequencies when activating the segmental net-work with a population of neurons mimicking the influence from the descending reticulospinal (RS) neurons. We show how the frequency range of a segment driven by RS neu-rons can be shifted to lower frequencies by modifying a sin-gle conductance and related calcium inflow and decay rates. With this modification, the segmental circuit could there-fore implement a simplified limb oscillator,1which is known to be slower than axial oscillators (Ijspeert et al. 2007). In addition we explore the modulation of these frequencies by varying the strength of the descending NMDA synapses and the strength of the adaptation current, since these might be accessible to the organism through the release of neuromod-ulators and/or a changing descending pathway configuration. Finally, we show that spinal networks with different intrin-sic frequencies can be coupled together and produce phase locked activity. This regime corresponds to the simplified limb oscillator imposing its lower frequency on the fast axial network, as is likely the case during gait transitions from swimming to stepping (Ijspeert et al. 2007).
2 Methods 2.1 The cell model
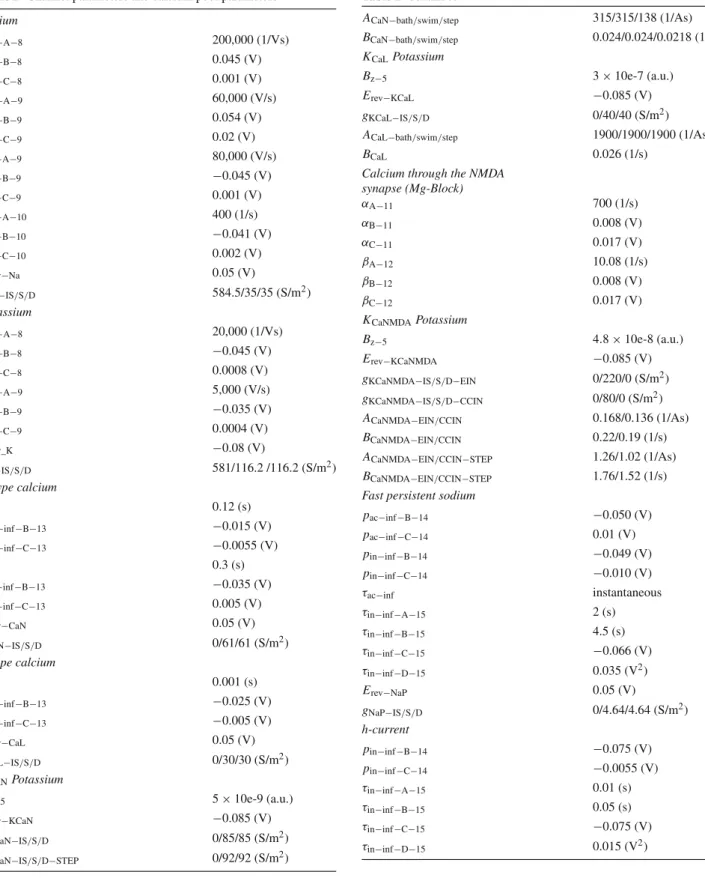
We base our neuron model on the lamprey models by Grill-ner, Ekeberg, and co-workers (Ekeberg et al. 1991;Wallén et al. 1992). The full details of the Hodgkin–Huxley cell model (Hodgkin and Huxley 1952), including passive prop-erties, equations and parameters are given in the Appendix and in Tables1and2. In brief: we adopt a geometry with an initial compartment endowed exclusively with a high den-sity of sodium and potassium channels, reminiscent of the axon hillock, a soma compartment, and one dendritic com-partment (cf. Fig.1A). The initial compartment is necessary to transform spike-like membrane potential oscillations that
1 Note that this limb oscillator is a caricature. Here, we are interested
only in the frequency range of oscillations. In the salamander, as in tetrapods in general, the limb CPG architecture might actually comprise many individual oscillators, e.g., for flexor and extensor muscle pairs. The architecture of the limb CPG is a separate and complex topic.
Table 1 Neuron parameters and network parameters
Neuron parameters
Default cell diameter 0.00003 (m)
gcore−IS/S 300 (S/m2) gcore−S/D 15 (S/m2) gleak 16.6 (S/m2) C 0.01 (F/m2) aS “Default” aIS 0.1*aS(m) aD 10*aS(m) Urest −0.070 (V) Synaptic parameters gEIN−EIN−AMPA/NMDA 0.0055/0.0034 (µS) gEIN−CCIN−AMPA/NMDA 0.0030/0.0080 (µS) gEINcontra−AMPA/NMDA 0.0039/0.0003 (µS) gCINNcontra−GLYC 0.0045 (µS) gEIN−EIN−AMPA/NMDA−(STEP) 0.0040/0.0091 (µS) gEIN−CCIN−AMPA/NMDA−(STEP) 0.0030/0.0080 (µS) gEINcontra−AMPA/NMDA−(STEP) 0.0078/0.0022 (µS) gCCINcontra−GLYC−(STEP) 0.0038 (µS) gRS−CPG−AMPA−(SWIM) 0.0064 (µS) gRS−CPG−NMDA−(SWIM) 0.0021 (µS) * wRSNMDA/0.26 gRS−CPG−AMPA−(STEP) 0.0056 (µS) gRS−CPG−NMDA−(STEP) 0.0018 (µS) * wRSNMDA/0.22 tAMPA/NMDA/GLYC 0.02/0.1/0.02 (s) Erev−AMPA/NMDA/GLYC 0/0/−0.085 (V) Bath parameters gb−NMDA−S 0.004 *Nrec(µS) Nrec 50 Connection densities
EINipsito EINipsi 10 (%)
EINipsito EINcontra 10 (%)
EINipsito CCINipsi 10 (%)
CCINipsito ALLcontra 14 (%)
CCINipsito ALLcontra−(STEP) 15 (%)
RS to ALL 55 (%)
Standard deviation (mean 1) for multiplication parameter variations ACaN−6 0.04 BCaN−6 0.04 gCaN−6 0.04 gKCaN−6 0.04 AKCaL−6 0.04 BKCaL−6 0.04 gCaL 0.04 gKCaL 0.04 NMDA level 0.04 ANMDA−6 0.04 Table 1 continued BNMDA−6 0.04 IRS−variance 0.5
All parameters are given in standard SI units. C refers to the capacitance,
a refers to the area of the neuron, g refers to the conductance,τ refers
to the synaptic decay constant. Nrecis the arbitrarily chosen sensitive
to the chemicals within the bath. Note, this number can be set to 1 by compensating with a higher NMDA level. The subscripts IS, S, and D refer to the initial neuronal segment, soma, and dendritic compartment, respectively. The subscripts ipsi and contra indicate the ipsilateral and contralateral sides of the segmental network in relation to each other. The subscripts AMPA, NMDA, GLYC (glycinergic), CCIN, EIN refer to the corresponding synaptic and cellular subtypes as described in Fig.1.
RS indicates simulated reticulospinal neurons, CPG or ALL indicates
all the neurons in the spinal segment. Hence a subscript of the type
RS-ALL indicates a value for connections from RS neurons to all segmental
neurons. IRSrefers to current injected into reticulospinal neurons. STEP
and SWIM indicate any parameters specific to one of the two descending drive setups. Numbers in subscripts refer to the target equations of parameters
do not always reach the full action potential amplitude into full action potentials, with a stereotypical amplitude of 70– 90 mV and a duration of 2–3 ms from onset to beginning repolarization. Similarly to the studies cited above the soma and dendritic compartment of the model cell are endowed with action potential generating sodium and potassium chan-nels, N- and L-type calcium channels as calcium sources for two distinct-associated calcium-dependent potassium chan-nels (KCa). The KCaL channel driven by the fast-acting
L-type channel constitutes a fast spike-triggered hyperpolar-izing current and extends the frequency range of tonic firing, while the slower N-type channel feeds the KCaN channel,
which plays the role of a delayed spike-triggered hyperpo-larising current as the main source of adaptation (cf. Fig.1B, c) (Gerstner and Kistler 2002;Izhikevich 2007). The pres-ence of N- and L-type calcium channels has been previously demonstrated in amphibians (Bischofberger and Schild 1995; Shen and Slaughter 1999;Perrier and Tresch 2004). In addi-tion, similarly to the studies byKotaleski et al.(1999a,b), Kozlov et al. (2007, 2009), Huss et al. (2007, 2008) we have included a potassium channel dependent on calcium entering a synaptic or bath-activated NMDA-gated chan-nel. A key hypothesis is that calcium-dependent potassium channels, activated by calcium entering the NMDA synapse, are functionally coupled (and possibly co-located) with the NMDA synapse, as observed in various brain regions in ver-tebrates (e.g., Faber et al. 2005; Ngo-Anh et al. 2005, see Sect. 4). Note that this coupling between synaptic calcium channels and related KCachannels is a long-standing,
exper-imentally supported feature of lamprey models (Wallén et al. 1992;Huss et al. 2007,2008), which we inherit due to our overall approach. In the lamprey this coupling remains the best model for NMDA-induced TTX-resistant membrane
Table 2 Channel parameters and calcium pool parameters Sodium αac−A−8 200,000 (1/Vs) αac−B−8 0.045 (V) αac−C−8 0.001 (V) βac−A−9 60,000 (V/s) βac−B−9 0.054 (V) βac−C−9 0.02 (V) αin−A−9 80,000 (V/s) αin−B−9 −0.045 (V) αin−C−9 0.001 (V) βin−A−10 400 (1/s) βin−B−10 −0.041 (V) βin−C−10 0.002 (V) Erev−Na 0.05 (V) gNa−IS/S/D 584.5/35/35 (S/m2) Potassium αac−A−8 20,000 (1/Vs) αac−B−8 −0.045 (V) αac−C−8 0.0008 (V) βac−A−9 5,000 (V/s) βac−B−9 −0.035 (V) βac−C−9 0.0004 (V) Erev_K −0.08 (V) gK−IS/S/D 581/116.2 /116.2 (S/m2) N-type calcium τac 0.12 (s) pac−inf−B−13 −0.015 (V) pac−inf−C−13 −0.0055 (V) τin 0.3 (s) pin−inf−B−13 −0.035 (V) pin−inf−C−13 0.005 (V) Erev−CaN 0.05 (V) gCaN−IS/S/D 0/61/61 (S/m2) L-type calcium τac 0.001 (s) pac−inf−B−13 −0.025 (V) pac−inf−C−13 −0.005 (V) Erev−CaL 0.05 (V) gCaL−IS/S/D 0/30/30 (S/m2) KCaNPotassium Bz−5 5× 10e-9 (a.u.) Erev−KCaN −0.085 (V) gKCaN−IS/S/D 0/85/85 (S/m2) gKCaN−IS/S/D−STEP 0/92/92 (S/m2) Table 2 continued
ACaN−bath/swim/step 315/315/138 (1/As)
BCaN−bath/swim/step 0.024/0.024/0.0218 (1/s)
KCaLPotassium
Bz−5 3× 10e-7 (a.u.)
Erev−KCaL −0.085 (V)
gKCaL−IS/S/D 0/40/40 (S/m2)
ACaL−bath/swim/step 1900/1900/1900 (1/As)
BCaL 0.026 (1/s)
Calcium through the NMDA synapse (Mg-Block) αA−11 700 (1/s) αB−11 0.008 (V) αC−11 0.017 (V) βA−12 10.08 (1/s) βB−12 0.008 (V) βC−12 0.017 (V) KCaNMDAPotassium Bz−5 4.8 × 10e-8 (a.u.) Erev−KCaNMDA −0.085 (V) gKCaNMDA−IS/S/D−EIN 0/220/0 (S/m2) gKCaNMDA−IS/S/D−CCIN 0/80/0 (S/m2)
ACaNMDA−EIN/CCIN 0.168/0.136 (1/As)
BCaNMDA−EIN/CCIN 0.22/0.19 (1/s)
ACaNMDA−EIN/CCIN−STEP 1.26/1.02 (1/As)
BCaNMDA−EIN/CCIN−STEP 1.76/1.52 (1/s)
Fast persistent sodium
pac−inf−B−14 −0.050 (V) pac−inf−C−14 0.01 (V) pin−inf−B−14 −0.049 (V) pin−inf−C−14 −0.010 (V) τac−inf instantaneous τin−inf−A−15 2 (s) τin−inf−B−15 4.5 (s) τin−inf−C−15 −0.066 (V) τin−inf−D−15 0.035 (V2) Erev−NaP 0.05 (V) gNaP−IS/S/D 0/4.64/4.64 (S/m2) h-current pin−inf−B−14 −0.075 (V) pin−inf−C−14 −0.0055 (V) τin−inf−A−15 0.01 (s) τin−inf−B−15 0.05 (s) τin−inf−C−15 −0.075 (V) τin−inf−D−15 0.015 (V2)
Table 2 continued
Erev−h −0.055 (V)
gh−IS/S/D 0/44.8/22.4 (S/m2)
Parameters for the gating variables of the spike-generating sodium and potassium channels correspond to the ones given inWallén et al.(1992). Parameters related to the activation and inactivation of the added chan-nels NaPand h are taken from Ref. (Izhikevich 2007). These correspond
to the values given in Ref. (Magee 1998;Magistretti and Alonso 1999). For the remaining channels the parameters are taken fromHuss et al.
(2007). Numbers in parameter subscripts indicate the target equation. Parameter subscripts ac and in specify whether the parameters are for activation and inactivation variables. Parameters named alpha and beta are used to obtain the components of Eq.3. The subscript inf indicates parameters for the calculation of asymptotic values according to Eq.4.
g refers to conductances, and Erevrefers to reversal potentials
oscillations. Hence, the associated NMDA-calcium pool (CaNMDA) is modeled as distinct from the CaLand CaNpools.
Long period oscillations (cf. Fig.1E) thus emerge as a con-sequence of the interplay between NMDA-induced plateau potentials and KCa channels co-located with the NMDA
synapse. Note that the period of NMDA-induced oscillations depends on multiple parameters: the ratio of calcium inflow and decay rates, the strength of the KCaNMDAconductance,
the strength of the NMDA bath, the strength of the NMDA synapse and the density of recurrent connections in the network.
Adding to the above studies we extended the model by the addition of a hyperpolarization activated h-current (Ih)
and a persistent sodium current (INaP) since it has been
demonstrated that blocking these channels can, respectively, slow down or abolish oscillatory behavior (Ryczko et al. 2010a). Ih was further demonstrated to be present in
sala-mander motoneurons (Chevallier et al. 2006, 2008b). The default diameter of our tentative salamander locomotor CPG interneurons was chosen as 30µm (Jovanovic and Burke 2004). The NMDA bath activation is implemented in a sim-ilar fashion as byWallén et al.(1992) as trans-membrane conductances modulated by a unitless quantity indicating the level of NMDA in the solution, mimicking a constant steady-state fraction of docked agonist. The NMDA conduc-tance is further multiplied by a variable modeling the voltage-dependent block of the NMDA-gated channel by magnesium. Synaptic communication is implemented via spike tracking. Upon detection of a spike in a presynaptic neuron a trans-membrane current in the target neuron activates and decays with a given time constant (cf. Table1). The synaptic delay is set to 1.5 ms, a stereotypical value for monosynaptic connec-tions and in the lower range of values reported for amphibians (Ovsepian and Vesselkin 2006). The frequency range of tonic spiking when a constant current is injected extends from 2 to roughly 90 Hz (cf. Fig.1C). The rheobase current is 0.84 nA for the given neuron size. Parameters for the h-current have been tuned to allow for the depolarizing overshoot typical for this current (cf. Fig.1D), as documented for
salaman-der motoneurons [Fig. 6 inChevallier et al.(2006)]. Finally, EPSPs have been modeled to have appropriate amplitudes and decay times (cf. Fig.1F) (Tråvén et al. 1993).
2.2 The network
Figure 1G depicts the isolated segmental network we modeled. As outlined in the introduction we forego the output elements, i.e., the motoneurons, and consider the activity of excitatory interneuron population as the raw axial locomotor-like CPG output. The network consists of two reciprocally coupled hemisegments—our fundamental building blocks of the locomotor CPG. One hemisegment consists of 50 sparsely interconnected excitatory neurons
C A B D E 100 ms 50 mV 1 2 3 0 50 100 I [nA] f [Hz] 250 ms 50 mV 250 ms a.u. 50 ms 5 mV 25 ms 0.2 mV AMPA + NMDA GLYC N I E N I E CCIN CCIN GLYC NMDA AMPA IS: Na, K SOMA: Na, K, CaN, CaL, KCaN, KCaL, NaP, h, nmda, KCaNMDA DEND: Na, K, CaN, CaL, KCaN, KCaL, NaP, h F G
Fig. 1 Neuronal properties of the CPG interneurons and network lay-out. A A geometric depiction the model neuron, the distribution of synaptic contacts and lists of membrane currents. B Two representa-tive spike trains (left to right, injected current 1.4 and 1.9 nA) with (upper two panels) and without the adaptation current (lower two
pan-els). C The spiking frequency in response to injected current calculated
from the first (dashed line), second (dotted line), and last (solid line) interspike interval. D Ih-mediated depolarizing overshoot after
hyper-polarization. E A typical NMDA-induced burst in an isolated neuron and the corresponding intracellular calcium concentration for calcium entering the NMDA synapse (in arbitrary units). F EPSPs due to AMPA (dashed curve, elicited in the dendrite), NMDA (solid curve, elicited in the soma) and mixed synapses (solid bold curve). See Appendix for the electrotonic properties of the dendrites. G Organization of the segmen-tal bursting network proposed for the salamander. Two hemisegments, each consisting of 50 excitatory interneurons (EINs) and 30 inhibitory interneurons (CCINs). Excitatory connections consist of AMPA and NMDA synapses. Inhibitory synapses represent glycinergic connec-tions (GLYC)
[EINs, after Wallén et al. (1992)], which also project to their contralateral counterparts since the findings by Ryczko and co-workers revealed the presence of excitatory cross-connections (Ryczko et al. 2010a). The connection density is 10 % and each synaptic contact consists of one AMPA and one NMDA synapse to the dendritic compartment and the soma, respectively. These EINs project to a pool of 30 inhibitory neurons [CCINs, afterWallén et al.(1992)] within the same hemisegment with 10 % connection density. If two hemisegments are coupled, the CCINs project with 14 % sparseness to all neurons on the contralateral side. The EINs project to their contralateral counterparts with a sparseness of 10 %, implementing the excitatory cross-connections. In an extension of this setup, we studied the network activated under conditions more akin to in vivo activity. We added a population 50 additional neurons that project to all segmen-tal neurons with a connection density of 55 %, representing a simple implementation of descending reticulospinal (RS) pathways driving the segmental population (Chevallier et al. 2004).
All model parameters are summarized in Tables 1 and 2. Since the connection densities are unknown, they have been chosen freely, i.e., tuned and frozen for all simulations, to obtain the present results. Various connection densities among and within the neuronal subpopulations were tested. The ratio between the number of EINs and CCINs was moti-vated by the study byCheng et al.(2002), which gives rough estimates for the number of contralaterally projecting neu-rons. The topology within the network is not known for the salamander and is inspired by published lamprey models (Wallén et al. 1992;Kozlov et al. 2007). However, cross exci-tatory projections have been restricted to targeting contralat-eral EINs in order to facilitate synchronous oscillations in the network when reciprocal inhibition is blocked (Ryczko et al. 2010a). This is a simplifying assumption due to the lack of motoneurons in the model, which could otherwise also be targets for excitatory cross-connections. It has been demonstrated that crossed excitatory connections target con-tralateral motoneurons or inhibitory interneurons in the lam-prey [Buchanan(1982),Buchanan and McPherson(1995), see alsoMahmood et al.(2009), for review seeRyczko et al. (2010b)]. The commissural projection to contralateral excitatory neuron remains to be demonstrated even in the lamprey. However in the zebrafish, anatomical data suggests that excitatory commissural interneurons active during slow swimming (the so-called multipolar commissural descend-ing interneurons, “MCoDs”) may excite each other through axon collaterals that are in close proximity to contralateral MCoD somata (McLean et al. 2008).
To add noise and to avoid discontinuities the NMDA level in the network rose smoothly with varying delays during the first second of the simulations. This was implemented by multiplying the NMDA level with a sigmoidal function that
reached saturation shortly after the onset of the simulation. The slope and offset of this function were set randomly for each neuron in the network, thus excluding a bias toward synchronization from the outset. The values for the conduc-tances, inflow and decay rates related to the different calcium subsystems (CaL, CaN, CaNMDA) were given a normally
dis-tributed spread around appropriate mean values (cf. Table1).
2.3 Quantification of locomotor parameters
Oscillations were smoothed with a running mean spanning 600 ms for slow NMDA-induced oscillations, and 50 ms for oscillations evoked by descending drive. Fourier spectra were calculated in order to reveal noteworthy frequency contribu-tions. The duty cycle is calculated as the active interval of this smoothed network output. The network is defined to be active when the smoothed network output reaches 38 % of the maximum amplitude of the oscillation. This threshold is chosen since it yields a duty cycle close to 50 % for seg-ments, in close agreement with visual inspection. The same threshold is then used throughout the data analysis. The cycle duration is identified as the average time between successive onsets of activity. 30 independent instances/individuals of segments (similarly for hemisegments) were used to estimate the mean period of oscillations and their standard deviations, the duty cycles and the stability (see below). Within one type of numerical experiment (e.g., hemisegments under control conditions or hemisegments with a simulated pharmacolog-ical channel block), an independent instance constitutes a separate simulation under identical conditions with a newly drawn set of random numbers for all parameters that exhibit a stochastic spread within the neuronal population. These iterations can be thought of a separate individuals. Cycle durations, duty cycles and the stability scores (see below) were averaged across instances.
To measure the stability of the segmental and hemiseg-mental rhythms we computed autocorrelograms on the aver-age membrane potential trace of the left excitatory neuron population (EINs). A time window of the first 40 s was cross-correlated with progressively time-shifted versions of itself. The absolute value of the first peak-to-through difference in the correlogram—the peak-to-through correlation coefficient (henceforth ptcc)—was used as an estimate the rhythmic sta-bility [see Ryczko et al.(2010a),Madriaga et al. (2004)]. Mean values close to 2 and low standard deviations indicate stable oscillations while values closer to zero and high stan-dard deviations indicate less stable oscillations.
2.4 Implementation
All simulations and data analyses have been implemented and carried out in Mathworks Matlab 64 bit version 7.13
under Ubuntu Linux version 10.04 on a Dell Precision T3500 and a local computing cluster with 88 processing cores run-ning Ubuntu Linux version 10.04.
3 Results
In the data set ofRyczko et al.(2010a) the cycle duration for NMDA induced oscillations ranged from 4.53± 1.26 to 11.38± 2.04 s for segments and 3.43 ± 0.63 to 6.78 ± 1.68 s for hemisegments bathing in the same NMDA concentration. The variations in cycle duration are most likely due to varia-tions in binding of the perfused NMDA between preparavaria-tions or possibly due to the dominance of individual oscillators if multiple oscillators with different intrinsic frequencies exist in each hemisegment. Due to the large spread we set the refer-ence value for the cycle duration of NMDA-induced oscilla-tions as the mean experimentally observed period and aimed to reproduce the relative changes as compared to experimen-tal data (Ryczko et al. 2010a). Numerical results are given as mean values± standard deviation across 30 independent instances of the same simulation setup.
3.1 Isolated hemisegments generated rhythmic motor activity
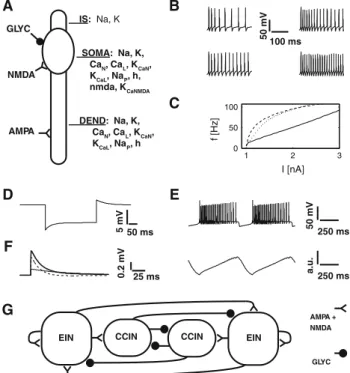
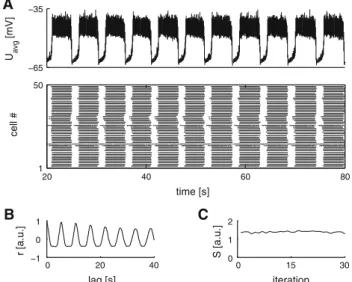
Throughout the simulations the NMDA stimulation was set to 900 in arbitrary units with normally distributed variations among neurons for each simulation (cf. Table1). In isolated hemisegments this produced oscillations with a period of 2.81± 1.12 s, with a duty cycle of 69.40 ± 30.03 % (burst duration 1.95± 0.85 s). Figure 2A shows a representative plot of the mean activity of the EIN subpopulation and the corresponding raster plot. The oscillation was generated by the temporal overlap of individually bursting neurons (cf. Fig.2B). Figure2C shows the autocorrelogram of the repre-sentative sample. The averaged measure of rhythmic stabil-ity (the ptcc) was estimated at 1.26± 0.47. Figure2D shows the ptcc across all 30 instances of the hemisegment under control conditions. Three large drops in stability are notice-able. These drops correspond to three out of 30 instances that exhibited a very noisy signal. These “outlying regimes” seem to correspond to some cases observed in vitro (Ryczko et al. 2010a). Interestingly, these cases allow for an additional test of the present model (cf. Fig.7). For isolated hemisegments under control condition these cases led to grossly underes-timated cycle durations and duty cycles. Without those the oscillation period would be estimated at 3.32± 0.66 s, with a duty cycle of 69.88± 15.36 % (2.32 ± 0.51 s), and the ptcc would increase to 1.39± 0.22. The experimentally mea-sured mean cycle duration for hemisegments in the study by Ryczko et al.(2010a) was 4.89± 0.95 s. The mean duty cycle was 77.12± 10.10 % (3.72 ± 0.74 s). A B C D −65 −35 U avg [mV] 20 40 60 80 1 50 time [s] cell # 1 s 50 mV 0 20 40 −1 0 1 lag [s] r [a.u.] 0 15 30 0 1 2 iteration S [a.u.]
Fig. 2 NMDA-activated isolated hemisegment. A A representative average membrane potential trace of the hemisegmental EIN pop-ulation (NMDA level 900 in arbitrary units) from one of the 30 instances/individuals calculated for the statistical analysis and a raster plot of the same hemisegmental EIN population. B Model output for single EINs in different bursting regimes. C The autocorrelogram con-structed from the representative average membrane potential trace in (A) in order to estimate rhythmic stability. D The pptc stability mea-sure across 30-independent instances of hemisegments under control conditions
3.2 Isolated axial segments generated left-right alternating motor patterns
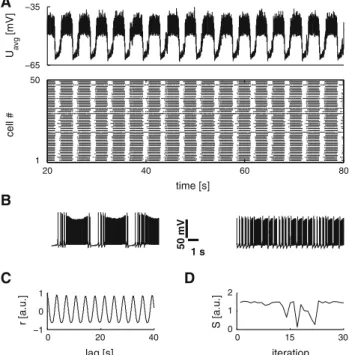
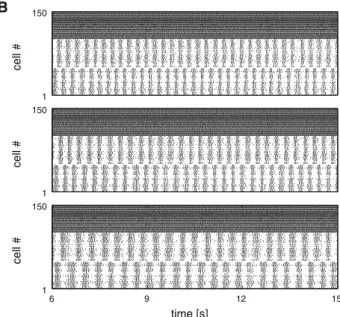
Connecting two hemisegments with excitatory cross-connections and reciprocal inhibition yielded an oscillat-ing segment that generated alternatoscillat-ing bursts of activity. Figure3A shows a representative plot of the mean activity of the left and right EIN subpopulations and the corresponding raster plot. The mean cycle period was 8.84± 0.85 s, with a duty cycle of 49.66± 5.77 % (4.39 ± 0.51 s). Due to the inherent symmetry the duty cycle fluctuated around 50 %. Ryczko et al.(2010a) measured 8.08± 1.92 s for segments with a mean duty cycle of 73.93± 7.29 % (5.76 ± 1.60 s). Figure3B shows representative spike traces from the left and right EIN subpopulations. The autocorrelogram of the repre-sentative sample is shown in Fig.3C. The average ptcc was 1.83± 0.14 for the segmental oscillations. These were gen-erally more pronounced and stable (yielding a higher score and less variability) than hemisegmental oscillations as is also apparent from a comparison between the representa-tive waveforms (Figs.2A,3A) and stability across iterations (Figs.2D,3D).
A B C D −65 −35 −65 −35 U avg [mV] 20 40 60 80 1 100 time [s] cell # 1 s 50 mV 0 20 40 −1 0 1 lag [s] r [a.u.] 0 15 30 0 1 2 iteration S [a.u.]
Fig. 3 NMDA-activated isolated segment. A A representative aver-age membrane potential trace of the left and right hemisegmen-tal EIN populations (NMDA level 900 in arbitrary units) from one of the 30 instances/individuals calculated for the statistical analysis and a raster plot of the same populations. B Represen-tative model output for single EINs in different bursting regimes. C The autocorrelogram constructed from the representative average membrane potential trace in (A) in order to estimate rhythmic stabil-ity. D The ptcc stability measure across 30-independent instances of segments under control conditions
For both the model and the experiments isolated ments oscillated faster than complete segments. The hemiseg-mental period amounted to 31.78± 12.67% (37.56 ± 7.47% without the outlying regimes) of the average segmental period, compared to the experimental findings of 60.52± 11.76 %.
3.3 Suppressing synaptic transmission
Figure 4 shows representative average membrane poten-tial traces of the left and right segmental EIN subpopula-tions where the inhibitory cross-connecsubpopula-tions were turned off 80 s into the simulations (and reestablished at 120 s). Synchronous left and right oscillations emerged rapidly, which strongly resemble the waveforms observed for hemisegments. Turning the reciprocal inhibition back on reestablished the standard segmental regime. Segmental
oscillations were unaffected by the excitatory cross-connections due to the overwhelming influence of the inhibitory synapses. Blocking glycinergic synapses in the present model had no effect on isolated hemisegments since there was no connection from CCINs to EINs in the same hemisegment. Without inhibition a segment acted like two synchronized hemisegments.
Figure5A–E shows from left to right representative wave-forms, raster plots and Fourier spectra for the hemisegmental network with decreasing strength of the AMPA synapses. The hemisegmental rhythm disappeared completely in 53.33 % of the 30 iterations under full AMPA blockade (synaptic weight set to zero, Fig.5E) and was markedly distorted in the remain-ing iterations (ptcc 0.75± 0.65). Similarly to the experimen-tal data the stability of the rhythm decreased with decreasing AMPA synapse strength. The segmental rhythm (not shown) continued to exhibit anti-phase oscillations imposed by the strong reciprocal inhibition. In the absence of reciprocal inhibition NMDA-evoked EPSPs alone were not sufficient to elicit bursting activity in the network. At least in hemiseg-ments the fast AMPA synapses were necessary as an addi-tional depolarizing component and as a means to facilitate synchronization.
3.4 The effect of channel blocks
Figure 6A shows a representative plot of the mean activ-ity of the hemisegmental EIN subpopulation and the corre-sponding raster plot where IKCaNhas been blocked.
Block-ing this current has an effect similar to the experimentally observed effect of apamine (Ryczko et al. 2010a). Impor-tantly the average ptcc increased and showed less variability (1.37 ± 0.04, cf. Fig.6C), showing that the rhythmic sta-bility increased with respect to isolated hemisegments under control conditions. The cycle duration and duty cycle for hemisegments were 5.01 ± 0.86 s, and 74.85 ± 13.77 % (3.75± 0.96 s), respectively. Comparing to hemisegments under control conditions with removed outlying regimes, the variability of the ptcc still decreased. Furthermore, the simulated application of apamine to these outlying regimes allowed for the test of the model under an additional con-dition. Ryczko et al. (2010a) reported that hemisegments activated by NMDA could sometimes fail to exhibit oscil-lations, but that application of apamine led to the emergence of oscillations in these cases. Figure7shows that the model reproduces this effect. The simulated addition of the apamine to the NMDA-bath halfway through the simulations trans-formed noisy, non-rhythmic hemisegment activity into clean oscillations.
In the segmental case, the simulated application of apamine (Fig. 8) lead to an increase in cycle duration (10.66± 1.20 s). The duty cycle remained largely unchanged at 50.00± 6.47 % (5.33 ± 0.69 s). The stability measure
−65 −35 −65 −35 U av g [mV] 10 70 130 190 1 100 time [s] cell #
Fig. 4 The effect of glycinergic inhibitory cross-connections. A repre-sentative average membrane potential trace of segmental left and right EIN populations where the inhibitory cross-connections are turned off
at the 80 s mark and reinitialized at the 120 s mark (dashed lines). The
lower panel shows the corresponding raster plot
A B C D E −65 −35 Uavg [mV] 1 50 cell # 0.01 1 100 s [a.u.] −65 −35 Uavg [mV] 1 50 cell # 0.01 1 100 s [a.u.] −65 −35 Uavg [mV] 1 50 cell # 0.01 1 100 s [a.u.] −65 −35 Uavg [mV] 1 50 cell # 0.01 1 100 s [a.u.] 20 40 60 80 −65 −35 time [s] Uavg [mV] 20 40 60 80 1 50 time [s] cell # 0.1 1 10 0.01 1 100 f [Hz] s [a.u.]
Fig. 5 The effect of suppressing the excitatory AMPA synapse in hemisegments. A–E A representative average membrane potential trace of the spiking activity of hemisegmental EIN population, the corre-sponding raster plot and the Fourier spectrum of the average membrane
potential for 100 % (ptcc 1.51), 75 % (ptcc 1.56), 50 % (ptcc 1.51), 25 % (ptcc 0.62), and 0 % (ptcc 0.37) strength of the default synaptic AMPA weight
A B C −65 −35 Uavg [mV] 20 40 60 80 1 50 time [s] cell # 0 20 40 −1 0 1 lag [s] r [a.u.] 0 15 30 0 1 2 iteration S [a.u.]
Fig. 6 NMDA-activated isolated hemisegment with IKCaNblocked.
A A representative average membrane potential trace of the hemiseg-mental EIN population (NMDA level 900 in arbitrary units) from one of the 30 instances/individuals calculated for the statistical analy-sis and a raster plot of the same hemisegmental EIN population. B The autocorrelogram constructed from the representative average membrane potential trace in (A) in order to estimate rhythmic stabil-ity. C The pptc stability measure across 30-independent instances of hemisegments with IKCaNblocked
A B C −65 −35 Uav g [mV] −65 −35 Uav g [mV] 20 40 60 80 −65 −35 Uav g [mV] time [s]
Fig. 7 Noisy isolated hemisegments with delayed simulated addition of apamine to the NMDA-bath. A–C Oscillations emerge in noisy instances (individuals 14, 17, 22) of isolated hemisegments under con-trol conditions after the delayed simulated addition of apamine (dashed
line) to the NMDA-bath (NMDA level 900 in arbitrary units)
yielded a ptcc value of 1.85± 0.08. The increase in rhyth-mic stability in the segmental case was not pronounced since segmental oscillations were already very stable under con-trol conditions (see Sect. 4). Ryczko et al. (2010a) mea-sured 9.42± 2.28 s for segments with a mean duty cycle of 64.3± 7.09 % (5.95 ± 0.94 s).
Blocking Ih in addition to IKCaN (corresponding to the
application of apamine and ZD 7288) yielded results in line with the expected effect of the Ih(not shown). Except
A B C −65 −35 −65 −35 U avg [mV] 20 40 60 80 1 100 time [s] cell # 0 20 40 −1 0 1 lag [s] r [a.u.] 0 15 30 0 1 2 iteration S [a.u.]
Fig. 8 NMDA-activated isolated segment with IKCaN blocked. A A
representative average membrane potential trace of the left and right hemisegmental EIN populations (NMDA level 900 in arbitrary units) from one of the 30 instances/individuals calculated for the statistical analysis and a raster plot of the same populations. B The autocorrelo-gram constructed from the representative average membrane potential trace in (A) for the estimation of rhythmic stability. C The pptc stabil-ity measure across 30-independent iterations of segments with IKCaN
blocked
for a longer cycle duration the results closely resembled the corresponding apamine results (cf. Figs. 6, 8). Com-pared to the apamine case the hemisegmental cycle duration increased to 5.65± 0.81 s. The duty cycle decreased slightly to 69.20 ± 10.62 % (3.91 ± 0.6 s) and the stability score increased to 1.55± 0.67. Segments with blocked h and KCaN
currents remained largely unchanged, with an average cycle duration of 10.83± 1.06 s, a duty cycle of 48.48 ± 5.00 % (5.25± 0.54 s) and a stability score of 1.80 ± 0.10.
Finally, in accordance with the observation that NaP can
control the excitability at sub-threshold potential (Llinás 1980;Stafstrom et al. 1982; Llinás 1988)—and the results reported byRyczko et al.(2010a)—the simulated blockade of the NaP current with riluzole abolished bursting in both
segments and hemisegments in our simulations. The NMDA-induced depolarization was insufficient to induce oscillations if the background elevation of the membrane potential and the increased excitability due NaPwere removed (not shown). As
such, INaPcan control cellular rhythmic properties by
3.5 In vivo-like rhythms
The above results reflect in vitro activity of the basic sala-mander spinal networks. In vivo the salasala-mander (Pleurodeles waltlii) exhibits two primary locomotor modes [for review, seeChevallier et al.(2008a)]. Stepping frequencies have been observed between 0.39 and 1.66 Hz, while swimming fre-quencies range from 1.33 to 4.37 Hz (Chevallier et al. 2004). For individual animals these frequency ranges usually do not overlap and also depend on body size. Both these frequency ranges lie notably above frequencies typically observed in vitro in fictive locomotion experiments (Ryczko et al. 2010a). To investigate how in vivo-like rhythms might be gener-ated, while preserving the in vitro results reported above, we added a separate neuronal population of 50 RS neurons with excitatory glutamatergic projections to all CPG interneurons (density 55 %) (Buchanan and Grillner 1987;Brodin et al. 1988; Ohta and Grillner 1989; Brocard and Dubuc 2003; Chevallier et al. 2004). The default segmental network used throughout the reproduction of experimental findings was not modified for this. No parameters were changed. RS neu-rons were driven with a constant input current with normally distributed variations in strength. Numerous parameter com-binations were tested in order to determine the broadest range of fast frequencies obtainable with a simple scaling law. These parameters included the descending connection
densi-ties, variations in synaptic strength and target compartment for descending AMPA and NMDA synapses, drive current strength and variance to the RS population, and varying the strength of the KCaNcurrent in the spinal neurons (mimicking
the release of neuromodulators).
Figures9and10summarize the results. The broadest and most stable in vivo range of high frequencies (2.33± 0.52 Hz to 3.90± 0.23 Hz) was obtained by scaling the strength of KCaN current. Scaling down this current reduced its
capa-bility to contribute to burst termination and thus prolonged the oscillation. However, a similar frequency range could be achieved by scaling the strength of the descending NMDA synapse (2.39± 0.55 Hz to 3.90 ± 0.23 Hz). Weaker NMDA synapses produce weaker NMDA EPSP plateaus (Wallén et al. 1992;Tråvén et al. 1993) and thus less calcium needed to accumulate to terminate the burst. Note that the NMDA– calcium-dependent burst termination only constitutes one contributing factor to burst termination under these in vivo-like conditions. Although it dominates when the neurons are activated by the NMDA bath, the adaptation current IKCaN
becomes more important when neurons are activated by descending drive. Segmental oscillations then rely on escape from contralateral inhibition and oscillations cease when the inhibition is blocked.
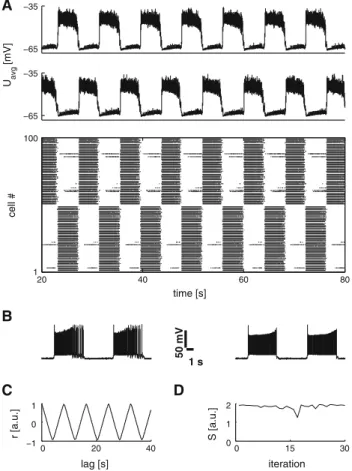
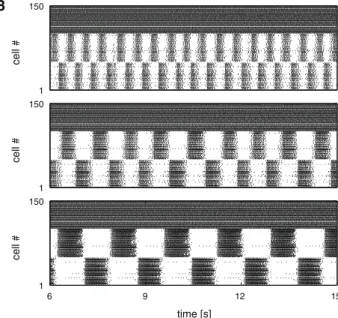
Figure9A shows three representative average membrane potential traces of the left EIN subpopulation, corresponding
B A C −65 −35 1 150 cell # −65 −35 U avg [mV] 1 150 cell # 6 9 12 15 −65 −35 time [s] 6 9 12 15 1 150 time [s] cell # 40 60 80 100 1.5 3.0 4.5 gKCaN [%] f [Hz] 0.38 0.34 0.30 0.26 wRSnmda
Fig. 9 Segments activated by descending drive generated high frequency oscillations in the in vivo swimming range. A Three repre-sentative average membrane potential traces of the left segmental EIN populations (reticulospinal population activated by 1.7 nA-injected cur-rent). Segmental frequencies and IKCaNmodulation in spinal neurons
top to bottom are 3.69 Hz at 100 % IKCaN, 3.19 Hz at 75 % IKCaN, and
2.5 Hz at 50 % IKCaN. B Raster plots of spinal (inhibitory neurons not
shown) and reticulospinal populations, top to bottom corresponding
to the membrane potential traces in A. Cells 1–100 depict the spinal population, cells 101–150 depict the driving reticulospinal popula-tion. C (left) Frequency of the segmental network oscillations as a function of the IKCaNmodulation; (right) Frequency of the
segmen-tal network oscillations as a function of the strength of the descend-ing NMDA synapse.wRSnmdaindicates the multiplicative factor to the
default NMDA weight. Error bars indicate the standard deviation across 30 instances/individuals
B A C −65 −35 1 150 cell # −65 −35 Uavg [mV] 1 150 cell # 6 9 12 15 −65 −35 time [s] 6 9 12 15 1 150 time [s] cell # 40 60 80 100 0.5 1.5 2.5 gKCaN [%] f [Hz] 0.28 0.26 0.24 0.22 wRSnmda
Fig. 10 Segments activated by descending drive generated low fre-quency oscillations in the in vivo stepping range. A Three representative average membrane potential traces of the left segmental EIN popula-tions (reticulospinal population activated by 1.6 nA-injected current). Segmental frequencies and IKCaNmodulation in spinal neurons top to
bottom are 2.19 Hz at 100 % IKCaN, 1.04 Hz at 70 % IKCaN, and 0.60 Hz
at 40 % IKCaN. B Raster plots of spinal (inhibitory neurons not shown)
and reticulospinal populations, top to bottom corresponding to the
mem-brane potential traces in (A). Cells 1–100 depict the spinal population, cells 101 through 150 depict the reticulospinal population. C (left) Fre-quency of the segmental network oscillations as a function of the IKCaN
modulation; (right) Frequency of the segmental network oscillations as a function of the strength of the descending NMDA synapse.wRSnmda
indicates the multiplicative factor to the default NMDA weight. Error
bars indicate the standard deviation across 30 instances/individuals
to three examples from the range of high frequencies (3.69 Hz at 100 % IKCaN, 3.16 Hz at 75 % IKCaN, and 2.50 Hz at
50 % IKCaN). Figure9b shows the corresponding raster plots,
including the RS population. Figure9c shows the relation-ship between the frequency of segmental oscillations and the strength of the KCaNcurrent or the strength of the
descend-ing NMDA synapse, respectively. The KCaLcurrent remained
unchanged in all cases. Most neurons fired bursts of variable length and both KCaNand KCaNMDAchannels contributed to
burst termination. This was in line with the fact that both the descending NMDA synapse and the strength of the KCaN
current could be used to scale the oscillation frequency. To generate oscillations in the lower in vivo stepping fre-quency range a minor modification to the segmental neurons was added. The CaNcalcium inflow was reduced, thus
reduc-ing its contribution to burst termination and the CaNMDA
calcium inflow and decay rates were slightly increased (cf. Table1). These minimal modifications allowed for the emer-gence of the lower frequency range akin to the range observed in vivo for stepping (0.74± 0.24 Hz to 2.37 ± 0.43 Hz, with IKCaNscaling, 0.63± 0.19 Hz to 2.37 ± 0.43 Hz, with
scal-ing of the descendscal-ing NMDA synapse). Figure10A shows three representative average membrane potential traces of the left EIN subpopulation, corresponding to three example frequencies from the range of lower frequencies (2.19 Hz at 100 % IKCaN, 1.04 Hz at 70 % IKCaN, and 0.60 Hz at 40 %
IKCaN). Figure 10B shows the corresponding raster plots,
including the RS population. Figure10C shows the relation-ship between the frequency of segmental oscillations and the strength of the KCaNcurrent or the strength of the descending
NMDA synapse respectively.
While a priori a possibility, the scaling of the NMDA synapse would imply that more NMDA EPSPs lead to slower oscillations. Thus to reconcile the present NMDA-dynamics (after Wallén et al. (1992)) with the experimental datum that the spiking frequency of RS neurons correlates posi-tively with the locomotor frequency in lampreys (Brocard et al. 2010) and likely also in salamanders (Cabelguen et al. 2003) we conducted further simulations where the NMDA– calcium inflow rate scaled heuristically with RS frequency. This resulted in a non-linear increase of calcium inflow at the NMDA synapse with increasing NMDA stimulation (see Huss et al.(2008) for a related mechanism). Other hypotheses are outlined in Sect.4. Figure11A shows three representative raster plots for stepping-like frequencies. The RS population was activated by 1.7, 2.0, and 2.3 nA injected current, respec-tively. In response to these injected currents, RS neurons dis-charged at a mean frequency of 49.0, 62.5, and 75.8 Hz. The corresponding segmental frequencies were 0.63, 0.90, and 1.20 Hz. Figure11B shows the resulting positive corre-lation between the current injected into the RS neurons, the mean RS spiking frequency, and the segmental frequency for
A B 4 5 6 7 1 150 time [s] cell # 1 150 cell # 1 150 cell # 1.7 2 2.3 0.8 1.8 2.8 I RS [nA] f [Hz]
Fig. 11 Increasing the reticulospinal (RS) drive increased the oscil-lation frequency in segments with scaled NMDA–calcium inflow A three representative raster plots of the segmental EIN populations (retic-ulospinal population activated by 1.7, 2.0, and 2.3 nA injected cur-rent, respectively, corresponding to mean RS spiking frequencies of 49.0, 62.5, and 75.8 Hz). Segmental frequencies top to bottom are 0.63, 0.90, and 1.20 Hz (in vivo stepping range, CaNMDAdecay scales
linearly). Cells 1–100 depict the spinal population, cells 101 through 150 depict the reticulospinal (RS) population. B Frequency of the seg-mental network oscillations as a function of the current injected into reticulospinal neurons. Non-linear CaNMDA-inflow scaling of spinal
neurons without (bold line), and with added linear CaNMDA-decay
scaling (regular). Error bars indicate the standard deviation across 30 instances/individuals
a non-linearly scaling calcium inflow (cf. Appendix) with and without additional linear scaling of the NMDA-calcium decay. All parameters were the same as for Fig.10(including RS neurons). The AHP strength stayed constant at 50 % of its default value, wRSnmdawas set to 0.24.
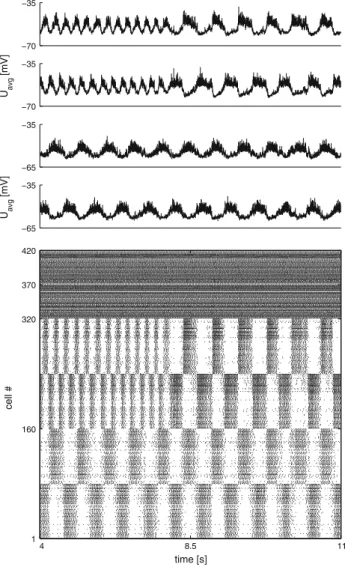
Finally, as a proof of concept we coupled two segments, one was initialized with parameters corresponding to low fre-quencies (simplified limb oscillator—cf. footnote 1) and one with the default/fast frequency configuration (axial oscilla-tor). This setup was based on the fact that during stepping the frequency of the whole locomotor network (the limb net-works and the axial network) is low. In other words, the slow stepping frequencies are imposed on the axial network. A simple excitatory connection (density 14 %) from the limb
−70 −35 −70 −35 U avg [mV] −65 −35 −65 −35 U avg [mV] 4 8.5 11 1 160 320 370 420 time [s] cell #
Fig. 12 Two segments with unidirectional coupling from a limb segment to an axial segment. The raster plot shows the activity of two segments activated by their respective driving populations. Cells 1 through 160 represent a segment with parameters set to reproduce slow stepping-like frequencies (here 1.62 Hz). Cells 161 through 320 represent a segment with parameters set to reproduce fast swimming-like frequencies (here 3.54 Hz). Cells 321 through 420 represent the driving populations. At the 6 s mark, unidirectional connections from the putative limb segment to the axial segment are turned on and the slow limb frequency is imposed on the fast axial segment. Left limb EINs project to the entire left axial hemisegment. Right limb EINs project to the entire right axial hemisegment
EIN populations to their axial counterparts was sufficient to impose the slow stepping frequencies on the axial segment. Figure12shows how the axial segment switched immedi-ately to the slower frequency when coupling was enabled. The obvious interpretation is that this might represent a cou-pling from limb neuron pools to axial neuron pools since during stepping the low frequencies need to be imposed on the axial networks, which exhibit faster intrinsic frequencies.
4 Discussion
This study shows that a lamprey spinal motor network can be transformed into a corresponding salamander network at the cellular level. This supports the notion that was already expressed by our previous experimental (Ryczko et al. 2010a) and modeling studies [(Ijspeert 2001; Bem et al. 2003; Ijspeert et al. 2005, 2007; Harischandra et al. 2011), for review, seeIjspeert(2008)], namely that the mid-trunk net-work of the salamander resembles a lamprey-like swimming network and can be modeled accordingly. Comparing data across many species, the high-level similarities in the organi-zation of the axial locomotor CPG across species such as the lamprey [for review, seeGrillner(2003)], the zebrafish [for review, seeFetcho and McLean(2010)], the Xenopus embryo [(Kahn and Roberts 1982;Roberts and Tunstall 1990); for review, seeRoberts et al.(2010)], reveal that common prin-ciples can be traced among vertebrates [for review, seeKatz and Harris-Warrick(1999),Orlovsky et al.(1999),Ryczko et al.(2010b)]. However, many different configurations of ionic channels can produce neural oscillators (Prinz et al. 2004). Thus, the present model only represents one possibil-ity for the salamander until it is validated by pre-motoneuron recordings. Nevertheless, we take the fact that the model adequately reproduces a large number of pharmacological experiments (Ryczko et al. 2010a) with a single parameter set (i.e., the model is not retuned from one set of results to the other) as indirect evidence that the underlying rhythm generating composition of ionic channels adequately cap-tures the mechanisms underlying the locomotor CPG oscil-lations in the salamander to a first approximation. Notably the choice of a NMDA-plateau-based oscillator, that was key to the reproduction of in vitro physiological data, did not impede the emergence of fast, in vivo-like oscillations (see Sect.4.5).
4.1 Reproducing physiological data
The present model reproduces key physiological findings and provides explanations at the cellular level. The effects of blocking glycinergic and AMPA receptors, specific ionic currents (Ih, IKCaN, INaP) and the relationships between
seg-mental and hemisegseg-mental rhythms are largely reproduced. The main discrepancies are found for segments with blocked AMPA synapses, where oscillations persist, and the rela-tion between segmental and hemisegmental duty cycles (see also Sect. 4.2). The imperfect match of the duty cycle in hemisegments on the other hand—though a priori a tunable parameter—is the result of a trade-off with the reproduction of the pharmacological findings. Increasing the duty cycle is equivalent to weakening the hyperpolarizing components (through modifying inflow and decay rates and the strength of the KCaNMDAchannel). However after blocking the KCaN
channel in order to reproduce the apamine results Ryczko et al.(2010a) the weakened remaining hyperpolarizing com-ponents can be too weak to stop bursting and tonic activity emerges.
We implemented salamander spinal hemisegments as a sparsely connected population of excitatory neurons. Such a recurrently interconnected network may also account for rhythmogenesis in the lamprey spinal cord (Buchanan and Grillner 1987; Buchanan et al. 1989; Parker and Grillner 2000) and hemicord (Cangiano and Grillner 2003, 2005), as well as in the locomotor network of the Xenopus embryo [Dale and Roberts (1985),Soffe (1989), Li et al. (2006), for review see Roberts and Perrins (1995)]. The model neurons are not intrinsically bursting neurons when cur-rent is injected. Rather the minimal pacemaker unit is a set of two neurons coupled with NMDA synapses or an isolated neuron under NMDA bath activation. The neu-rons possess two fast calcium pools, which extend the fre-quency range of tonic firing and provide adaptation as well as a slow calcium pool, which drives the KCa-channels
associated with NMDA synapses. We hypothesize that the synaptic KCa-channels are co-localized, or at least
function-ally coupled, with the NMDA synapse (Faber et al. 2005) and that there is no interference from other calcium pools (Brodin et al. 1991). To the best of our knowledge, this negative feedback between synaptic calcium channels and related KCa channels remains the best model for
NMDA-induced TTX-resistant membrane oscillations in the lam-prey. It constitutes a long-standing, experimentally supported feature of various lamprey models (Wallén et al. 1992; Huss et al. 2007, 2008). Long period oscillations emerge as a consequence of the interplay between NMDA-induced plateau potentials and KCa channels co-located with the
NMDA synapse (see also Sect.4.4). Among other conse-quences, this allows for oscillations in isolated hemiseg-ments without reciprocal inhibition. A similar functional coupling has been shown for KNa channels that are
co-located with AMPA receptors in lamprey spinal neurons; i.e., Na+ influx via AMPA receptors activates a slow KNa
channel that in turn decreases the AMPA-mediated excitation (Nanou and Kyriakatos 2008).
More data at the cellular level are needed to confirm that this negative feedback loop exists in the spinal cord of the salamander. However, several elegant studies showed that the dendritic co-localization of NMDA receptors and KCachannels is responsible for a Ca2+-mediated feedback
loop in various brain regions in rodents [(Faber et al. 2005; Ngo-Anh et al. 2005;Bloodgood and Sabatini 2007;Lin et al. 2008;Faber 2010); for review, seeMulholland(2012)]. Note however that the involvement of a NMDA–calcium KCafeedback loop may depend on the type of cell and the
type of synaptic connection. For instance in the lamprey, the monosynaptic connection between reticulospinal neurons
and motoneurons appears not to exhibit a synaptic KCa
chan-nel feedback loop (Cangiano et al. 2002). 4.2 Segmental versus hemisegmental oscillators
Simulated hemisegments were able to oscillate “autonom-ously”, i.e., without inputs from the contralateral side. This conforms to the reported rhythmogenic capability in vitro of spinal hemicords and hemisegments in the salamander (Ryczko et al. 2009,2010a) and in the lamprey (Cangiano and Grillner 2003,2005;Cangiano et al. 2012). Importantly the lamprey hemicord oscillates when electrically stimulated as soon as 2 min after cutting the midline of the spinal cord (Cangiano et al. 2012). Rhythmogenesis thus appears as an intrinsic capability of the hemisegmental networks, rather than an acquired ability due to plasticity of the system after the lesion as suspected by some authors (Hoffman and Parker 2010).
In agreement withRyczko et al.(2010a) we find that recip-rocal inhibitory connections slow down the oscillations in segments compared to hemisegments. A strong reciprocal inhibition will suppress the activity on the contralateral side long enough for the relevant calcium concentration to decay further than in isolated hemisegments, leading to longer bursts after release from inhibition.Ryczko et al.(2010a) reported a segmental duty cycle around 70 %. We find such a large duty cycle to be at odds with symmetric reciprocal inhibition, which has to be reasonably strong to slow-down oscillations in segments. In the simulations the inherent sym-metry lead to a duty cycle that fluctuated around 50 %. The current implementation of inhibitory coupling is probably too rigid, possibly due to the low number of neurons per hemisegment. Another consequence of this is that segmental stability scores are not changing very much. A future itera-tion of the present model should allow for the possibility of overlap between the decaying phase and the rising phase of oscillations in order to achieve duty cycles above 50 %.
Furthermore, we performed our data analysis on the direct output of the EIN subpopulation. The data byRyczko et al. (2010a) showed recordings of a signal that has been processed by motoneuron pools, whose intrinsic properties may shape the motor output further. Moreover the nature of extracellular recordings introduces a partial decay of the signal (Bédard et al. 2004), and changes in the measured waveform. Our model also lacks propriospinal connections and the co-activation of spinal neurons that are not part of the locomotor-networks by the NMDA bath, which might have distorted the in vitro recordings.
4.3 Suppressing synaptic transmission
Glycinergic inhibitory interneurons have been evidenced in the salamander (Jovanovic et al. 1999) and lamprey
(McPher-son et al. 1994) spinal cord. Eliminating the inhibition effectively reduced the model to two excitation-coupled hemisegments. In-phase synchronization was facilitated by the excitatory cross-connections. These pathways have been proposed as a simple explanation to this synchronous activity on the basis of the effects of strychnine on spinal networks in the salamander (Ryczko et al. 2010a) and in the lamprey [see, e.g.,Cangiano and Grillner(2003)]. These connections did not pose any problem for the remaining results, as in segments the inhibitory, anti-phase coupling is stronger than the exci-tatory, in-phase coupling. In the lamprey crossed excitatory connections target contralateral motoneurons or inhibitory interneurons, but the commissural projection to contralateral excitatory neurons remains to be demonstrated [(Buchanan 1982;Buchanan and McPherson 1995), see alsoMahmood et al.(2009), for review, seeRyczko et al.(2010b)]. Inter-estingly, the presence of cross-excitatory pathways in the zebrafish (McLean et al. 2007,2008) and in the limb net-works of the rat (Butt and Kiehn 2003) supports the idea that these connections may be a common characteristic of verte-brate locomotor systems. However their role in vivo is poorly understood. In the zebrafish cross-excitatory interneurons are active during slow swimming but not during fast swimming (McLean et al. 2007,2008). In the salamander two bursts per cycle can be recorded in the tail muscles during stepping (Delvolvé et al. 1997). The second burst occurs synchro-nously with that of the contralateral muscles. This left-right synchronous muscular pattern could involve cross-excitatory connections (see Bicanski et al.(2012) in the same issue). These might also be used during rhythmic “non locomotor” behaviors (e.g., mating, spawning, etc.) or to increase the flexibility of the left-right coordination pattern (Berg et al. 2007). It cannot be excluded that in the salamander the exci-tatory cross-connections target contralateral motoneurons, which were not modelled in this study.
In experiments (Ryczko et al. 2010a) the application of 6-cyano-7-nitroquinoxaline-2,3-dione (CNQX) abolished bursting by blocking AMPA synapses. In our simulations this was achieved for hemisegments only. In the segmental case the reciprocal inhibition enforced a rhythm, albeit slightly accelerated, even in the absence of the AMPA synapse. Hemisegments also lack the post inhibitory rebound pro-vided by the h-current after inhibition from the contralateral hemisegment terminates. This discrepancy might be reme-died if we assume that CNQX also blocks the transmission from the spinal interneurons to the target motoneuron pools. 4.4 The role of ionic channels
Contrary to findings for the lamprey (El Manira et al. 1994), blocking IKCa with apamine did not disrupt the ongoing
NMDA-induced rhythmic activity in the salamander but rather improved the signal-to-noise ratio in both segments
and hemisegments (Ryczko et al. 2010a). Ryczko et al. (2010a) hypothesized that similarly to the findings ofFaber et al. (2005), blockade of SK channels with apamine can potentiate fast glutamatergic synaptic potentials by remov-ing shuntremov-ing mediated by SK channels co-localized close to the NMDA synapse. This would in turn increase the signal-to-noise ratio. However, note that apamine most prob-ably affects at least two KCasubtypes. Intracellular
record-ings of lamprey spinal neurons revealed that apamine slows down NMDA-induced TTX-resistant membrane oscillations (El Manira et al. 1994), suggesting an effect on KCaNMDA
channels responsible for the termination of depolarized plateaus. In spinal neurons stimulated by current injection, apamine decreases the spike frequency adaptation, which is mediated by KCa channels responsible for the slow
after-hyperpolarization (El Manira et al. 1994). The radically different timescales of adaptation (on the order of 100 ms) versus NMDA-induced oscillations (several seconds) sug-gest that these KCa channels are distinct subtypes.
Simi-larly, fast and slow KNachannels are present in the lamprey
(Nanou and El Manira 2007;Nanou and Kyriakatos 2008; Wallén and Grillner 1997; Wallén et al. 2007;Huss et al. 2007). Reducing the KCaNMDA conductance in the present
model would trivially slow down oscillations, but blocking it completely would lead to tonic activity. This would not be in line with the effect of apamine reported in the exper-iments ofRyczko et al. (2010a). Hence, in the model we have restricted the effect of apamine to the adaptation con-ductance KCaN. It is a priori conceivable that the KCaNMDA
channels in the salamander could be apamine-insensitive (Stocker 2004). However if we assume that apamine also blocks the KCaNMDAconductance (in addition to the effect on
the adaptation channel), then the persistence of oscillations in the experiments by Ryczko and co-workers (2010a) predicts the presence of other inhibitory feedback mechanisms—e.g., slow KNa—similarly to the lamprey [see, e.g., Huss et al.
(2007)].
Thus, in this model the increase in signal-to-noise ratio after in simulated application of apamine is achieved through the block of IKCaN channels. This blockade brings
previ-ously spiking neurons, or neurons that fired short irregular bursts into the long period bursting regime. The simulation results correspond to the experimentally observed effect of apamine concerning the stability of the rhythm in hemiseg-ments. For segments the stability did not change markedly since the strong reciprocal inhibition enforced stable segmen-tal oscillations already under control conditions. The effect of apamine in the model can also account for cases where apamine led to the emergence of oscillations from NMDA-induced tonic discharges observed in vitro (Ryczko et al. 2010a). However, the duty cycle did not decrease when com-pared to hemisegments under control conditions, contrary to what was observed byRyczko et al.(2010a). Possibly IKCaN
channels susceptible to endogenous release of neuromodula-tors determine the number of neurons in the bursting regime and the intrinsic frequency (Grashow et al. 2009).Chevallier et al.(2006) demonstrated that a concentration of apamine in the same range as the one used byRyczko et al.(2010a) blocks the medium afterhyperpolarization (mAHP) in sala-mander hindlimb motoneurons.
Though there is some controversy over the selectivity of the blocker ZD 7288 toward Ihchannels (Wang et al. 2011),
our results are in agreement with the interpretation that block-ing Ihslowed down the oscillations by prolonging the
recov-ery period, albeit only mildly, especially for segments. This is consistent with Ihbeing a hyperpolarization activated,
depo-larizing current. This result and the fact that Ihis sensitive to
muscarinic (Chevallier et al. 2006) and serotonergic modula-tion (Pape 1996;Kiehn et al. 2000) suggest a role in adjusting the cycle duration and duty cycle.
In further agreement with the experimental data (Ryczko et al. 2010a), blocking the NaPcurrent abolishes activity. In
our model the NMDA-induced depolarization is insufficient to induce bursting if the background elevation of the mem-brane potential and the increased excitability due to INaPis
removed. This is in accordance with the initial observation that INaPcontrols of the excitability at subthreshold potential
[Llinás 1980; Stafstrom et al. 1982; for review see Llinás (1988)]. As such, INaP can control cellular rhythmic
prop-erties by triggering burst initiation. Such a role for INaPhas
been modeled accordingly for the respiratory system (Butera and Rinzel 1999;Butera et al. 1999) and for the locomotor system (Rybak et al. 2006;Daun et al. 2009). Its involvement in rhythmogenesis has been observed experimentally in the limb locomotor networks of the neonatal rat (Tazerart et al. 2007) and mouse (Zhong et al. 2007) and in the axial locomo-tor network of the salamander (Ryczko et al. 2010a). Future experiments must determine whether salamander CPG neu-rons exhibit more than one type of sodium channel as in our model, or just one sodium channel that is riluzole-sensitive.
4.5 Fast rhythms
In general, the frequency range of segments and hemiseg-ments under NMDA-stimulation is extremely limited for an isolated sample when compared to the variability among samples (Delvolvé et al. 1999;Ryczko et al. 2010a). The present model offers a tentative explanation of how long-period fictive locomotion rhythms and in vivo activity might be related in the salamander. Long-period rhythms are domi-nated by the CaNMDAsubsystem, whereas it constitutes only
one contribution to burst termination in vivo. In the lamprey, a similar distinction between the mechanisms underlying fast and slow rhythms has been discussed byCangiano and Grill-ner(2003).