DIFFERENT CAROTENOIDS AND POTENTIAL
INFORMATION CONTENT OF RED COLORATION OF
MALE THREE-SPINED STICKLEBACK
CLAUS WEDEKIND,1,* PASCALE MEYER,2 MARKUS FRISCHKNECHT,1 URS A. NIGGLI,2
and HANSPETER PFANDER2 'Abteilung Verhaltensokologie Zoologisches Institut, Universitat Bern
CH-3032 Hinterkappelen, Switzerland
2Department fur Chemie und Biochemie
Universitat Bern
Freiestrasse 3, 3012 Bern, Switzerland
(Received July 10, 1997; accepted December 30, 1997)
Abstract—Female sticklebacks (Gasterosteus aculeatus) use the red colora-tion of males as a criterion for mate choice. Redder males are more attractive. However, males often differ not only in the intensity of their coloration (from dull to bright red) but also in color quality (from yellowish to purple-red). We investigated whether the red coloration of the stickleback is actually a multiple signal made by several pigments. We kept wild caught males singly in tanks until they had built a nest and were ready to accept females. Then, we took standard photographs and measured their colors by spectrometer analyses of the slides and by descriptions of human observers. These two measurements were highly correlated. When analyzing the carotenoid content of the sticklebacks' skin we found two groups of carotenoids (astaxanthin and tunaxanthin/lutein) that were quantified for each individual. The differences in color observed in the fish are correlated to this pigment quantification. Redder fish have more astaxanthin in their skin than yellowish fish, while the color of the yellowish fish appears to be made by tunaxanthin/lutein. Our results suggest that the red coloration of sticklebacks is a multiple trait that is made of at least two different carotenoids. This opens the possibility that male sticklebacks signal more detailed information to females than a one-dimensional trait would allow.
Key Words—Breeding coloration, Gasterosteus aculeatus, stickleback, fish, multiple ornaments, signalling, carotenoids, astaxanthin, tunaxanthin, lutein. *To whom correspondence should be addressed.
787
INTRODUCTION
Bright colors are an example of exaggerated signals used for attracting potential mates (Fisher, 1930; Hamilton and Zuk, 1982). According to the "good genes models" of sexual selection (e.g., Hamilton and Zuk, 1982), they are indicators of some quality inherent in an animal that potential partners can secure for their offspring (Anderson, 1994). Such ornamentation can have several facets; accord-ingly, detailed information could be available in animals with multiple signals (Wedekind, 1992, 1994; Johnstone, 1995).
Sticklebacks (Gasterosteus aculeatus) are small freshwater fish with a clear sexual dimorphism during the breeding season, during which males develop a conspicuous red coloration while females remain cryptically colored. Milinski and Bakker (1990) experimentally demonstrated that this red coloration is a trait females use to choose their mate. More intensely colored males are more attrac-tive. This female preference was confirmed in further studies (e.g., Bakker and Milinski, 1991; Milinski and Bakker, 1992; Bakker and Mundwiler, 1994). In natural populations, males differ greatly in their coloration. It is very likely that this is due to costs imposed by the signal (Zahavi, 1975; Grafen, 1990). More intensely colored males are normally in better condition (Milinski and Bakker, 1990; Frischknecht, 1993), suffer less from parasite infection (Milinski and Bakker, 1990), are more aggressive towards conspecifics (Rowland, 1983; Bak-ker, 1986), but may be more susceptible to predation (Moodie, 1972).
When looking at different males, one gets the impression that their color-ation does not only differ in color intensity (from dull to bright) but also in color quality (hue, as defined by wavelength). Some males appear yellow rather than red, while others appear purely red. We have also seen males whose color was between red and deep purple. Therefore, the red coloration of sticklebacks does not seem to be a one-dimensional trait, but a set of multiple traits with the possibility of revealing more detailed information about a male than its health and vigor (Hamilton and Zuk, 1982; Milinski and Bakker, 1990; Frischknecht, 1993). In a first approach to investigate the potential importance of different sorts of red colorations on mate choice in sticklebacks, Baube et al. (1995) used pairs of differently colored male dummies and tested female reaction to them. They discriminated between two kinds of females and analyzed them separately. Low-response females preferred a yellow-bellied dummy over a red-bellied dummy, whereas high-response females displayed no uniform preference between these two color morphs. However, individual preferences of these high-response females could be so different that no uniform pattern is detectable when ana-lyzing these females as a group (see also Discussion).
The red coloration of sticklebacks is due to carotenoids (Brush and Reis-man, 1965; Matsuno and Katsuyama, 1976; Czeczuga, 1980). Carotenoids rep-resent a very large group of naturally occurring pigments with various structural
characteristics (Pfander, 1989) and biological activities (Krinsky, 1994). It is not yet entirely clear which carotenoids are stored in the skin of the sticklebacks and are actually relevant as color pigments (the techniques used in the earlier studies do not meet the modern standards of carotenoid identification described in Schiedt and Liaaen-Jensen, 1995). Of high interest in the context of parasite driven sexual selection (Hamilton and Zuk, 1982) is the fact that carotenoids are not only important pigments, but are also essential for the immune system to function properly (e.g., Lozano, 1994). Furthermore, vertebrates cannot syn-thesize these pigments (Simpson et al., 1981) and depend on the supply in their diet (guppies: Kodric-Brown, 1989; sticklebacks: T. C. M. Bakker, personal communication).
During the breeding season, male sticklebacks may be forced to find the optimal allocation of the carotenoids acquired earlier. On the one hand they need to be attractive to females; on the other hand they should aim at maintaining their health and defending themselves against parasite infection. This compro-mise might be revealed in the amount of pigments stored in the skin; they are likely to be reflected in the color spectrum visible to females. If so, color would be a multiple signal revealing information about the current needs of the immune system and hence about the susceptibility of a male to specific parasite infec-tions.
The aims of this study were to identify the carotenoid content of stickleback skin fragments and get relative quantification of the different carotenoids of individual fish and to correlate these carotenoid contents to color differences measured by several independent methods. This should allow assessment of whether the red coloration could be seen as multiple ornament. This is also a necessary first step to study the physiology of signaling; it might reveal potential information contained in the most conspicuous sexual trait of sticklebacks, a species for which a wealth of information on mating behavior and mate pref-erence is already available.
METHODS AND MATERIALS
The Sticklebacks. Male and female sticklebacks were caught in a small canal in Roche (near lake at Geneva, Switzerland) and brought to the laboratory. The males were kept individually in 10-liter tanks with some plants (nest mate-rial) and gravel and on a 16L: 8D light regime. They were fed with live Tubifex, and they were shown ripe females at regular intervals. Those males that sub-sequently developed their breeding coloration and had built a nest in response to female stimulation were removed from the tank, killed, immediately frozen in a box protected from light, and stored until further use.
stan-dard glass box (see detailed methods in Frischknecht, 1993). Then their skin was removed and used for the chemical analyses.
Identification of Carotenoids. HPLC analysis was performed on a Waters PDA 996 photodiode array system equipped with a Waters 600 multisolvent delivery system pump. The isolated carotenoid esters were quantified by HPLC with Millennium 2010 software (Waters Corporation, Milford Massachusetts) on an analytical Lichrosorb Si column (250 x 4.6 mm) modified with 1% H3PO4
in methanol. LC mass spectra were recorded on Micromass VG Platform with negative or positive atmospheric pressure chemical ionization (APCI). The sol-vent flow was 1 ml/min; corona voltage, negative mode, —2 kV; positive mode, +3.2 kV; cone voltage, -25 V and +20 V; probe temperature, 400°C; source temperature, 120°C.
To identify the main carotenoids, 25 sticklebacks were chosen that could easily be categorized into red ones (10 individuals) and yellowish ones (15 individuals). The skins of similarly colored individuals (red or yellowish) were pooled. Both groups of skins were frozen with liquid N2, ground, and dried
with Na2SO4. The samples were washed several times with acetone until the
solvent remained colorless. The solvent was removed in vacuo and the oily residue remaining was dissolved in a few drops of chloroform. Each chloroform solution was split into two parts, one of which was saponified (10% KOH in MeOH, room temperature, darkness, argon). Afterwards, t-butylmethyl ether (BuOMe) and H2O were added to the saponified extract, the two phases were
separated, and the H2O phase was extracted several times with t-BuOMe. The
combined organic phase was dried with Na2SO4 and the solvent was removed
in vacuo. To remove impurities, the oily residue was washed with DMSO-hexane and afterwards reextracted with r-BuOMe. The colored t-BuOMe solution was dried with Na2SO4 and the solvent evaporated in vacuo. Afterwards, some drops
of chloroform were added to the saponified and the nonsaponified samples. After adding acetone-hexane (14:86), the samples were analyzed with HPLC.
HPLC separations were performed with an analytical Lichrosorb Si column (4.6 x 250 mm) modified with 1 % H3PO4 in methanol for 90 min at a flow
rate of 1.2 ml/min. Afterwards, the column was washed for 48 hr with ace-tone-hexane (14:86) at the previous flow rate. All samples were separated with acetone-hexane (14:86) at a flow rate of 2 ml/min and detected at 470 nm. The separation time was 30 min for saponified samples and 15 min for nonsaponified samples.
Each saponified sample was dissolved in 100 ul acetone-hexane (14:86), and 20 ul was injected into a 20-ul sample loop. The chromatogram of the saponified extract of the red skins exhibited two intense peaks at 5.84 and 22.77 min, and with UV/Vis maxima at 478.7 nm, characteristic for astacene, and at 415.7, 439.9, and 469.0 nm, representing tunaxanthin. Two additional peaks
were observed at 25.54 and 27.02 min, both with UV/Vis maxima at 444.8 and 473.9 nm, and they were identified as lutein and/or its Z isomers. The chro-matogram of the saponified extract of the yellow skins showed a peak with a retention time of 25.00 min (415.7, 439.9, and 469.0 nm, tunaxanthin), and two additional peaks after 28.26 and 30.2 min (444.8 and 473.9 nm, which were identified as lutein and/or its Z isomers). The carotenoids were identified by comparison with authentic reference samples kindly provided by F. Hoff-mann-La Roche Ltd., Basel.
Each nonsaponified sample was dissolved in 500 ul acetone-hexane (14:86), and 20 ul was injected into a 20-ul sample loop. The chromatogram of the nonsaponified extract of the red skins showed two intense peaks at 1.51 and 2.08 min, respectively, with UV/Vis maxima of 444.8 and 466.6 nm for the first peak (esters of lutein/tunaxanthin) and 466.6 nm for the second peak (esters of astaxanthin). The chromatogram of the nonsaponified extract of the yellow skins showed an intense peak with a retention time of 1.50 min and a UV/Vis spectrum with wavelengths of 442.3 and 469.0 nm (esters of lutein/ tunaxanthin).
Determination of the molecular weights of the saponified samples was performed by HPLC-MS. Due to the high fat content, the molecular weights of the nonsaponified samples could not be determined. For saponified samples of the red skins, molecular weights of 592 (for astacene) at tR = 10.95 min and
568 (for tunaxanthin or lutein) at tR = 43-47 min were determined. For the
yellow skins the molecular weight was determined as 568 (for tunaxanthin or lutein) at tR = 43-51 min. A flow rate of 1.2 ml/min was used.
Quantification of Carotenoids. The skin from an individual frozen fish was removed and immediately frozen with liquid N2, ground, and dried with Na2SO4.
The mixture was washed several times with acetone until the solvent remained colorless. Organic phases were combined and reduced in vacuo. The oily residue was dissolved in acetone-hexane (14:86) and separated by thin-layer chroma-tography on MgO with acetone-hexane (14:86). Two bands were observed: a yellow band near the solvent front, and a red one with a low Rf value. In some
experiments, an additional weak yellow band in the middle of the other two bands was observed. The bands were cut out, the yellow ones dissolved in acetone-hexane (14:86), and the red one in acetone. The solutions were filtered and the solvent removed in a gentle nitrogen jet.
Each sample was dissolved in 100 ul acetone-hexane (14:86) and 30 ul was injected into the HPLC apparatus (at least two injections per sample). The mobile phase was acetone-hexane (14:86) at a flow rate of 2 ml/min, and the substances were detected at 470 nm. The separation time was 10 min.
As saponification was omitted in the procedure, esters of lutein and tunaxanthin were not separated and only the total amount of these esters was
determined. The combined lutein and tunaxanthin, and the astaxanthin esters were quantified from calibration curves based on standard solutions of lutein ester and astaxanthin ester, respectively.
Due to small sample amounts, only relative quantification was possible. This, however, is considered sufficient for discriminating between different groups of color types. In cases where no band was visible in the thin-layer chromatography (for astaxanthin: 13 of 40 fish samples, and for tunaxanthin/ lutein: 2 of 40 fish samples), a value of zero was assigned for statistical analyses. This may sometimes be inaccurate, but it at least does not produce a systematic error that could bias our conclusions; rather, it is restricted to increasing the variance within groups.
Measuring Colors by Spectrometer Analysis. For each of the 40 males, an area of about 2 mm2 of the ventral part of the head was measured from color
slides [on Kodachrome 64 film; for method see Frischknecht (1993)], in a Unkon 810 spectrophotometer from Kontron. The transmittance was recorded from 400 to 700 nm, the spectrum visible to humans and to sticklebacks, which have similar cone sensitivities, at 452, 529, and 604 nm (Lythgoe, 1979). Over the wavelength range 320 measurements were taken (Figure 1). This was also done for the white standard color chip (Munsell, white N 9.5) visible on each slide. By setting the white color chip of one particular slide as the baseline reference for 100% transmittance, we calculated a factor describing the percentage of light transmitted by the white color chip on each slide compared to the baseline. The spectrum for each ventral red spot was then multiplied by the inverse. The corrected transmittance for a red spot is given by: corrected fred = 100/twhite.
By using Endler's (1990) segmentation method, we reduced the spectrum for each fish to a set of values that describes hue (analogous to the dominant wavelength; zero = red end of the visible spectrum), chroma (also called sat-uration), and brightness (the total area under a spectrum). The four segments for this procedure were each 75 nm long and cover the whole range of 400-700 nm. Since differential brightness due to differences between films and processing are corrected for using the procedure described above, the remaining differences in brightness are inherent properties of the fish's color; therefore brightness in the set of traits was included for describing colors.
Human Description of Colors. For relating color impression to spectro-photometer data, three persons were asked (one of them was author M.F., who was naive at that time with respect to the other data) to judge the slides of the same 40 male sticklebacks. Each saw all slides simultaneously on a light table in front of him/her and ranked them according to redness. In a second round,
FIG. 1. Absorption spectra for the five classes of male sticklebacks (yellow, weak inten-sity; yellow, bright; yellow-red; red, weak; red, bright) and the carotenoids isolated in their skin, over the wavelength range of 400-700 nm.
they repeated the ranking with black and white slides that were copies of the color slides (Agfa Scale 200 slide film). This way, we reached a score for chroma (saturation) independent of hue. In both rounds, the observers chose one of two methods, whichever suited them best: either assigning each slide a score betweer 1 (color slides: very dull; black and white slides: light) and 10 (color slides: very bright; black and white slides: intense), or sorting the slides by increasing brightness; this second list was then reduced to the same scale from rank 1 to 10, with fractional ranks. This way, averaging over all three judges was pos-sible.
Since some fish appeared more yellow and others more red in various intensities, two persons (the authors M.F. and C.W., again naive at that time with respect to the other data) created an additional ranking, using the color slides on the same light table to group them on a two-dimensional scale: group 1: mainly yellow, weak intensity; group 2: mainly yellow, strong; group 3: intermediate: yellow and red; group 4: only red, weak; group 5: only red, strong. This assessment as well as the earlier ranking of redness, was independent of the chemical data (the chemical data were not known to the judges at that time).
RESULTS
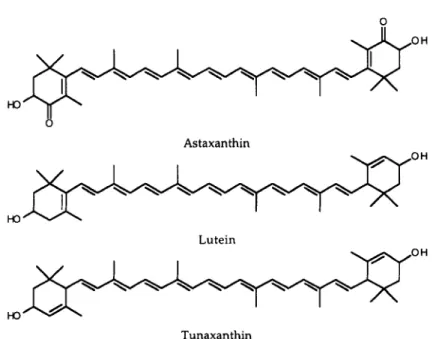
Color Pigments. The red coloration is made of more than one pigment. We found three different carotenoids in the skin of sticklebacks, identified as astaxanthin, tunaxanthin, and lutein (Figure 2). Since we could not discriminate between tunaxanthin and lutein in the quantification of carotenoid contents per fish skin, these two components have been measured together and the measure-ments are called hereafter tunaxanthin/lutein. Astaxanthin and tunaxanthin/lutein seem to be independent of each other; the amount of astaxanthin in the skin of the fish did not correlate with the amount of tunaxanthin/lutein (r = 0.04, N = 40, P = 0.82).
Color Measurement versus Carotenoids. The calculation of chroma and brightness from the spectrometer analysis and the ranking of black and white slides by human observers were strongly correlated with each other (ranking vs. chroma: r = 0.79; N = 40, P « 0.001; ranking vs. brightness: r = -0.82, P « 0.001). The same was true for the calculation of hue from the spectral analysis and the ranking of color slides by humans (r = -0.94, N = 40, P « 0.001). Therefore, the two methods give similar relative quantification of the fish's coloration. The comparison with the chemical analyses show that redder fish have more astaxanthin (compared to hue: r = -0.31, P - 0.05, two-tailed; compared to human ranking of redness: r = 0.35, P = 0.028) whereas the content of tunaxanthin/lutein did not significantly correlate with red coloration (compared to hue: r = -0.07, P = 0.67, two-tailed; compared to human scaling of redness: r = 0.01, P = 0.95).
FIG. 2. The chemical structures of astaxanthin, lutein and tunaxanthin (after Matsuno, 1989).
To human observers some fish appeared only yellow, or more yellow than red, while others appeared only red, each in various intensities. The measure-ments of hue by spectral analysis and the one-dimensional scaling of redness by human observers are not ideal methods to describe these different color patterns. Therefore, two human observers categorized the fish again but this time into five categories of two dimensions simultaneously (see Methods and Materials). Figure 3A shows the values of color measurements by spectrometer of the fish of these groups in relation to the criteria the human observers used for grouping. The five groups differ significantly in chroma, hue, and brightness measured by spectrometer (Figures 1 and 3A and B). A discriminant analysis of these five color groups based on spectrometer measurements reveals that the values for hue and chroma can be used to find a function that distinguishes the five groups (D = 3.37 • chroma + 6.14 • hue; Fglobal = 43.27, P « 0.001)
while the values for brightness contain redundant information (difference in r2
between analyses with two and with three variables < 0.001).
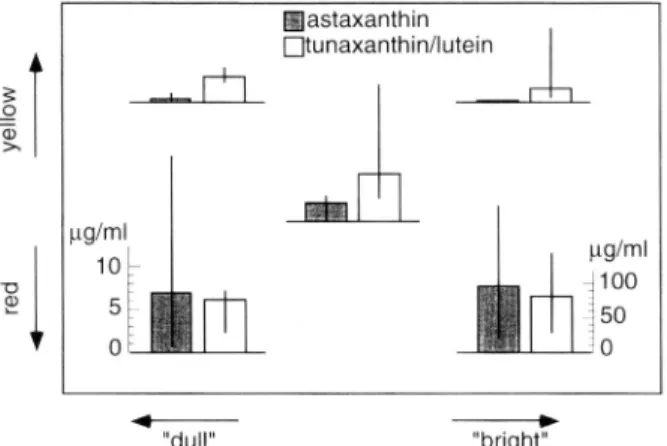
Figure 4 shows the carotenoid content of the fish in these groups again in relation to the criteria used for grouping. These five groups differ in the relative amount of carotenoids (see Figure 4 legend). This seems to result from different amounts of astaxanthin in the groups but not necessarily of tunaxanthin/lutein (statistics in Figure 4 legend). Although the contents of tunaxanthin/lutein
them-FIG. 3. Spectrometer analyses of stickleback coloration versus two-dimensional descrip-tion of colors. Photographs of the sticklebacks were categorized by two naive human observers into five groups according to color (red, yellow) and color intensity (dull, bright). (A) Medians and quartiles of measurements of chroma (first bars), hue (second bars), and brightness (third bars) of these fish. In sticklebacks, absence of red color pigments is usually connected with a opaque silver skin that reflects light to a high degree; this usually results in the counterintuitive finding that dull fish have high values of brightness and bright fish, i.e., brightly colored ones, have low values of brightness. The five groups differ in every respect of color measurement (one-way ANOVA, F always > 13.5, df = 4, P always « 0.001, two-tailed). (B) To describe the differences between the five groups in more detail, we performed post hoc analyses (Tukey HSD multiple comparision). Group 1 are the yellow and dull males, group 2 the yellow and bright males, etc. Groups differ from each other when the lines between the group numbers are thick (P < 0.01) or thin (P < 0.05). No line means no significant difference between groups.
FIG. 4. Carotenoid content of stickleback skins in the five color groups in micrograms per milliliter of hexane-acetone (86:14) solution. Hatched bars give the median ± quartiles of the content of astaxanthin (scale in left corner), and open bars the content of tunaxanthin/lutein (scale in right corner). The groups differ in their relative amounts of carotenoids (percentage astaxanthin of all carotenoids compared between the five groups: Kruskal-Wallis, df = 4, P = 0.043, two-tailed). This seems to result from different contents of astaxanthin (Kruskal-Wallis, df = 4, P = 0.012, two-tailed) but not of tunaxanthin/lutein (P = 0.75, two-tailed).
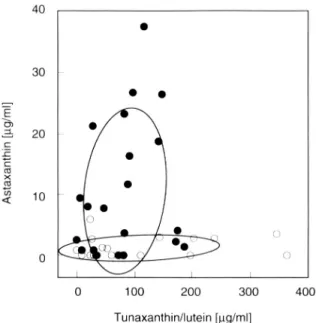
selves cannot be used to discriminate yellow and red fish, the highest amounts of this pigment can be observed in some of the yellow fish (Figure 5). When the fish are grouped into those that are yellow or yellowish (group 1-3 pooled) and those that are mostly red in various intensities (group 4 and 5 pooled), we found a discriminant function that significantly discriminates these fish according to their carotenoid content (Figure 5). However, the values for tunaxanthin/ lutein and astaxanthin do not correlate significantly with the spectrometer mea-surements in a canonical correlation (carotenoid contents ranked to take into account extreme values, including brightness: Hotelling-Lawley (H-L) trace = 0.28, F = 1.56, df = 6, 68, p = 0.17; excluding brightness: H-L trace = 0.22, F = 1.88, df = 4, 70, p = 0.12), nor is the relative amount of astaxanthin significantly linked to the spectrometer measurements in a multivariate analysis (including brightness, multiple regression, F = 1.04, df = 3, p = 0.39; exclud-ing brightness: F = 0.94, df = 2, p = 0.40).
DISCUSSION
The breeding coloration of male sticklebacks in our sample is made of at least three carotenoids (two groups quantified here). Absolute amounts varied
FIG. 5. Carotenoid content of sticklebacks that are described as yellow or intermediate red-yellow (open circles; color groups 1-3) and sticklebacks that are described as clearly more red than yellow (closed circles; color groups 4 and 5) in hexane-acetone (86:14) solution. The ellipses are superimposed on the two groups with a 50% confidence region of the data values. Disciminant analysis: D = 2.80* (astaxanthin) — 0.09 (tunaxanthin/ lutein); F = 7.30, df = 2, P = 0.002.
considerably between individuals but did not appear to correlate within the fish. This indicates that the two groups of pigment we measured are physiologically independent of each other. Both correlate with the sticklebacks' coloration in a specific manner: tunaxanthin/lutein seems to cause a yellow or yellowish color, while astaxanthin correlated strongly with red color. Therefore, the red color-ation of sticklebacks can be seen as a multiple ornament, where the type of carotenoid and the amount present in the fish vary independently. As a conse-quence, male sticklebacks could signal more detailed information to females than only their health and vigor (Hamilton and Zuk, 1982; Milinski and Bakker, 1990; Frischknecht, 1993), which is usually seen as a one-dimensional variable. In our analyses of coloration we have neglected potential differences in the area of the skin that show conspicuous yellow or red color. Since we used the whole skin of the males for our carotenoid measurements, we do not know how much of the variance in pigment quantification that is left unexplained is con-nected to differences in pigment density over different areas of the skin. Accord-ingly, color intensity measured with the spectrometer (covering only an area of
about 2 mm2 on the fish) does not seem to be strongly correlated to pigment
content (see multivariate analyses). However, this should not have a great impact on the relative amount of the two groups of carotenoids found, since the sticklebacks' coloration in our sample appeared to be quite homogeneous, con-taining either yellow, red, or a mixture of these two colors.
The individual differences in pigment contents could reveal differences in food supply and food range. Since carotenoids cannot be synthesized by the fish (Simpson et al., 1981), they have to come from food sources. It is known that certain prey types promote stickleback coloration (T. Bakker, unpublished data), and different prey may contain different carotenoids. However, if the males of a given population do not differ greatly in their diet, the individual color dif-ferences could reveal the needs of male physiology at the time of mate choice. Males during the breeding season may be forced to balance the needs of being attractive and fighting infection. This may necessitate reallocation of carotenoids because carotenoids are important biological agents in different organs, espe-cially for immune functions (Bendich, 1989, 1991; Bendich and Olson, 1989; West et al., 1991; Krinsky, 1993; Christiansen et al., 1995). This may be the reason why many sexual signals are based on carotenoids (e.g., Gray, 1996). By choosing colorful males, females get, on average, males with a lower parasite burden because the needs of the immune system correlate with it (Lozano, 1994). Accordingly, several studies showed that carotenoid-dependent coloring got weaker with infection in sticklebacks (Milinski and Bakker, 1990), red jungle fowl (Zuk et al., 1990), guppies (Houde and Torio, 1992), and Arctic char (Skarstein and Folstad, 1996). In Milinski and Bakker's (1990) experi-mental infection of male sticklebacks with the ectoparasite Ichtyophthirius mul-tifiliis, the coloration not only paled after infection, but males who were more intensely colored at the time of infection developed a weaker infection (Milinski and Bakker, 1991). This again suggests that carotenoids can be recruited from the skin if they are necessary for immune defense.
We propose here an extension of Lozano's (1994) hypothesis on the con-nection between parasites, carotenoid-based signals, and sexual selection. Since carotenoids can differ in their chemical structure and their biological function (Bendich and Olson, 1989; Krinsky, 1993), different carotenoids are likely to differ in their impact on immune function. It is therefore possible that the amounts of different carotenoids an animal uses to fight its current parasite infections differ according to the kind of infection. The absolute and relative amounts of all carotenoids that constitute multiple coloration could then reveal detailed information about the current needs of the immune system and, therefore, about the kind and the intensity of a current infection. This may be the case, because the males are likely to redistribute their metabolites in an adaptive manner, taking into account the conflicting needs of being attractive versus fighting path-ogens. The resulting detailed information in the breeding coloration could be
valuable for females and, consequently, may have a strong influence on their mate choice. A female that takes such detailed information into account could choose males with complementary disease resistances (Wedekind, 1992, 1994), while females that simply use a one-dimensional signal may only be able to choose males that are generally in good health and vigor (Hamilton and Zuk, 1982). We found here that the red coloration of sticklebacks has the potential to reveal detailed information. However, whether the two groups of carotenoids found here differ in their impact on the immune system and whether this infor-mation is used by females still needs to be tested.
Acknowledgments—We thank Barbara Streb, Marcel Zurcher, and Daniel Kull for help with
the chemical analyses; Daniel Wyler for help with the spectrometer; Nathalie Treichel and Lukas Scharer for ranking the black and white and the color slides; Julian Rauch and Rolf Eggler for general technical assistance; and Manfred Milinski, Theo Bakker, and the referees for stimulating discussion and/or many helpful comments on the manuscript. This project was supported by the Swiss National Science Foundation.
REFERENCES
ANDERSSON, M. 1994. Sexual Selection. Princeton, Princeton University Press.
BAKKER, T. C. M. 1986. Aggressiveness in sticklebacks (Gasterosteus aculeatus L.: A behav-iour-genetic study. Behaviour 98:1-144.
BAKKER, T. C. M., and MILINSKI, M. 1991. Sequential female choice and the previous male effect in sticklebacks. Behav. Ecol. Sociobiol. 29:205-210.
BAKKER, T. C. M., and MUNDWILER, B. 1994. Female choice and male red coloration in a natural stickleback population. Behav. Ecol. 5:74-80.
BAUBE, C. L., ROWLAND, W. J., and FOWLER, J. B. 1995. The mechanisms of colour-based mate choice in female threespine sticklebacks: hue, contrast and configurational cues. Behaviour
132:979-996.
BENDICH, A. 1989. Carotenoids and the immune response. J. Nutr. 119:112-115. BENDICH, A. 1991. b-Carotene and the immune response. Proc. Nutr. Soc. 50:263-274. BENDICH, A., and OLSON, J. A. 1989. Biological actions of carotenoids. FASEB J. 3:1927-1932. BRUSH, A. H., and REISMAN, H. M. 1965. The carotenoid pigments in the three-spined stickleback,
Gasterosteus aculeatus. Comp. Biochem. Physiol. 14:121-125.
CHRISTIANSEN, R., GLETTE, J., LIE, 0., TORRISSEN, O. J., and WAAGBO, R. 1995. Antioxidant status and immunity in Atlantic salmon, Salmo salar L., fed semi-purified diets with and without astaxanthin supplementation. J. Fish Dis. 18:317-328.
CZECZUGA, B. 1980. Carotenoids in fish. XXVI. Pungitus pungitus (L.) and Gasteosteus aculeatus L. (Gasterosteidae). Hydrobiologia 74:7-10.
ENDLER, J. A. 1990. On the measurement and classification of colour in studies of animal colour patterns. Biol. J. Linn. Soc. 41:315-352.
FISHER, R. A. 1930. The Genetical Theory of Natural Selection. Clarendon Press, Oxford. FRISCHKNECHT, M. 1993. The breeding coloration of male three-spined sticklebacks (Gasterosteus
aculeatus) as an indicator of energy investment in vigour. Evol. Ecol. 7:439-450.
GRAFEN, A. 1990. Biological signals as handicaps. J. Theor. Biol. 144:517-546.
GRAY, D. A. 1996. Carotenoids and sexual dichromatism in North American passerine birds. Am.
HAMILTON, W. D., and ZUK, M. 1982. Heritable true fitness and bright birds: a role for parasites?
Science 218:384-387.
HOUDE, A. E., and TORIO, A. J. 1992. Effect of parasitic infection on male color pattern and female choice in guppies. Behav. Ecol. 3:346-351.
JOHNSTONE, R. A. 1995. Honest advertisement of multiple qualities using multiple signals. J. Theor.
Biol. 177:87-94.
KODRIC-BROWN, A. 1989. Dietary carotenoids and male mating success in the guppy: An environ-mental component to female choice. Behav. Ecol. Sociobiol. 25:393-401.
KRINSKY, N. I. 1993. Actions of carotenoids in biological system. Annu. Rev. Nutr. 13:561-587. KRINSKY, N. I. 1994. The biological properties of carotenoids. Pure Appl. Chem. 66:1003-1010. LOZANO, G. A. 1994. Carotenoids, parasites, and sexual selection. Oikos 70:309-311.
LYTHGOE, J. N. 1979. The Ecology of Vision. Clarendon Press, Oxford.
MATSUNO, T. 1989. Animal carotenoids, pp. 59-74, in N. I. Krinsky, M. M. Mathew-Roth, and R. F. Taylor (eds.). Carotenoids. Chemistry and Biology. Plenum Press, New York. MATSUNO, T., and KATSUYAMA, M. 1976. Comparative biochemical studies of carotenoids in fishes
XI: Carotenoids of two species of flying fish, mackerel pike, killifish, three-spined stickleback and Chinese eight-spined stickleback. Bull. Jpn. Soc. Sci. Fish 42:761-763.
MILINSKI, M., and BARKER, T. C. M. 1990. Female sticklebacks use male coloration in mate choice and hence avoid parasitized males. Nature 344:330-333.
MILINSKI, M., and BAKKER, T. C. M. 1991. Sexuelle Selektion: Stichlingsweibchen erkennen parasitierte Mannchen nur an deren Balzfarbung. Verh. Dtsch. Zool. Ges. 84:320.
MILINSKI, M., and BAKKER, T. C. M. 1992. Costs influence sequential mate choice in sticklebacks,
Gasterosteus aculeatus. Proc. R. Soc. London Ser. B 250:229-233.
MOODIE, G. E. E. 1972. Predation, natural selection and adaptation in an unusual threespined stickleback. Heredity 28:155-167.
PFANDER, H. 1989. Key to Carotenoids, 2nd ed. Birkhauser, Basel.
ROWLAND, W. J. 1983. The relationships among nuptial coloration, aggression, and courtship of male three-spined sticklebacks, Gasterosteus aculeatus. Can. J. Zool. 62:999-1004. SCHIEDT, K., and LIAAEN-JENSEN, S. 1995. Isolation and analysis, pp. 81-108, in G. Britton, S.
Liaaen-Jensen, and H. Pfander (eds.). Carotenoids, Vol. IA. Birkhauser, Basel.
SIMPSON, K. L., KATAYAMA, T., and CHICHESTER, C. O. 1981. Carotenoids in fish feeds, pp. 462-538, in J. C. Bauernfeind (ed.). Carotenoids as Colorants and Vitamin A Precursors. Academic Press, New York.
SKARSTEIN, F., and FOLSTAD, I. 1996. Sexual dichromatism and the immunocompetence handicap: An observational approach using Arctic charr. Oikos 76:359-367.
WEDEKIND, C. 1992. Detailed information about parasites revealed by sexual ornamentation. Proc.
R. Soc. London Ser. B 247:169-174.
WEDEKIND, C. 1994. Mate choice and maternal selection for specific parasite resistances before, during and after fertilization. Phil. Trans. R. Soc. London Ser. B 346:303-311.
WEST, C. E., ROMBOUT, J. H. W. M., VAN DER ZUPP, A. J., and SUTSMA, S. R. 1991. Vitamin A and the immune function. Proc. Nutr. Soc. 50:251-262.
ZAHAVI, A. 1975. Mate selection—a selection for a handicap. J. Theor. Biol. 53:205-214. ZUK, M., JOHNSON, K., THORNHILL, R., and LIGON, J. D. 1990. Parasites and male ornaments in