HAL Id: hal-03020366
https://hal.archives-ouvertes.fr/hal-03020366
Submitted on 30 Nov 2020
HAL is a multi-disciplinary open access
archive for the deposit and dissemination of
sci-entific research documents, whether they are
pub-lished or not. The documents may come from
teaching and research institutions in France or
abroad, or from public or private research centers.
L’archive ouverte pluridisciplinaire HAL, est
destinée au dépôt et à la diffusion de documents
scientifiques de niveau recherche, publiés ou non,
émanant des établissements d’enseignement et de
recherche français ou étrangers, des laboratoires
publics ou privés.
France.
Isabelle Jalenques, Fabien Rondepierre, Chloé Rachez, Sophie Lauron, Candy
Guiguet-Auclair
To cite this version:
Isabelle Jalenques, Fabien Rondepierre, Chloé Rachez, Sophie Lauron, Candy Guiguet-Auclair.
Health-related quality of life among community-dwelling people aged 80 years and over: a
cross-sectional study in France.. Health and Quality of Life Outcomes, BioMed Central, 2020, 18 (1),
pp.126. �10.1186/s12955-020-01376-2�. �hal-03020366�
R E S E A R C H
Open Access
Health-related quality of life among
community-dwelling people aged 80 years
and over: a cross-sectional study in France
Isabelle Jalenques
1*, Fabien Rondepierre
2, Chloé Rachez
2, Sophie Lauron
3and Candy Guiguet-Auclair
4Abstract
Background: The proportion of people living to a very old age is continuously increasing. One of the possibilities explored in policies and services to meet this health and societal challenge is to encourage the very old to continue living at home. This initiative is in line with the wishes of most elderly people. However, owing to the great changes that occur during old age attention should be paid to health-related quality of life (HRQoL). The aims of this study were to assess HRQoL in French community-dwelling people aged 80 years and over and to
investigate the sociodemographic and health characteristics and life events associated with HRQoL.
Methods: A cross-sectional study was conducted in France to assess the HRQoL of people aged 80 years or more living at home. All people recruited were sent a letter explaining the aim of the study and requesting their consent to take part. Those who accepted then received a series of sociodemographic and medical questionnaires, a questionnaire concerning life events of the previous 12 months and the LEIPAD questionnaire, which assesses HRQoL in elderly people.
Results: The data of 184 participants (54.9% female) with a mean age of 83.9 years (almost 40% older than 85 years), were analysed. Low scores, indicating better HRQoL, were obtained on the‘Self-Care’ and ‘Depression and Anxiety’ scales with 50.9 and 40.8% of responders, respectively, having the minimum score of zero. The highest score was found on the‘Sexual Functioning’ scale, with 59.1% of participants having the maximum score of 100. Elderly females declared a significantly less satisfactory HRQoL. Deteriorating health, an unsatisfactory environment, not being able to drive, perceived modest income and financial worries negatively affected HRQoL.
Conclusion: Identifying factors in our study that are potential determinants of HRQoL would be of direct benefit for individuals. Concrete public policy initiatives concerning means of transport, living environment and financial resources could then be implemented to improve the HRQoL of very old community-dwelling individuals.
Keywords: Health-related quality of life, Elderly people, Older adults, Eighty and over, Ageing, Community-dwelling elderly people, LEIPAD
© The Author(s). 2020 Open Access This article is licensed under a Creative Commons Attribution 4.0 International License, which permits use, sharing, adaptation, distribution and reproduction in any medium or format, as long as you give appropriate credit to the original author(s) and the source, provide a link to the Creative Commons licence, and indicate if changes were made. The images or other third party material in this article are included in the article's Creative Commons licence, unless indicated otherwise in a credit line to the material. If material is not included in the article's Creative Commons licence and your intended use is not permitted by statutory regulation or exceeds the permitted use, you will need to obtain permission directly from the copyright holder. To view a copy of this licence, visithttp://creativecommons.org/licenses/by/4.0/. The Creative Commons Public Domain Dedication waiver (http://creativecommons.org/publicdomain/zero/1.0/) applies to the data made available in this article, unless otherwise stated in a credit line to the data.
* Correspondence:ijalenques@chu-clermontferrand.fr
1
Université Clermont Auvergne, CHU Clermont-Ferrand, Service de Psychiatrie de l’Adulte A et Psychologie Médicale, Centre Mémoire de Ressources et de Recherche, 58 rue Montalembert, Cedex 1, 63003 Clermont-Ferrand, France
Background
The populations of industrialised countries have seen a major increase in the last few decades in the number of people living to a very old age. At present, 5.3% of the population in Europe is aged 80 years and over [1] and this age group is currently the fastest growing on the continent and will continue to be so up to 2050 [2]. To meet the challenges that come with this trend, one of the areas of interest explored in policies and services is to encourage living in the community until very old age. This is in line with the wishes of most older people in Western countries, who prefer to live in their own famil-iar environment as long as possible rather than in insti-tutions [3–5]. Such initiatives would also increase the ability of the health care systems to bear the financial costs [4]. However, owing to the great changes that occur in the long period of life that now extends beyond the age of 65, particularly in terms of health, particular attention needs to be paid to aged people’s quality of life (QoL). In 2014, total life expectancy at 65 years was 18.2 years, including 8.6 years with no activity restrictions for men, and 21.6 years, including 8.6 with no activity re-strictions for women [6].
The quality of life is a broad concept covering all as-pects of human activity. Health, the environment and so-cial domain greatly influence the life of elderly people [4]. Health-related quality of life (HRQoL) is a reflection of the way that individuals perceive and react to their health-related factors, such as physical, functional, emo-tional, and mental well-being and to the nonmedical as-pects of their lives such as family, friends and activities [7]. HRQoL and its determinants are therefore of inter-est to the individual from a medical and social point of view but also in shaping health policy [7]. Thus, measur-ing the HRQoL can be useful for studymeasur-ing some factors influencing housing decisions among elderly people and assessing how to act on these factors to promote the home support desired by the major part of elderly people and in the policies of many countries [5]. Meas-uring HRQoL of elderly people can also be useful when developing and then monitoring policy initiatives that are part of the dynamics of the Age-friendly Environ-ments in Europe (AFEE) project [3]; for example by making it possible to assess the links between the phys-ical or social environment and different dimensions of HRQoL. Precise and detailed HRQoL data from suffi-ciently large sample sizes of community-dwelling people aged 80 years are potentially of great interest but cur-rently are scarce.
We assessed the HRQoL of community-dwelling eld-erly people (EP) aged 65 years and over in an earlier work [8] but, as in other studies, the number of partici-pants aged 80 years and over was low (32 in our study) [9–11]. Among other studies, a Brazilian team
investigated the quality of life of a community-dwelling population aged 60 years and over using the WHOQOL-BREF and the WHOQOL-Old. Of the 317 participants recruited 15.4% were octogenarians but the study gave no specific results for this subgroup [12]. In Europe, the very few recent studies involving community-dwelling people aged 80 years and over, all used the generic Euro-Qol five dimension scale (EQ-5D). One assessed people aged 75 years and over in six European countries using in addition the SF-12 questionnaire [13]; another, con-ducted in Switzerland, assessed people aged 65 years and over of whom 41% were 80 years old or more [14]; and a third assessed Dutch people aged 65 years and over of whom 11.8% were octogenarians [15]. In three of these studies, data on comorbidities were scarce or lacking. To our knowledge no recent study assessing HRQoL using an instrument specifically aimed at EP has been made in European community-dwelling people aged 80 years and over.
To assess HRQoL in older people, specific instru-ments, which are more suitable than generic ones be-cause of their item relevance and better acceptability, have been developed and provide particularly useful in-formation. They allow an easy individual assessment of older people’s HRQoL and can be used for medical and psychosocial interventions, as described by Xiao-Jun Lin et al. [7] Some of them have shown particularly interest-ing psychometric properties [16]. They include the LEI-PAD, an acronym derived from the first two of the three universities involved in its development, LEIden in the Netherlands and PADua in Italy, under the auspices of the European office of World Health Organization. The LEIPAD is a brief self-administered HRQoL question-naire developed specifically for community-dwelling EP and validated for French speaking people aged 80 years and over [17,18].
Thus, the aims of this original study were first to measure HRQoL in a larger sample of community-dwelling people aged 80 years or over using a self-administered questionnaire touching on various aspects of daily life specifically adapted to EP, the LEIPAD ques-tionnaire, and second to study its association with socio-demographic and medical characteristics and life events of this age group.
Methods
Study design
This cross-sectional study was conducted in France to evaluate HRQoL in EP aged 80 years of age and over who were not residents of an institution. The partici-pants were picked at random (simple random sampling using random number tables) from electoral lists pro-vided by the municipalities of six town councils (rural, semi-urban and urban) in the region of Auvergne
(central France). In all, 2064 people were eligible, of whom 1501 were randomly selected to take part in the study. The sample size was calculated for a previous publication validating the LEIPAD questionnaire [18].
All potential participants were sent a letter explaining the aim of the study and requesting them to give con-sent to take part. Those who accepted then received a set of questionnaires, a letter detailing the procedure to be followed and a prepaid envelope in which to return the questionnaires.
The project was approved by the French regional ethics committee ‘Comité d’Ethique des Centres d’Investigation Clinique de l’Inter-région Rhône-Alpes-Auvergne -
CE-CIC Grenoble’ (IRB 00005921) and conducted according to the principles expressed in the Declaration of Helsinki. All participants enrolled gave their written informed consent.
Participants
To be included the participants had to be aged 80 years or over, living at home, not suffering from dementia or any other neurodegenerative disorder and capable of completing the self-report questionnaires without assistance.
Once all the data had been collected, we excluded from analysis participants who had not replied to the
Fig. 1 Organisation chart of participation in the study [18]. Of the 1501 people invited to take part, 448 (32%) replied to the request (100 letters were not delivered) with 239 accepting (53.3%) and 209 declining (46.7%). Of the 239 questionnaires sent to those who accepted to take part, 211 (88.3%) were returned. Of the latter, 27 were then excluded because they did not fulfil the inclusion criteria, leaving therefore 184 questionnaires to be analysed
questionnaire unaided (identified by an item about whether they completed the questionnaires alone or with help) and those suspected of having a neurodegenerative disorder (identified by two items concerning health problems and current medical treatment).
Data collection
Sociodemographic characteristics of the EP (gender, age, marital status, educational level, living status, ability to
drive, hospital admission during the previous 12 months), their current health problems according to the ICD-10 classification, treatment being taken during the study, and events that may have disrupted their life in the previous 12 months (illness, poor health, daily care of a relative or friend, problem(s) with spouse or partner, bereavement, serious illness of a relative or friend, prob-lem(s) with offspring, relational probprob-lem(s) with friends or relatives, moving house, environment perceived as
Table 1 Characteristics of the respondents (n = 184)
Female Male Total
n (%) n (%) n (%) p-value Gender Female 101 (54.9%) Male 83 (45.1%) Age (years) mean (SD) 84.5 (3.6) 83.2 (2.8) 83.9 (3.3) 0.0134 min-max 80–95 80–90 80–95 Marital status < 0.0001
Never-married, widowed, divorced 63 (64.3%) 12 (14.5%) 75 (41.4%)
Married or living with a partner 35 (35.7%) 71 (85.5%) 106 (58.6%)
Educational level 0.6040
Pre-high school 80 (80.0%) 63 (76.8%) 143 (78.6%)
High school or higher 20 (20.0%) 19 (23.2%) 39 (21.4%)
Living arrangement < 0.0001 Alone 59 (58.4%) 16 (19.3%) 75 (40.8%) Not alone 42 (41.6%) 67 (80.7%) 109 (59.2%) Driving a car < 0.0001 Yes 33 (34.0%) 76 (95.0%) 109 (61.6%) No 64 (66.0%) 4 (5.0%) 68 (38.4%)
Hospital admission during the previous 12 months 0.1017
Yes 18 (18.4%) 23 (28.8%) 41 (23.0%)
No 80 (81.6%) 57 (71.3%) 137 (77.0%)
Life events during the previous 12 months
Illness 27 (27.8%) 25 (31.3%) 52 (28.3%) 0.6196
Poor health 25 (26.6%) 20 (25.0%) 45 (24.5%) 0.8107
Daily care of a relative or friend 12 (12.9%) 16 (20.0%) 28 (15.2%) 0.2064
Problem(s) with spouse or partner 5 (5.4%) 6 (7.5%) 11 (6.0%) 0.5682
Bereavement 25 (26.9%) 15 (18.8%) 40 (21.7%) 0.2059
Serious illness of a relative or friend 23 (24.7%) 26 (32.5%) 49 (26.6%) 0.2582
Problem(s) with offspring 19 (20.4%) 8 (10.0%) 27 (14.7%) 0.0595
Relational problem(s) with friends or relatives 8 (8.6%) 2 (2.5%) 10 (5.4%) 0.1091
Unsatisfactory environment 6 (6.5%) 7 (8.8%) 13 (7.1%) 0.5675
Perceived modest income 37 (39.8%) 17 (21.3%) 54 (29.3%) 0.0087
Financial worries 10 (10.8%) 7 (8.8%) 17 (9.2%) 0.6591
Table 2 Comparison of scores for dim ensions on the LEIPAD scale according to the characteristics of the participants Physi cal Function Self-Care D epression and Anxiet y C o gnitive Function ing Social Fun ctioni ng Sexu al Fun ctioni ng Life Satisfaction Total 33.3 (20.0 –46 .7) 0 (0 –22.2) 8. 3 (0 –25 .0) 20 .0 (6.7 –26.7 ) 22.2 (11.1 –33.3 ) 100 (83.3 –100) 33.3 (22.2 –38.9) Gen der Male 26.7 (13.3 –40 .0) 0 (0 –5.6) 0 (0 –16.7 ) 20 .0 (6.7 –26.7 ) 22.2 (11.1 –33.3 ) 83.3 (66.7 –10 0) 33.3 (22.2 –38.9) Fema le 33.3 (26.7 –53 .3) 11.1 (0 –27 .8) 16 .7 (0 –25.0) 20 .0 (13. 3– 26.7) 22.2 (11.1 –33.3 ) 100 (83.3 –100) 33.3 (27.8 –44.4) p-va lue < 0.0001 < 0.0001 0.0018 0.3 122 0.5249 < 0.0001 0.31 53 Age (years) r 0.25 0.28 0. 15 0. 13 0.13 0.16 0.10 p-va lue 0.0010 0.0002 0.0 515 0.0 902 0.0778 0.03 94 0.18 84 Marital status Neve r marrie d, widowe d, divorced 33.3 (26.7 –53 .3) 5.6 (0 –27.8) 16 .7 (0 –25.0) 20 .0 (6.7 –26.7 ) 22.2 (11.1 –33.3 ) 100 (100 –10 0) 33.3 (27.8 –44.4) Mar ried or wit h a partn er 33.3 (20.0 –46 .7) 0 (0 –16.7) 8. 3 (0 –25 .0) 20 .0 (6.7 –33.3 ) 22.2 (11.1 –33.3 ) 83.3 (66.7 –10 0) 27.8 (22.2 –38.9) p-va lue 0.07 55 0.1331 0.3 615 0.4 597 0.2758 0.000 2 0.09 34 Educationa l level Pre-h igh sch ool 33.3 (20.0 –53 .3) 5.6 (0 –22.2) 8. 3 (0 –25 .0) 20 .0 (6.7 –33.3 ) 22.2 (11.1 –33.3 ) 100 (83.3 –100) 33.3 (25.0 –38.9) Hig h schoo l or highe r ed ucation 26.7 (20.0 –40 .0) 0 (0 –11.1) 8. 3 (0 –16 .7) 13 .3 (6.7 –26.7 ) 22.2 (0 –33 .3) 83.3 (66.7 –10 0) 33.3 (22.2 –44.4) p-va lue 0.07 00 0.0775 0.4 631 0.4 462 0.1481 0.01 11 0.90 59 Living arra ngem ent Alone 33.3 (20.0 –53 .3) 5.6 (0 –22.2) 16 .7 (0 –25.0) 20 .0 (6.7 –26.7 ) 22.2 (11.1 –33.3 ) 100 (83.3 –100) 33.3 (27.8 –44.4) Not alon e 33.3 (20.0 –46 .7) 0 (0 –16.7) 8. 3 (0 –25 .0) 20 .0 (6.7 –33.3 ) 22.2 (11.1 –33.3 ) 100 (66.7 –100) 27.8 (22.2 –38.9) p-va lue 0.22 78 0.6906 0.4 764 0.5 017 0.1645 0.009 6 0.02 24 Drivin g a car Yes 26.7 (20.0 –40 .0) 0 (0 –5.6) 0 (0 –16.7 ) 20 .0 (6.7 –26.7 ) 22.2 (11.1 –33.3 ) 100 (66.7 –100) 27.8 (22.2 –38.9) No 40.0 (26.7 –60 .0) 22.2 (2.8 –33.3) 16 .7 (0 –33.3) 20 .0 (13. 3– 33.3) 22.2 (11.1 –44.4 ) 100 (83.3 –100) 33.3 (27.8 –50.0) p-va lue < 0.0001 < 0.0001 0.0033 0.0 559 0.0174 0.002 4 0.08 14 Hospit al admis sion du ring the previ ous 12 m onths Yes 46.7 (20.0 –60 .0) 5.6 (0 –22.2) 16 .7 (0 –33.3) 20 .0 (6.7 –40.0 ) 22.2 (11.1 –33.3 ) 100 (83.3 –100) 33.3 (22.2 –38.9) No 33.3 (20.0 –40 .0) 0 (0 –16.7) 8. 3 (0 –25 .0) 20 .0 (6.7 –26.7 ) 22.2 (11.1 –33.3 ) 100 (66.7 –100) 33.3 (22.2 –41.7) p-va lue 0.03 12 0.4275 0.1 987 0.5 622 0.6219 0.75 35 0.66 90 Number of health proble ms r 0.50 0.41 0. 25 0. 21 0.24 0.08 0.30 p-va lue < 0.0001 < 0.0001 0.0008 0.0050 0.0011 0.29 33 < 0.0001 Life events du ring the previ ous 12 m onths Illnes s
Table 2 Comparison of scores for dim ensions on the LEIPAD scale according to the characteristics of the participants (Continued) Physi cal Function Self-Care D epression and Anxiet y C o gnitive Function ing Social Fun ctioni ng Sexu al Fun ctioni ng Life Satisfaction Yes 46.7 (33.3 –60 .0) 11.1 (0 –27 .8) 16 .7 (0 –33.3) 20 .0 (6.7 –40.0 ) 22.2 (11.1 –33.3 ) 100 (66.7 –100) 33.3 (22.2 –44.4) No 26.7 (20.0 –40 .0) 0 (0 –16.7) 8. 3 (0 –25 .0) 20 .0 (13. 3– 26.7) 22.2 (11.1 –33.3 ) 100 (83.3 –100) 33.3 (22.2 –38.9) p-value < 0.0001 0.0030 0.0013 0.1 877 0.6222 0.90 03 0.40 11 Poor heal th Yes 53.3 (40.0 –66 .7) 22.2 (11.1 –44.4 ) 16 .7 (8.3 –37.5 ) 20 .0 (13. 3– 40.0) 33.3 (22.2 –55.6 ) 100 (66.7 –100) 38.9 (27.8 –55.6) No 26.7 (20.0 –33 .3) 0 (0 –5.6) 8. 3 (0 –16 .7) 20 .0 (6.7 –26.7 ) 22.2 (11.1 –33.3 ) 100 (83.3 –100) 27.8 (22.2 –38.9) p-value < 0.0001 < 0.0001 < 0.000 1 0.0 134 0.0002 0.85 15 0.00 03 Da ily care of a re lative or friend Yes 36.7 (26.7 –53 .3) 11.1 (0 –22 .2) 16 .7 (4.2 –41.7 ) 26 .7 (20. 0– 43.3) 33.3 (11.1 –50.0 ) 100 (83.3 –100) 38.9 (27.8 –50.0) No 33.3 (20.0 –46 .7) 0 (0 –16.7) 8. 3 (0 –16 .7) 13 .3 (6.7 –26.7 ) 22.2 (11.1 –33.3 ) 100 (66.7 –100) 27.8 (22.2 –38.9) p-value 0.15 79 0.2598 0.0048 0.0006 0.1544 0.45 44 0.00 24 Pro blem(s) with spouse or partne r Yes 33.3 (20.0 –40 .0) 0 (0 –5.6) 12 .5 (0 –16.7) 20 .0 (20. 0– 26.7) 22.2 (11.1 –33.3 ) 100 (83.3 –100) 33.3 (27.8 –44.4) No 33.3 (20.0 –46 .7) 0 (0 –22.2) 8. 3 (0 –25 .0) 20 .0 (6.7 –33.3 ) 22.2 (11.1 –33.3 ) 100 (83.3 –100) 33.3 (22.2 –38.9) p-value 0.90 14 0.1837 0.7 097 0.2 291 0.4988 0.66 43 0.24 47 Berea vemen t Yes 33.3 (26.7 –53 .3) 5.6 (0 –22.2) 25 .0 (8.3 –33.3 ) 20 .0 (6.7 –33.3 ) 33.3 (11.1 –44.4 ) 100 (83.3 –100) 38.9 (27.8 –50.0) No 33.3 (20.0 –46 .7) 0 (0 –16.7) 8. 3 (0 –16 .7) 20 .0 (6.7 –26.7 ) 22.2 (11.1 –33.3 ) 100 (75.0 –100) 27.8 (22.2 –38.9) p-value 0.02 45 0.4799 < 0.000 1 0.2 856 0.0411 0.90 75 0.02 78 Se rious illn ess of a re lative or friend Yes 33.3 (26.7 –53 .3) 0 (0 –16.7) 16 .7 (0 –33.3) 20 .0 (10. 0– 33.3) 22.2 (11.1 –44.4 ) 100 (83.3 –100) 38.9 (27.8 –50.0) No 33.3 (20.0 –46 .7) 0 (0 –16.7) 8. 3 (0 –16 .7) 20 .0 (6.7 –26.7 ) 22.2 (11.1 –33.3 ) 100 (66.7 –100) 27.8 (22.2 –38.9) p-value 0.13 79 0.7422 0.0029 0.1 529 0.2481 0.38 12 < 0.0001 Pro blems(s ) wit h offs pring Yes 40.0 (26.7 –60 .0) 11.1 (0 –33 .3) 16 .7 (8.3 –25.0 ) 20 .0 (6.7 –33.3 ) 33.3 (11.1 –44.4 ) 83.3 (66.7 –10 0) 44.4 (27.8 –55.6) No 33.3 (20.0 –46 .7) 0 (0 –16.7) 8. 3 (0 –25 .0) 20 .0 (6.7 –26.7 ) 22.2 (11.1 –33.3 ) 100 (83.3 –100) 27.8 (22.2 –38.9) p-value 0.03 52 0.0157 0.0 456 0.5 022 0.0044 0.26 98 0.00 54 Rela tiona l probl em (s) with friends or relativ es Yes 46.7 (33.3 –60 .0) 25.0 (11.1 –38.9 ) 20 .8 (8.3 –50.0 ) 26 .7 (20. 0– 66.7) 50.0 (44.4 –55.6 ) 100 (83.3 –100) 52.8 (27.8 –58.3) No 33.3 (20.0 –46 .7) 0 (0 –16.7) 8. 3 (0 –25 .0) 20 .0 (6.7 –26.7 ) 22.2 (11.1 –33.3 ) 100 (83.3 –100) 33.3 (22.2 –38.9) p-value 0.01 37 0.0012 0.0 305 0.0 894 0.0004 0.65 44 0.05 28 Unsa tisfacto ry e nvironment Yes 40.0 (40.0 –50 .0) 11.1 (5.6 –25.0) 16 .7 (16. 7– 33.3) 33 .3 (20. 0– 46.7) 44.4 (33.3 –66.7 ) 100 (83.3 –100) 55.6 (50.0 –66.7)
Table 2 Comparison of scores for dim ensions on the LEIPAD scale according to the characteristics of the participants (Continued) Physi cal Function Self-Care D epression and Anxiet y C o gnitive Function ing Social Fun ctioni ng Sexu al Fun ctioni ng Life Satisfaction No 33.3 (20.0 –46 .7) 0 (0 –16.7) 8. 3 (0 –25 .0) 20 .0 (6.7 –26.7 ) 22.2 (11.1 –33.3 ) 100 (75.0 –100) 30.6 (22.2 –38.9) p-value 0.01 08 0.0453 0.0048 0. 0115 0.0002 0.62 55 0.00 02 Perc eived mod est inco me Yes 40.0 (26.7 –60 .0) 11.1 (0 –27 .8)) 16 .7 (0 –33.3) 26 .7 (13. 3– 46.7) 22.2 (11.1 –33.3 ) 100 (83.3 –100) 38.9 (27.8 –44.4) No 26.7 (20.0 –40 .0) 0 (0 –11.1) 8. 3 (0 –16 .7) 13 .3 (6.7 –26.7 ) 22.2 (11.1 –33.3 ) 100 (66.7 –100) 27.8 (22.2 –38.9) p-value < 0.0001 0.0024 0.0002 0.0036 0.0467 0.06 67 0.00 01 Fin ancial worries Yes 40.0 (26.7 –53 .3) 2.8 (0 –22.2) 16 .7 (8.3 –16.7 ) 20 .0 (13. 3– 40.0) 22.2 (11.1 –44.4 ) 91.7 (75.0 –10 0) 44.4 (33.3 –55.6) No 33.3 (20.0 –46 .7) 0 (0 –16.7) 8. 3 (0 –25 .0) 20 .0 (6.7 –26.7 ) 22.2 (11.1 –33.3 ) 100 (83.3 –100) 27.8 (22.2 –38.9) p-value 0.15 97 0.6878 0.1 492 0.1 479 0.2374 0.86 99 0.00 03 High scores indicate a poorer quality of life For age and number of health problems, Spearman ’s correlation coefficients are given. For sex, marital status, educational level, driving a car, hospital admission and life events during the previ ous 12 months, medians (interquartile range) are given. Statistical significance (p -value< 0.0073) is shown in bold type
unsatisfactory, income perceived as modest and financial worries were self-reported by participants and recorded. The variables analyzed were those that were studied and that had an impact on the HRQoL of community-dwelling elderly people aged 65 years and over [5,19].
HRQoL was assessed by the LEIPAD questionnaire, a brief self-administered questionnaire for community-dwelling people aged 65 years and over [17] that allows an easy individual assessment of older people’s HRQoL and can be used for medical and psychosocial interven-tions [17]. The questionnaire is composed of 31 items grouped into seven scales:‘Physical Function’ (5 items), ‘Self-Care’ (6 items), ‘Depression and Anxiety’ (4 items), ‘Cognitive Functioning’ (5 items), ‘Social Functioning’ (3 items),‘Sexual Functioning’ (2 items) and ‘Life Satis-faction’ (6 items). All items are rated on a 4-point Likert scale, going from 0 (best HRQoL) to 3 (worst). A total score is calculated for each scale by adding up the individual scores of the items (provided that answers are given to all the questions). The score is then con-verted on a linear scale from 0 to 100, with lower scores indicating a better HRQoL. Its psychometric qualities have been widely demonstrated [16–18, 20]. A French version of the questionnaire was validated by our team specifically for use among community–dwelling people aged 80 years and above [18]. It showed very good ac-ceptability, with response rates to each of the LEIPAD scales greater than 88%. Good internal consistency (Cronbach’s alpha ranging from 0.68 to 0.87) and strong test-retest reliability of the LEIPAD scales
(intraclass correlation coefficients ranging from 0.77 to 0.95) were found.
Statistical analyses
SAS v9.4 was used for all the statistical analyses. Statis-tical significance was set atp-value < 0.05.
Continuous data were expressed as the means and standard deviations (SD) or medians and interquartile range (IQR), and categorical data as frequencies and percentages.
Participants’ marital status, educational level, living status, ability to drive and hospital admission during the previous 12 months were compared according to gender and age by Chi-square tests and non-parametric Mann-Whitney tests, respectively. Current health problems according to the ICD-10 classification were compared according to gender by Chi-square tests or Fisher exact tests. The number of health problems was compared ac-cording to gender by non-parametric Mann-Whitney tests.
Bivariate associations between continuous scores on the LEIPAD scales (non-normal distributions) and par-ticipants’ characteristics (sociodemographic characteris-tics, self-reported health problems and life events in the previous 12 months) were analysed by non-parametric Mann-Whitney tests and Spearman’s correlation coeffi-cients (to estimate correlations between age and scores). Multiple group comparison tests of the LEIPAD scales were performed with a Bonferroni correction, resulting in a corrected significantp value of p = 0.0073.
Table 3 LEIPAD‘Physical Function’ scale: ordinal logistic regressions (cumulative logit models) Bivariate ordinal
logistic regression
Multivariate ordinal logistic regressiona
Prevalence of‘poor’ HRQoL (%) OR (95% CI) p-value AOR (95% CI) p-value
Gender
Male 17.7 Ref Ref
Female 40.8 2.78 (1.58–4.90) 0.0004 1.99 (1.02–3.89) 0.0439
Age
(years) 84.9 (3.6)b 1.10 (1.04–1.17) 0.0019 1.13 (1.02–1.26) 0.0187
Marital status
Married or with a partner 27.2 Ref
Never-married, widowed, divorced 33.3 1.58 (0.91–2.77) 0.1076
Educational level
High school or higher education 17.9 Ref Ref
Pre-high school 34.6 2.24 (1.14–4.37) 0.0187 2.62 (1.21–5.68) 0.0147
Driving a car
Yes 17.3 Ref
No 49.3 3.45 (1.90–6.27) < 0.0001
Hospital admission during the previous 12 months
No 24.8 Ref
Yes 51.3 1.66 (1.04–2.65) 0.0354
Number of health problems 5.6 (1.9)b 1.74 (1.47–2.07) < 0.0001 1.63 (1.32–2.01) < 0.0001
Life events during the previous 12 months Illness No 22.3 Ref Yes 51.0 3.38 (1.77–6.43) 0.0002 Poor health No 15.4 Ref Ref Yes 70.5 13.24 (6.03–29.05) < 0.0001 9.22 (3.84–22.11) < 0.0001
Daily care of a relative or friend
No 28.3 Ref
Yes 35.7 1.57 (0.74–3.33) 0.2415
Bereavement
No 27.3 Ref
Yes 36.8 1.58 (0.81–3.10) 0.1797
Serious illness of a relative or friend
No 29.4 Ref
Yes 29.8 1.30 (0.70–2.43) 0.4045
Problems(s) with offspring
No 27.3 Ref
Yes 40.7 1.97 (0.91–4.25) 0.0858
Relational problem(s) with friends or relatives
No 27.6 Ref
Yes 60.0 4.74 (1.28–17.49) 0.0196
Unsatisfactory environment
Owing to their asymmetric and non-normal distribu-tions, the LEIPAD scores could not be included as dependent variables in multiple linear regression models. Some authors have dichotomized HRQoL scores accord-ing to the lowest quartile [21, 22] or according to the median [23, 24]. The quartiles have also been used to categorize HRQoL scores into four classes [24]. We did not dichotomize LEIPAD HRQoL scores because we would have discarded too much valuable information. We evaluated the categorization in four classes accord-ing to quartiles but there were insufficient numbers in each category. Hence, we chose an intermediate solu-tion, and LEIPAD HRQoL scores were categorized into three ordinal classes designated as ‘poor’, ‘average’ and ‘good’ HRQoL, according to the first and third quartiles. The EP who had lower scores (lower than or equal to the first quartile) were considered to have‘good’ quality of life, those having higher scores (greater than or equal to the third quartile) to have ‘poor’ quality of life, and those having intermediate scores (greater than the first quartile and lower than the third quartile) to have ‘aver-age’ quality of life.
Bivariate ordinal logistic regressions were performed to assess the association between participants’ charac-teristics and LEIPAD scores categorized into the three ordinal classes. Crude odds ratios (OR), 95% confi-dence interval (CI) and its statistical significance were estimated. Finally, factors associated with HRQoL scores in the bivariate logistic regressions (found to be significant at the p-value level of 0.20 [25]) were included in multivariate ordinal logistic regression models using a forward selection, adjusting for gender and age. Adjusted odds ratio (AOR), 95% CI and its statistical significance were estimated. Cumulative
logit models were used to study associations between factors and poorer quality of life. The parallel-lines model assumptions were verified. If the cumulative logit model was rejected, the adjacent categories model was used.
Results
Description of respondents
The participation of EP in the study is described in Fig.1. The sociodemographic characteristics of the 184 EP recruited according to gender are given in Table1. The participants were aged between 80 and 95 years: 61.4% between 80 and 84 years, 30.4% between 85 and 89, and 8.2% between 90 and 95. They were 2.8% never married, 58.6% married or living with a partner, 36.5% widowed and 2.2% divorced. The women were older than the men, were more often widowed, more often living alone and less likely to be driving. Those who were still driving were younger (83.2 years [SD 2.7] vs. 85.0 years [SD 3.8], p = 0.0009). The rate of hospital admission in the previ-ous 12 months was 26.1% in those aged 80–84 years, 19.2% in those aged 85–89 years and 13.3% in those aged 90–95 years. It did not differ according to the partici-pants’ gender (p = 0.1017) or age (p = 0.2279).
The events that had most frequently disrupted the life of the participants in the 12 months before the study are described in Table 1. There was no difference between women and men, except for perceived modest income and no difference according to age.
The health problems self-reported by the participants according to the ICD-10 classification are given in Sup-plementary Table 1. Almost all participants (97.8%) mentioned at least one health problem, with 10 being the greatest number. The women reported significantly
Table 3 LEIPAD‘Physical Function’ scale: ordinal logistic regressions (cumulative logit models) (Continued)
Bivariate ordinal logistic regression
Multivariate ordinal logistic regressiona
Prevalence of‘poor’ HRQoL (%) OR (95% CI) p-value AOR (95% CI) p-value
Yes 41.7 2.32 (0.76–7.02) 0.1381
Perceived modest income
No 20.4 Ref
Yes 49.1 3.47 (1.84–6.54) 0.0001
Financial worries
No 28.2 Ref
Yes 41.2 1.94 (0.76–4.95) 0.1678
Ordinal logistic regressions: (1) LEIPAD‘Physical Function’ categorized score (‘poor’, ‘average’ or ‘good’ HRQoL) was used as the dependent variable. (2) Independent variables were entered as categorical variables except for age and number of health problems, which were entered as continuous variables. (3) OR odds ratio; CI confidence interval; AOR adjusted odds ratio
a
Multiple regression: adjusted for sex, age and for all variables included in the model
b
Mean (SD) in the‘poor’ HRQoL category Statistical significance is shown in bold type
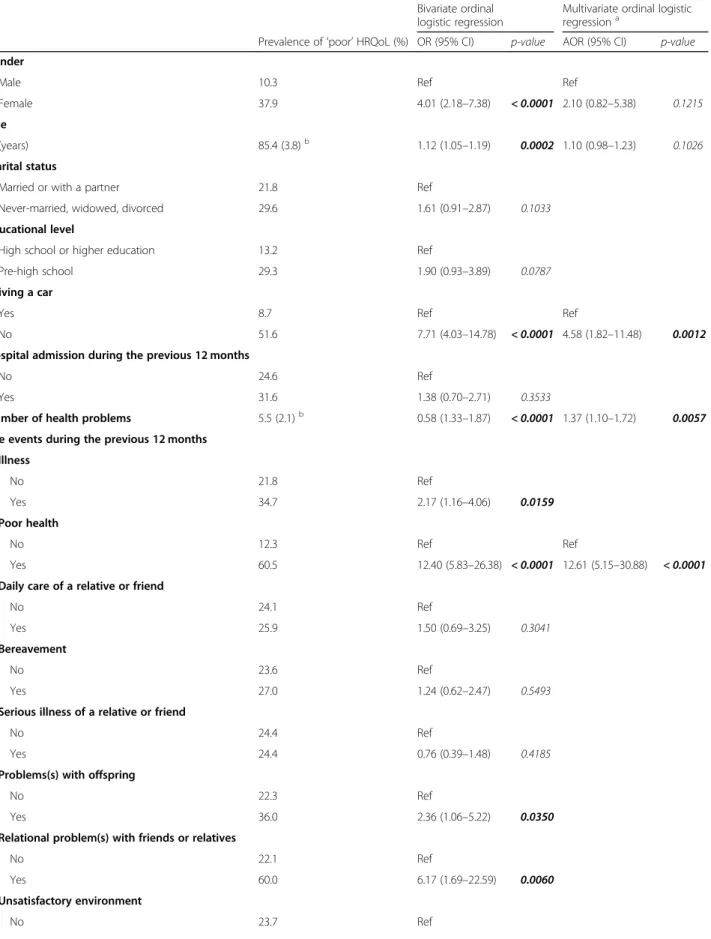
Table 4 LEIPAD‘Self-Care’ scale: ordinal logistic regressions (cumulative logit models) Bivariate ordinal logistic regression
Multivariate ordinal logistic regressiona
Prevalence of‘poor’ HRQoL (%) OR (95% CI) p-value AOR (95% CI) p-value Gender
Male 10.3 Ref Ref
Female 37.9 4.01 (2.18–7.38) < 0.0001 2.10 (0.82–5.38) 0.1215
Age
(years) 85.4 (3.8)b 1.12 (1.05–1.19) 0.0002 1.10 (0.98–1.23) 0.1026
Marital status
Married or with a partner 21.8 Ref
Never-married, widowed, divorced 29.6 1.61 (0.91–2.87) 0.1033
Educational level
High school or higher education 13.2 Ref
Pre-high school 29.3 1.90 (0.93–3.89) 0.0787
Driving a car
Yes 8.7 Ref Ref
No 51.6 7.71 (4.03–14.78) < 0.0001 4.58 (1.82–11.48) 0.0012
Hospital admission during the previous 12 months
No 24.6 Ref
Yes 31.6 1.38 (0.70–2.71) 0.3533
Number of health problems 5.5 (2.1)b 0.58 (1.33–1.87) < 0.0001 1.37 (1.10–1.72) 0.0057
Life events during the previous 12 months Illness No 21.8 Ref Yes 34.7 2.17 (1.16–4.06) 0.0159 Poor health No 12.3 Ref Ref Yes 60.5 12.40 (5.83–26.38) < 0.0001 12.61 (5.15–30.88) < 0.0001
Daily care of a relative or friend
No 24.1 Ref
Yes 25.9 1.50 (0.69–3.25) 0.3041
Bereavement
No 23.6 Ref
Yes 27.0 1.24 (0.62–2.47) 0.5493
Serious illness of a relative or friend
No 24.4 Ref
Yes 24.4 0.76 (0.39–1.48) 0.4185
Problems(s) with offspring
No 22.3 Ref
Yes 36.0 2.36 (1.06–5.22) 0.0350
Relational problem(s) with friends or relatives
No 22.1 Ref
Yes 60.0 6.17 (1.69–22.59) 0.0060
Unsatisfactory environment
more health problems than the men. The number of health problems was not correlated with age (r = 0.06, p = 0.4034). The most commonly cited diseases were those of the circulatory system, followed by disorders of the musculoskeletal system and connective tissue, and endocrine, nutritional and metabolic disorders. In addition, almost half of the participants reported visual disturbances or impairment or hearing impairment or deafness. Women reported more disorders of the mus-culoskeletal system and connective tissue and mental and behavioural disorders. Age was not related to health problems, except for mental and behavioural disorders for which participants were older (84.7 years (SD 3.4) vs. 83.6 years (SD 3.3),p = 0.0243).
Health-related quality of life
The mean HRQoL scores of the LEIPAD scales are given in Table2. High scores reflect a poorer HRQoL.
The highest score was found on the ‘Sexual Function-ing’ scale, with 59.1% of participants having the max-imum score of 100. The answers showed that 61.2% were not interested in sexuality at all, 82.7% had no sex-ual activity and 14.5% occasionally.
Low scores, indicating better HRQoL, were obtained on the ‘Self-Care’ and ‘Depression and Anxiety’ scales with 50.9 and 40.8% of responders, respectively, having the minimum score of zero. The good responses ob-tained on the ‘Self-Care’ scale were due to the extent of the participants’ autonomy since 85.1% were able to get dressed unaided, 98.9% to eat without help, 84.1% to take a bath or shower by themselves and 72.3% to go shopping alone. For the ‘Depression and Anxiety’ scale, 16.1% admitted to feeling anxious or very anxious and in 6.1% of cases the effect on them was strong or fairly
strong. Of the 4.5% who felt depressed or very de-pressed, 5.1% considered the effects to be strong or fairly strong.
Overall, 92.3% of the participants were satisfied with their social contacts and relations with other people, 87.3% with the way in which they organised their free or leisure-time activities and 86.7% with their financial situation.
In comparison to their past life, 74.9% of responders were satisfied with their current circumstances. How-ever, 54.4% considered the future would be worse or far worse, and for 57.5% of the EP the idea of the future prevented them from planning or achieving what they would like to do. The participants considered their gen-eral state of health to be good or very good (69.1%), average (28.7%) or bad (2.2%).
Distributions of the categorized LEIPAD scores into three ordinal classes according to the first and third quartiles are shown in Fig. 2. The prevalence of ‘poor’ quality of life was 30.5% for the‘Physical Function’ scale, 25.4% for the ‘Self-Care’ scale, 27.9% for the ‘Depression and Anxiety’ scale, 35.8% for the ‘Cognitive Functioning’ scale, 35.7% for the‘Social Functioning’ scale, 59.1% for the ‘Sexual Functioning’ scale and 39.9% for the ‘Life Satisfaction’ scale. The categorized score of ‘Sexual Functioning’ was binary (‘poor’ versus ‘good’).
Risk factors for impaired health-related quality of life
The LEIPAD continuous scores of the EP were com-pared by bivariate analysis according to gender, age, marital status, educational level, ability to drive, and hos-pital admission, number of health problems and life events during the previous 12 months (Table2).
Table 4 LEIPAD‘Self-Care’ scale: ordinal logistic regressions (cumulative logit models) (Continued)
Bivariate ordinal logistic regression
Multivariate ordinal logistic regressiona
Prevalence of‘poor’ HRQoL (%) OR (95% CI) p-value AOR (95% CI) p-value
Yes 33.3 2.37 (0.79–7.06) 0.1230
Perceived modest income
No 18.8 Ref
Yes 36.5 2.61 (1.39–4.88) 0.0028
Financial worries
No 23.6 Ref
Yes 31.3 1.26 (0.48–3.31) 0.6458
Ordinal logistic regressions: (1) LEIPAD‘Self-Care’ categorized score (‘poor’, ‘average’ or ‘good’ HRQoL) was used as the dependent variable. (2) Independent variables were entered as categorical variables, except for age and number of health problems which were entered as continuous variables. (3) OR odds ratio; CI confidence interval; AOR adjusted odds ratio
a
Multiple regression: adjusted for sex, age and for all variables included in the model
b
Mean (SD) in the‘poor’ HRQoL category Statistical significance is shown in bold type
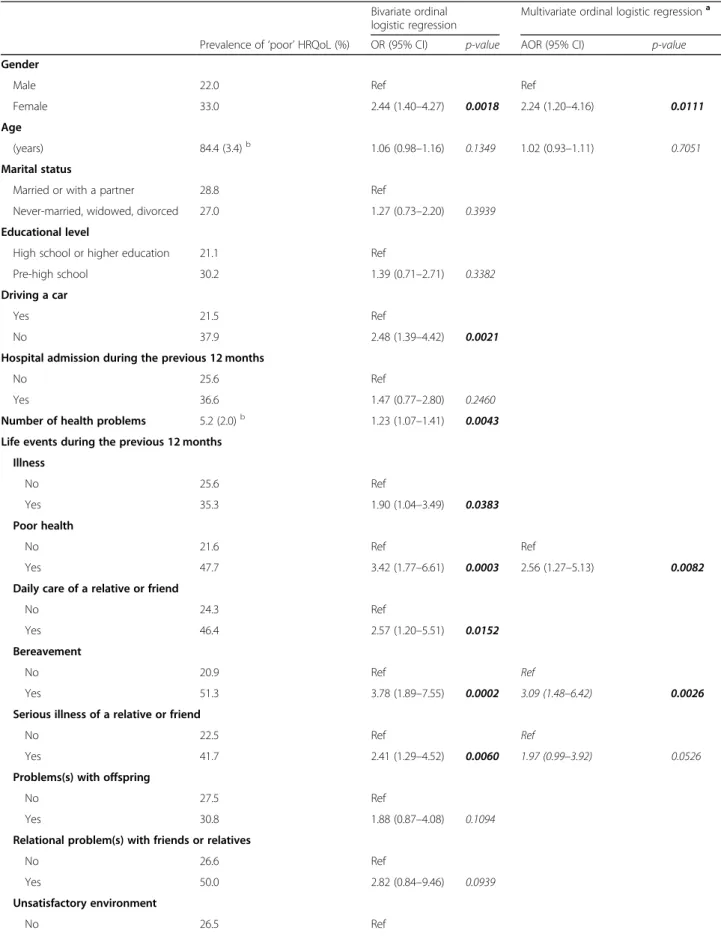
Table 5 LEIPAD‘Depression and Anxiety’ scale: ordinal logistic regressions (cumulative logit models) Bivariate ordinal
logistic regression
Multivariate ordinal logistic regressiona
Prevalence of‘poor’ HRQoL (%) OR (95% CI) p-value AOR (95% CI) p-value
Gender
Male 22.0 Ref Ref
Female 33.0 2.44 (1.40–4.27) 0.0018 2.24 (1.20–4.16) 0.0111
Age
(years) 84.4 (3.4)b 1.06 (0.98–1.16) 0.1349 1.02 (0.93–1.11) 0.7051
Marital status
Married or with a partner 28.8 Ref
Never-married, widowed, divorced 27.0 1.27 (0.73–2.20) 0.3939
Educational level
High school or higher education 21.1 Ref
Pre-high school 30.2 1.39 (0.71–2.71) 0.3382
Driving a car
Yes 21.5 Ref
No 37.9 2.48 (1.39–4.42) 0.0021
Hospital admission during the previous 12 months
No 25.6 Ref
Yes 36.6 1.47 (0.77–2.80) 0.2460
Number of health problems 5.2 (2.0)b 1.23 (1.07–1.41) 0.0043
Life events during the previous 12 months Illness No 25.6 Ref Yes 35.3 1.90 (1.04–3.49) 0.0383 Poor health No 21.6 Ref Ref Yes 47.7 3.42 (1.77–6.61) 0.0003 2.56 (1.27–5.13) 0.0082
Daily care of a relative or friend
No 24.3 Ref
Yes 46.4 2.57 (1.20–5.51) 0.0152
Bereavement
No 20.9 Ref Ref
Yes 51.3 3.78 (1.89–7.55) 0.0002 3.09 (1.48–6.42) 0.0026
Serious illness of a relative or friend
No 22.5 Ref Ref
Yes 41.7 2.41 (1.29–4.52) 0.0060 1.97 (0.99–3.92) 0.0526
Problems(s) with offspring
No 27.5 Ref
Yes 30.8 1.88 (0.87–4.08) 0.1094
Relational problem(s) with friends or relatives
No 26.6 Ref
Yes 50.0 2.82 (0.84–9.46) 0.0939
Unsatisfactory environment
Multivariate ordinal logistic regressions were then per-formed to explore the factors associated with poorer quality of life. LEIPAD scores categorized into three or-dinal classes (‘poor’, ‘average’ or ‘good’ HRQoL) were used as dependent variables, and the significant factors in bivariate ordinal logistic regressions (p < 0.20) were covariates adjusted for gender and age. Marital status and living arrangement could not be added in regres-sions together because of collinearity. We conducted separate analysis with these variables. As the results were the same, we chose to present the models including marital status (which was also the most significant in models).
For the ‘Physical Function’ scale (Table 3), being a woman, older age, pre-high school educational level, greater number of health problems and self-reported poor health during the previous 12 months were associ-ated with poorer quality of life. For the ‘Self-Care’ scale (Table 4), not driving, greater number of health prob-lems and reported poor health during the previous 12 months negatively affected quality of life. For the ‘De-pression and Anxiety’ scale (Table5), female EP who re-ported poor health, bereavement, and serious illness of a relative or friend during the past year were more likely to have poorer quality of life. For the ‘Cognitive Func-tioning’ scale (Table 6), not being able to drive and pro-viding daily care for a relative or friend during the previous 12 months were associated with poorer quality of life. For the ‘Social Functioning’ scale (Table 7), the risk of being in a lower category (and hence of having poorer quality of life) increased with older age, when participants were not able to drive a car, when they re-ported relational problems with friends or relatives and an unsatisfactory environment during the previous year.
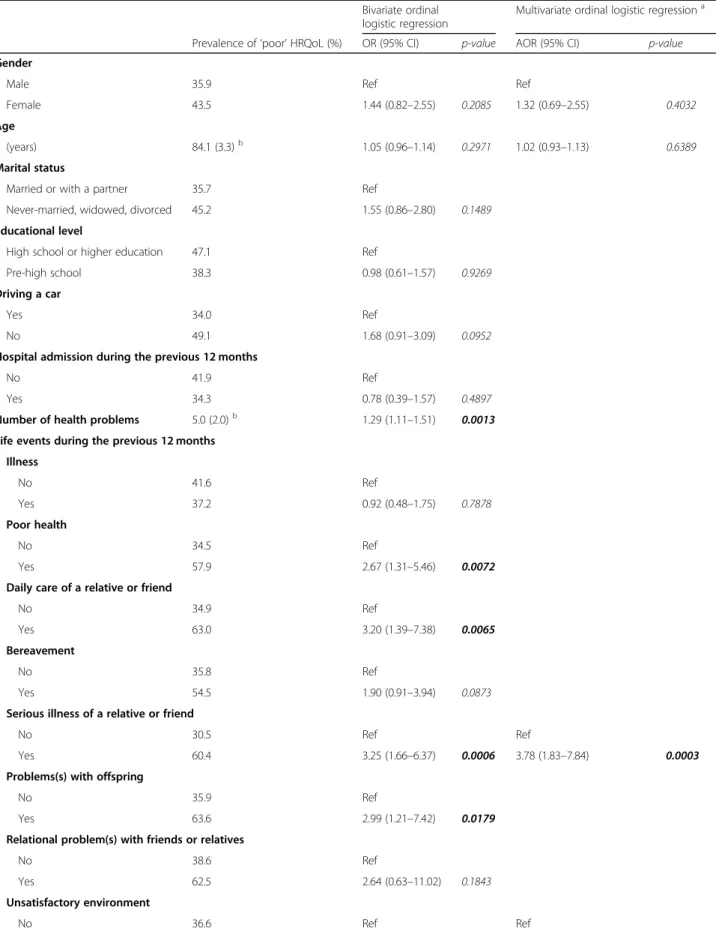
For the ‘Sexual Functioning’ scale (Table 8), never-married, widowed or divorced female EP with a pre-high school educational level were more likely to have poorer quality of life. Those who reported problems with off-spring were more likely to have better quality of life in the sexual domain. For the ‘Life Satisfaction’ scale (Table9), a serious illness of a relative or friend, unsatis-factory environment, perceived modest income and fi-nancial worries during the previous 12 months were associated with poorer quality of life.
Discussion
This study makes two main contributions to the previ-ous literature on HRQoL in EP. It is the first to assess the HRQoL of community-dwelling people aged 80 years and over (who are often few in number or absent from studies or whose age group is not studied specifically) with the use of a self-administered questionnaire specif-ically adapted to EP, the LEIPAD scale. In addition, it deals in detail with the comorbidities and life events of this age group and their relation to HRQoL.
Our study was guided by several important methodo-logical aspects.
– HRQoL was assessed with a questionnaire touching on various aspects of daily life specifically aimed at EP. It has been validated in French for use among different sample populations including community– dwelling people aged 80 years and above, and its psychometric qualities, notably construct validity, internal consistency and reproducibility, have been ascertained [16,18,20].
– Our sample size is to our knowledge, after a reference database search, the largest to be used in an European Table 5 LEIPAD‘Depression and Anxiety’ scale: ordinal logistic regressions (cumulative logit models) (Continued)
Bivariate ordinal logistic regression
Multivariate ordinal logistic regressiona
Prevalence of‘poor’ HRQoL (%) OR (95% CI) p-value AOR (95% CI) p-value
Yes 46.2 3.25 (1.10–9.60) 0.0333
Perceived modest income
No 23.1 Ref
Yes 39.2 2.24 (1.21–4.15) 0.0100
Financial worries
No 29.6 Ref
Yes 12.5 1.12 (0.60–2.09) 0.7260
Ordinal logistic regressions: (1) LEIPAD‘Depression and Anxiety’ categorized score (‘poor’, ‘average’ or ‘good’ HRQoL) was used as the dependent variable. (2) Independent variables were entered as categorical variables, except for age and number of health problems which were entered as continuous variables. (3) OR odds ratio; CI confidence interval; AOR adjusted odds ratio
a
Multiple regression: adjusted for sex, age and for all variables included in the model
b
Mean (SD) in the‘poor’ HRQoL category Statistical significance is shown in bold type
Table 6 LEIPAD‘Cognitive Functioning’ scale: ordinal logistic regressions (cumulative logit models) Bivariate ordinal
logistic regression
Multivariate ordinal logistic regressiona
Prevalence of‘poor’ HRQoL (%) OR (95% CI) p-value AOR (95% CI) p-value
Gender
Male 33.3 Ref Ref
Female 38.0 1.41 (0.81–2.46) 0.2202 0.62 (0.29–1.33) 0.2199
Age
(years) 84.5 (3.7)b 1.10 (1.01–1.20) 0.0237 1.08 (0.99–1.19) 0.0969
Marital status
Married or with a partner 37.9 Ref
Never-married, widowed, divorced 32.4 0.89 (0.50–1.56) 0.6764
Educational level
High school or higher education 34.2 Ref
Pre-high school 36.6 1.05 (0.54–2.03) 0.8915
Driving a car
Yes 29.1 Ref Ref
No 46.0 1.98 (1.10–3.58) 0.0230 2.59 (1.14–5.86) 0.0226
Hospital admission during the previous 12 months
No 34.9 Ref
Yes 41.0 1.17 (0.60–2.27) 0.6401
Number of health problems 5.0 (1.8)b 1.18 (1.02–1.36) 0.0266
Life events during the previous 12 months Illness No 33.1 Ref Yes 44.9 1.53 (1.02–2.28) 0.0397 Poor health No 32.0 Ref Yes 48.8 1.82 (0.95–3.50) 0.0725
Daily care of a relative or friend
No 32.1 Ref Ref
Yes 57.1 2.93 (1.32–6.51) 0.0082 3.30 (1.44–7.58) 0.0049
Bereavement
No 32.8 Ref
Yes 48.6 1.49 (0.75–2.95) 0.2503
Serious illness of a relative or friend
No 32.5 Ref
Yes 45.8 1.47 (0.79–2.74) 0.2292
Problems(s) with offspring
No 34.5 Ref
Yes 46.2 1.34 (0.61–2.91) 0.4675
Relational problem(s) with friends or relatives
No 35.3 Ref
Yes 55.6 1.95 (0.54–7.03) 0.3078
Unsatisfactory environment
study specifically focused on community-dwelling people aged 80 years and over whose HRQoL was assessed by a questionnaire specially adapted to their age group.
– Our study population was comparable to those in other published reports about French EP with regard to sociodemographic characteristics (French sample of 168 EP in the ESEMeD study) [13], living status [26,27], ability to drive [28,29], autonomy [30] and medical characteristics [27] except for the rate of eye diseases according to the ICD 10
classification, which was lower than that recorded in the general population of the same age [31], possibly because participants unable to complete the
questionnaires unaided were not included in our study.
Some key points emerge from our study and are dis-cussed in detail below: the declared HRQoL of EP aged 80 years of age and over was good for most dimensions but in certain domains was beginning to deteriorate, markedly so for the ‘Sexual Functioning’ scale; the fe-male EP declared a significantly less satisfactory HRQoL in some domains; and some life events, other than health problems, negatively affected the HRQoL of EP in this age group.
The declared HRQoL of our study population was good for most dimensions but in certain domains was beginning to deteriorate. The best HRQoL score was obtained on the‘Self-Care’ scale. This is an interesting finding because previous studies [13–15] used EQ-5D, in which self-care has a significant ceiling effect [14,32]. Our results are consistent with those of a French survey, Handicap Santé 2008 [33], that used other means of
assessment and according to which life expectancy in France at 65 years with no restrictions of personal care ac-tivities was 15.6 years for men and 17.9 years for women. These concordant results can be explained by the fairly good autonomy of our community-dwelling participants, most of whom were able to eat meals, get dressed, take a bath or shower and do their shopping without assistance. Similar levels of autonomy were also observed in several French other surveys [27,30, 34]. For the‘Physical Func-tion’ and the ‘Self-Care’ scales, a greater number of health problems and reported poor health during the previous 12 months negatively affected quality of life, which corrob-orates and complements previous data for these domains in studies of populations that were generally less elderly or that focused on specific diseases [11,12,35].
A large majority of the participants also had a good HRQoL score on the ‘Depression and Anxiety’ scale. The score was not correlated with age, as in five other studies [13–15,36,37]. Our results are in line with those observed in the dimension of anxiety and depression in the EQ-5D [13–15]. However, the LEIPAD scales give a more nuanced description of this domain in the very elderly owing to distinct assessments of anxiety and de-pression and to an appreciation at four levels of intensity not only of what the participants feel subjectively but also of the functional impact of these feelings on their lives, which is a key factor. Our results in this domain can be explained in part by the state of health and indi-vidual autonomy of the participants. The effects of health problems on depression and anxiety have been described in a younger age group [8]. We also observed that poor health, bereavement and the illness of a rela-tive or friend are factors that negarela-tively affect this do-main of HRQoL in those aged 80 or over. Almost three
Table 6 LEIPAD‘Cognitive Functioning’ scale: ordinal logistic regressions (cumulative logit models) (Continued)
Bivariate ordinal logistic regression
Multivariate ordinal logistic regressiona
Prevalence of‘poor’ HRQoL (%) OR (95% CI) p-value AOR (95% CI) p-value
Yes 61.5 3.25 (1.04–10.21) 0.0431
Perceived modest income
No 28.6 Ref
Yes 52.8 1.71 (1.13–2.57) 0.0106
Financial worries
No 35.6 Ref
Yes 43.8 1.67 (0.63–4.40) 0.3025
Ordinal logistic regressions: (1) LEIPAD‘Cognitive Functioning’ categorized score (‘poor’, ‘average’ or ‘good’ HRQoL) was used as the dependent variable. (2) Independent variables were entered as categorical variables, except for age and number of health problems which were entered as continuous variables. (3) OR odds ratio; CI confidence interval; AOR adjusted odds ratio
a
Multiple regression: adjusted for sex, age and for all variables included in the model
b
Mean (SD) in the‘poor’ HRQoL category Statistical significance is shown in bold type
Table 7 LEIPAD‘Social Functioning’ scale: ordinal logistic regressions (adjacent categories models) Bivariate ordinal
logistic regression
Multivariate ordinal logistic regressiona
Prevalence of‘poor’ HRQoL (%) OR (95% CI) p-value AOR (95% CI) p-value
Gender
Male 30.5 Ref Ref
Female 40.0 1.14 (0.81–1.60) 0.4590 0.61 (0.36–1.04) 0.0709
Age
(years) 84.5 (3.3)b 1.05 (1.00
–1.11) 0.0595 1.07 (1.00–1.14) 0.0439
Marital status
Married or with a partner 32.4 Ref
Never-married, widowed, divorced 39.2 1.20 (0.85–1.70) 0.2996
Educational level
High school or higher education 30.8 Ref
Pre-high school 37.3 1.30 (0.86–1.97) 0.2168
Driving a car
Yes 27.8 Ref Ref
No 47.8 1.57 (1.09–2.25) 0.0147 2.00 (1.14–3.51) 0.0155
Hospital admission during the previous 12 months
Yes 31.7 Ref
No 37.8 1.09 (0.73–1.64) 0.6703
Number of health problems 4.9 (1.8)b 1.14 (1.05–1.25) 0.0037
Life events during the previous 12 months Illness Yes 32.7 Ref No 38.2 1.09 (0.75–1.59) 0.6444 Poor health No 29.1 Ref Yes 57.8 1.92 (1.26–2.92) 0.0026
Daily care of a relative or friend
No 32.9 Ref
Yes 53.6 1.29 (0.80–2.08) 0.2996
Bereavement
No 31.1 Ref
Yes 53.8 1.34 (0.88–2.05) 0.1726
Serious illness of a relative or friend
No 34.4 Ref
Yes 40.8 1.06 (0.72–1.56) 0.7566
Problems(s) with offspring
No 31.9 Ref
Yes 59.3 1.79 (1.07–2.98) 0.0261
Relational problem(s) with friends or relatives
No 32.9 Ref Ref
Yes 90.0 5.28 (1.42–19.61) 0.0129 5.78 (1.46–22.91) 0.0126
Unsatisfactory environment
quarters of our EP reported being satisfied with their current condition in comparison to their past life, feel-ings echoed in studies involving younger elderly partici-pants [8,38]. The fact that half of our respondents were nevertheless pessimistic about their future can be ex-plained by the strategy of “realistic expectations”: the greater the gap between one’s current situation and what one anticipates, the greater the risk of disappointment. To narrow this gap, the very elderly tend to revise their expectations downwards [39].
The ‘Sexual Functioning’ scale had the poorest HRQoL scores in the present study.Almost 60% of the respondents in the group had the highest score in this domain. However, this score did not significantly change as their age increased. Some studies have been made in the general population of the sexuality of EP up to the age of 78 years [40,41] but to our knowledge only a very few studies of HRQoL have included the dimension of sexuality in the very elderly [42]. The response rate for items related to sexuality in our study was high (greater than 95%). In study populations not older than 65 years, the rate is generally far lower. A response rate similar to ours was, however, obtained by Molzhan et al. [42], who reported only 8.7% missing data for items related to sex-ual activity. The correlations evidenced in our study are consistent with the following explanatory hypotheses, which can of course be combined and are not the only ones possible.
– The fact that there were more women among the participants and that they reported a significantly poorer HRQoL for the dimension concerned with sexual activity is in agreement with recent studies
showing that sexuality differs according to gender [42],
– The marital status of people aged 80 years and over plays an important role. In our study only 58.6% of the participants were married or living with a partner, and“having or not having a partner is the best predictor of sexual activity, especially for elderly women” [43,44].
The female EP in our study declared a significantly less satisfactory HRQoLon the‘Physical Function’, ‘De-pression and Anxiety’ and ‘Sexual Functioning’ scales in multivariate analysis, which confirms and complements previous findings for these domains in populations that were generally less elderly or whose quality of life was assessed by generic questionnaires [10, 13, 15, 45–49]. Our findings also showed that the female participants had specific problems related to ageing that could in part ex-plain their less satisfactory HRQoL: they were older than the men, more often widowed and living alone, had a per-ceived modest income, were less likely to be driving and were suffering from significantly more health problems, as reported in previous studies [27,31,37], in particular dis-eases of the musculoskeletal system and connective tissue and mental and behavioural disorders [50,51]. Our study refines the results presented by König, namely that female gender was associated with more problems in most of the EQ-5D dimensions [13]. In our previous study of EP aged 65 years and over [8], HRQoL did not differ significantly according to gender, apart from sexual activity, for which the women reported a less satisfactory HRQoL. It would appear, therefore, that differences between men and women in terms of HRQoL arise with advancing age, which is consistent with findings of the“Vie Quotidienne
Table 7 LEIPAD‘Social Functioning’ scale: ordinal logistic regressions (adjacent categories models) (Continued)
Bivariate ordinal logistic regression
Multivariate ordinal logistic regressiona
Prevalence of‘poor’ HRQoL (%) OR (95% CI) p-value AOR (95% CI) p-value
Yes 84.6 3.67 (1.43–9.43) 0.0071 3.87 (1.45–10.35) 0.0070
Perceived modest income
No 33.1 Ref
Yes 43.4 1.38 (0.94–2.03) 0.0985
Financial worries
No 35.7 Ref
Yes 41.2 1.11 (0.62–2.00) 0.7214
Ordinal logistic regressions: (1) LEIPAD‘Social Functioning’ categorized score (‘poor’, ‘average’ or ‘good’ HRQoL) was used as the dependent variable. (2) Independent variables were entered as categorical variables, except for age and number of health problems which were entered as continuous variables. (3) OR odds ratio; CI confidence interval; AOR adjusted odds ratio
a
Multiple regression: adjusted for sex, age and for all variables included in the model
b
Mean (SD) in the‘poor’ HRQoL category Statistical significance is shown in bold type
Table 8 LEIPAD‘Sexual Functioning’ scale: binary logistic regressions
Bivariate logistic regression
Multivariate logistic regressiona Prevalence of‘poor’ HRQoL (%) OR (95% CI) p-value AOR (95% CI) p-value Gender
Male 43.8 Ref Ref
Female 71.9 3.29 (1.76–6.15) 0.0002 2.58 (1.7–5.69) 0.0183
Age
(years) 84.3 (3.5)b 1.10 (0.99–1.21) 0.0612 1.10 (0.97–1.25) 0.1349
Marital status
Married or with a partner 47.6 Ref Ref
Never-married, widowed, divorced 76.1 3.50 (1.79–6.83) 0.0002 2.75 (1.19–6.32) 0.0176
Educational level
High school or higher education 39.5 Ref Ref
Pre-high school 64.7 2.81 (1.34–5.89) 0.0062 2.92 (1.24–6.89) 0.0141
Driving a car
Yes 50.9 Ref
No 70.3 2.28 (1.18–4.40) 0.0140
Hospital admission during the previous 12 months
No 58.0 Ref
Yes 57.5 0.98 (0.48–2.00) 0.9539
Number of health problems 4.5 (2.0)b 1.01 (0.87–1.18) 0.8712
Life events during the previous 12 months Illness No 60.5 Ref Yes 54.0 0.77 (0.39–1.49) 0.4339 Poor health No 59.3 Ref Yes 53.5 0.79 (0.39–1.59) 0.5033
Daily care of a relative or friend
No 57.2 Ref
Yes 59.3 1.09 (0.47–2.51) 0.8472
Bereavement
No 58.6 Ref
Yes 54.1 0.83 (0.40–1.74) 0.6229
Serious illness of a relative or friend
No 56.0 Ref
Yes 61.2 1.24 (0.63–2.45) 0.5380
Problems(s) with offspring
No 60.1 Ref Ref
Yes 44.4 0.53 (0.23–1.22) 0.1349 0.29 (0.10–0.81) 0.0186
Relational problem(s) with friends or relatives
No 57.4 Ref
Yes 60.0 1.11 (0.30–4.10) 0.8729
Unsatisfactory environment
et Santé” (vqs) survey of 2014, which suggested that in participants aged 75 years or over the situation is un-favourable for women in terms of functional impairments and limitations [27,30]. The female EP also have a lower quality of life for the 'Self-care' dimension and, in multi-variate models, a greater risk compared to men of having a deteriorated quality of life in this dimension. This is con-sistent with the fact that the total life expectancy at 65 years is longer in women compared to men, but that some of these“extra” years are with restrictions of personal care activities [6, 33]. Measuring HRQoL can be useful for studying the impact of some health problems, in particular diseases of the musculoskeletal system and mental and be-havioral disorders, but also the establishment of actions and their impact on HRQoL in the health fields (preven-tion, screening, diagnosis and assessment, medical and psychosocial interventions, rehabilitation), the physical en-vironment (for example, spaces and buildings accessible and useable by people with impairments, adjustment and improvement of elderly people's home) and community and health services (for example, home care, support for informal care) [3,5].
We identified which particular domains of HRQoL in the very elderly, other than those related to health, are negatively affected by life events.For example, an unsatisfactory environment had a negative effect on the ‘Social Functioning’ and ‘Life Satisfaction’ scales. Not be-ing able to drive had a negative effect on the‘Self-Care’, ‘Cognitive Functioning’ and ‘Social Functioning’ scales. Incomes perceived as modest and financial worries dur-ing the previous 12 months were associated with a nega-tive effect on the ‘Life Satisfaction’ scale. These findings are in line with those reported for EP aged between 65 and 75 years in studies of QoL [52, 53] and HRQoL [8]
and enrich those of a study based on the EQ-5D in EP aged 75 years and over [13]. These findings can be useful during policy initiatives to create better age-friendly en-vironments, whether in the field of outdoor environ-ments (for example, support for community interaction and personal independence, places for recreation, phys-ical activity and other leisure activities) or the domain of the social participation (for example, supportive environ-ments for social exchange in the community). These findings can also be useful during policy initiatives con-cerning the domain of transport and mobility (for ex-ample, public transport, on-demand services and other support to improve mobility) [3]. As findings differ from one country to another, it is interesting to have recent data gathered in France.
Limitations
Of the people contacted to take part in our study, 14.1% responded favourably, a proportion close to that in other surveys of this type among the elderly [20]. The large dropout was certainly due to our recruitment method, as only letters were sent to participants, without phone or other face to face contacts to present the study. Our study have to be replicated in different settings and with a different method of participants’ approach. It is likely that in the group of non-respondents there was a higher percentage of people with poorer health. Additionally, we excluded from analysis participants who had not re-plied to the questionnaire unaided. Thus, our population sample, and hence the study findings, are limited be-cause the volunteer participants were particularly health-conscious or healthy. However, 69.1% of the participants considered their overall state of health to be good or ex-cellent, a result in line with the findings of the Drees
Table 8 LEIPAD‘Sexual Functioning’ scale: binary logistic regressions (Continued)
Bivariate logistic regression
Multivariate logistic regressiona Prevalence of‘poor’ HRQoL (%) OR (95% CI) p-value AOR (95% CI) p-value
Yes 61.5 1.20 (0.37–3.82) 0.7635
Perceived modest income
No 53.9 Ref
Yes 66.0 1.66 (0.83–3.31) 0.1506
Financial worries
No 58.4 Ref
Yes 50.0 0.71 (0.25–2.00) 0.5203
Binary logistic regressions: (1) LEIPAD‘Sexual Functioning’ categorized score (‘poor’ versus ‘good’ HRQoL) was used as the dependent variable. (2) Independent variables were entered as categorical variables, except for age and number of health problems which were entered as continuous variables. (3) OR odds ratio; CI confidence interval; AOR adjusted odds ratio
a
Multiple regression: adjusted for sex, age and for all variables included in the model
b
Mean (SD) in the‘poor’ HRQoL category Statistical significance is shown in bold type
Table 9 LEIPAD‘Life Satisfaction’ scale: ordinal logistic regressions (cumulative logit models) Bivariate ordinal
logistic regression
Multivariate ordinal logistic regressiona
Prevalence of‘poor’ HRQoL (%) OR (95% CI) p-value AOR (95% CI) p-value
Gender
Male 35.9 Ref Ref
Female 43.5 1.44 (0.82–2.55) 0.2085 1.32 (0.69–2.55) 0.4032
Age
(years) 84.1 (3.3)b 1.05 (0.96–1.14) 0.2971 1.02 (0.93–1.13) 0.6389
Marital status
Married or with a partner 35.7 Ref
Never-married, widowed, divorced 45.2 1.55 (0.86–2.80) 0.1489
Educational level
High school or higher education 47.1 Ref
Pre-high school 38.3 0.98 (0.61–1.57) 0.9269
Driving a car
Yes 34.0 Ref
No 49.1 1.68 (0.91–3.09) 0.0952
Hospital admission during the previous 12 months
No 41.9 Ref
Yes 34.3 0.78 (0.39–1.57) 0.4897
Number of health problems 5.0 (2.0)b 1.29 (1.11–1.51) 0.0013
Life events during the previous 12 months Illness No 41.6 Ref Yes 37.2 0.92 (0.48–1.75) 0.7878 Poor health No 34.5 Ref Yes 57.9 2.67 (1.31–5.46) 0.0072
Daily care of a relative or friend
No 34.9 Ref
Yes 63.0 3.20 (1.39–7.38) 0.0065
Bereavement
No 35.8 Ref
Yes 54.5 1.90 (0.91–3.94) 0.0873
Serious illness of a relative or friend
No 30.5 Ref Ref
Yes 60.4 3.25 (1.66–6.37) 0.0006 3.78 (1.83–7.84) 0.0003
Problems(s) with offspring
No 35.9 Ref
Yes 63.6 2.99 (1.21–7.42) 0.0179
Relational problem(s) with friends or relatives
No 38.6 Ref
Yes 62.5 2.64 (0.63–11.02) 0.1843
Unsatisfactory environment
survey on the state of health of the general population in France performed in 2012 and according to which 69% of EP aged 85 years or over rated their overall state of health as “good” [54], and with a Finnish self-rated health study performed in 2009 [55]. The number of participants considering their state of health to be bad was very slightly lower than that in the vqs survey of 2014, which however included EP living in sheltered housing [27]. Currently in France, EP with severe loss of autonomy are very often housed in institutions, espe-cially when they suffer from comorbid cognitive disor-ders [56]. The degree of autonomy of our participants was close to that described in French EP living at home [30].
We considered that the participants who were suffer-ing from mental and behavioural disorders accordsuffer-ing to the ICD-10 classification were in fact suffering from psy-chiatric and not cognitive disorders since their treatment consisted solely of psychotropic drugs. We did not assess the cognitive status of the participants before they re-plied to the questionnaire but we discarded the ques-tionnaires of those receiving treatment generally prescribed for cognitive disorders and those who did not complete the questionnaire unaided.
For some variables, there are few patients but our stat-istical tests took into account the small numbers in cat-egories/variables if necessary. Our multivariate models were controlled for convergence. However, results on these variables had to be confirmed in larger samples.
Conclusion
Longer life expectancy presents numerous challenges, notably preserving the highest levels of HRQoL as long as possible. In our study, EP living at home who were aged 80 years and over reported good HRQoL in most domains except that of ‘Sexual Functioning’. Their
HRQoL became worse when their health deteriorated. The female EP declared a significantly less satisfactory HRQoL. An unsatisfactory environment, not being able to drive, perceived modest income and financial worries negatively affected HRQoL. Identifying factors in our study that are potential determinants of HRQoL would be of direct benefit for individuals and could lead to concrete actions in public policy concerning health ser-vices (particularly home care, medical and psychosocial interventions, rehabilitation), means of transport (par-ticularly public transport and on-demand services), liv-ing environment (particularly home improvement, spaces and buildings accessible and useable by elderly people including with impairments) and financial re-sources. Such initiatives would help improve the HRQoL of EP living at home until very old age.
Supplementary information
Supplementary information accompanies this paper athttps://doi.org/10.
1186/s12955-020-01376-2.
Additional file 1: Table S1: Health problems self-reported by the partic-ipants according to the ICD-10 classification
Acknowledgements
The authors would like to thank the municipal staff of the communes helping with recruitment, all the elderly participants who agreed to take part in the study, R. Tourtauchaux for his liaison work with the municipalities and J. Watts for advice on the English version of the manuscript.
Authors’ contributions
CA and IJ took part in drawing up the project. FR sent out the letters of invitation to take part in the study. CA performed computerization of the data and statistical analyses. CA and IJ were the major contributors in the writing of the manuscript. FR, SL and CR contributed to the writing of the manuscript. All authors read and approved the final manuscript. Funding
The authors thank the teaching hospital (CHU) of Clermont-Ferrand for its fi-nancial support.
Table 9 LEIPAD‘Life Satisfaction’ scale: ordinal logistic regressions (cumulative logit models) (Continued)
Bivariate ordinal logistic regression
Multivariate ordinal logistic regressiona
Prevalence of‘poor’ HRQoL (%) OR (95% CI) p-value AOR (95% CI) p-value
Yes 81.8 7.31 (1.57–33.95) 0.0111 7.36 (1.51–35.74) 0.0134
Perceived modest income
No 31.1 Ref Ref
Yes 59.6 3.45 (1.75–6.81) 0.0004 2.46 (1.14–5.28) 0.0211
Financial worries
No 36.2 Ref Ref
Yes 73.3 5.44 (1.62–18.21) 0.0060 5.49 (1.23–24.37) 0.0253
Ordinal logistic regressions: (1) LEIPAD‘Life Satisfaction’ categorized score (‘poor’, ‘average’ or ‘good’ HRQoL) was used as the dependent variable. (2) Independent variables were entered as categorical variables, except for age and number of health problems which were entered as continuous variables. (3) OR odds ratio; CI confidence interval; AOR adjusted odds ratio
a
Multiple regression: adjusted for sex, age and for all variables included in the model
b
Mean (SD) in the‘poor’ HRQoL category Statistical significance is shown in bold type
![Fig. 1 Organisation chart of participation in the study [18]. Of the 1501 people invited to take part, 448 (32%) replied to the request (100 letters were not delivered) with 239 accepting (53.3%) and 209 declining (46.7%)](https://thumb-eu.123doks.com/thumbv2/123doknet/14645385.550112/4.892.88.804.130.769/organisation-participation-invited-replied-request-delivered-accepting-declining.webp)