HAL Id: hal-02141165
https://hal.archives-ouvertes.fr/hal-02141165
Submitted on 9 Nov 2020HAL is a multi-disciplinary open access archive for the deposit and dissemination of sci-entific research documents, whether they are pub-lished or not. The documents may come from teaching and research institutions in France or abroad, or from public or private research centers.
L’archive ouverte pluridisciplinaire HAL, est destinée au dépôt et à la diffusion de documents scientifiques de niveau recherche, publiés ou non, émanant des établissements d’enseignement et de recherche français ou étrangers, des laboratoires publics ou privés.
Selma Dahmane, Christine Doucet, Antoine Le Gall, Célia Chamontin,
Patrice Dosset, Florent Murcy, Laurent Fernandez, Desirée Salas, Eric
Rubinstein, Marylène Mougel, et al.
To cite this version:
Selma Dahmane, Christine Doucet, Antoine Le Gall, Célia Chamontin, Patrice Dosset, et al.. Nanoscale Organization of Tetraspanins during HIV-1 budding by correlative dSTORM/AFM. Nanoscale, Royal Society of Chemistry, 2019, 11 (13), pp.6036-6044. �10.1039/c8nr07269h�. �hal-02141165�
Nanoscale Organization of Tetraspanins during HIV-1 budding by correlative
dSTORM/AFM
Selma Dahmane1≠, Christine Doucet1≠, Antoine Le Gall1, Célia Chamontin2, Patrice Dosset1, Florent Murcy1, Laurent Fernandez1, Desirée Salas Pastene1, Eric Rubinstein3,4, Marylène Mougel2, Marcelo
Nollmann1, Pierre-Emmanuel Milhiet1* 1
Centre de Biochimie Structurale (CBS), INSERM, CNRS, Université de Montpellier
2IRIM, CNRS, University of Montpellier, Montpellier, France
3Inserm, U935, Villejuif, France
4 Université Paris Sud, Institut André Lwoff, Villejuif, France * to whom correspondence should be addressed: [email protected] # These two authors equally contributed to the work.
SUMMARY (150 words)
Membrane partition and remodeling play a key role in numerous cell mechanisms, especially in viral replication cycles where viruses subvert the plasma membrane to enter and escape from the host cell. Specifically assembly and release of HIV-1 particles require specific cellular components, which are recruited to the egress site by the viral protein Gag. We previously demonstrated that HIV-1
assembly alters both partitioning and dynamics of the tetraspanins CD9 and CD81, which are key players in many infectious processes, forming enriched areas where the virus buds. In this study we correlated super resolution microscopy mapping of tetraspanins with membrane topography
delineated by atomic force microscopy (AFM) in Gag-expressing cells. We revealed that CD9 is specifically trapped within the nascent viral particles, especially at buds tips, and that Gag mediate CD9 and CD81 depletion from the plasma membrane. In addition, we showed that CD9 is organized
as small membrane assemblies of few tens of nanometers that can coalesce upon Gag expression.
INTRODUCTION
A common feature of living organisms is the presence of a lipid barrier delimiting cells. Yet this lipid membrane allows communication between the cell interior and its environment. This is mediated either by protein complexes embedded in the lipid bilayer, able to transduce signals, or by exchange of material through membrane vesicles. This latter phenomenon involves a sequence of membrane remodeling events, which include membrane deformation and lateral reorganization of membrane
components. Indeed, the plasma membrane can be envisioned as a mosaic of micro and nano-domains of distinct lipid and protein compositions. These nano-domains are dynamic and their lateral organization leads to specific local properties of the plasma membrane. Remodeling of this
organization is involved in numerous processes such as cellular adhesion, endo- and exocytosis, cell fusion or migration.
Viral cycles involve membrane remodeling during virus entry and egress, two critical steps for
infection. In addition, these events are archetypes of coordinated reorganization of host membrane components and membrane deformation. Understanding their orchestration is thus of interest with respect to infectious mechanisms and membrane biology in general. In Human Immunodeficiency type 1 virus (HIV-1), viral egress is initiated by the structural protein Gag that is necessary and
sufficient to release virus-like particles (VLPs)1. Gag is expressed as a polyprotein that will be cleaved after particle release. Gag is targeted to the inner leaflet of the plasma membrane where it multimerizes, induces membrane curvature (budding sites) and finally membrane fission by
recruiting host factors such as the ESCRT machinery 2. Lipids of the host plasma membrane play a key role in this process 3. Among these, sphingolipids and cholesterol 4,5 are known to form or be enriched in different types of microdomains that could behave as pre-formed recruitment platforms 4. It was proposed that HIV-1 Gag proteins can sense cholesterol and acyl chain environment in membranes. HIV-1 also hijacks host proteins to achieve egress. This is the case of the ESCRT machinery, as already mentioned. But other proteins may be involved, amongst which proteins of
Tetraspanins belong to a family of proteins characterized by four transmembrane regions and a
specific fold in the larger of the 2 extracellular domains. All human cell types express several of these proteins which play an essential role in multiple cellular processes ranging from cell morphology, migration, cell-cell fusion and signaling 6. Tetraspanins are molecular organizers within the plasma membrane forming a dynamic network of protein-protein interactions at the cell surface by interacting with one another and with other transmembrane proteins (integrins, Immunoglobulin
superfamily proteins and others) 7–9. This interaction network is referred to as the tetraspanin web or Tetraspanin-enriched microdomains (TEM) 10. A fraction of tetraspanins and associated proteins concentrate into microscopically visible structures named tetraspanin-enriched areas (TEA) or
platforms 11,12. Interestingly, single molecule microscopies have revealed that tetraspanins are also organized in dynamic nano-clusters 12,12–14. How these two levels of organization participate in tetraspanin functions is not clear.
Several studies have shown colocalization of several tetraspanins (CD9, CD63, CD82 and CD81) with HIV-1 Gag and Env, in several cell types including T cells 15–17. TEMs were thus proposed to constitute gateways for HIV-1 assembly and budding. More recently, we have demonstrated using single molecule tracking experiments that both CD9 and CD81 are specifically recruited and sequestered
within Gag assembly sites. This supports that viral components do not cluster at pre-existing microdomains but rather promote the formation of distinct domains enriched in tetraspanins for the execution of specific functions, yet not fully elucidated 18. Tetraspanin knockdown or inhibition by specific antibodies also revealed that tetraspanin down-regulation decreases virus entry and replication in macrophages 19,20. In addition several studies pinpointed a potential role of tetraspanins in modulating HIV-1 infectivity through their incorporation into the released viral
particles. Overexpression of tetraspanins in virus-producing cells led to the production of virions with less infectivity 21,22. The presence of these proteins at exit sites also reduced the formation of syncitia in virus-producing cells and cell-to-cell fusion induced by the virus 21,23,24. Conversely, CD81 and CD82 levels are down-regulated by the HIV-1 accessory proteins Vpu and Nef, which induce
protein sequestration in intra-cellular compartments and degradation, leading to decreased levels at
the plasma membrane 25. These observations raise important questions concerning the role of CD9 and CD81 in the different steps of viral replication, from Gag recruitment at the plasma membrane to budding and release of viral particles. In particular, although CD9 and CD81, are involved in many membrane remodeling events 26, it is not clear whether they could play a role in membrane deformation and/or fission during HIV-1 egress. In addition, characterizing the effect of Gag on
tetraspanin organization may help understand the relative importance of the micro- and nanoscale organization of the tetraspanin web.
Here we developed and used correlative microscopy combining dSTORM (direct stochastic optical
reconstruction microscopy) with AFM (atomic force microscopy) 27, two advanced microscopy techniques allowing lateral resolution of a few tens of nanometers, well beyond light diffraction law. Membrane topography including budding sites was delineated by the AFM (for a recent review, see 28) whereas CD9 mapping was analyzed using direct Stochastic Optical Reconstruction Microscopy (dSTORM), a type of SMLM based on photoswitching of fluorophores29,30 . Our results show that i) Gag expression induces the concentration of CD9 and CD81 nanoclusters within Gag assembly sites. While the distribution of these clusters is dramatically altered, their intrinsic nanoscale structure
does not change much upon Gag expression; ii) CD9 concentrates within nascent viral particles. In most cases, it localizes at the very tip of viral buds and is excluded from the bases of the budding sites. This supports a role in membrane curvature induction or sensing rather than fission; iii) Gag mediates specific depletion of both CD9 and CD81 from cell surface, suggesting that CD9 and CD81 depletion is due to their accumulation in Gag-induced VLP budding sites. This happens even in the absence of the regulatory proteins Vpu and Nef and depends on VLPs release. Beyond the fields of
tetraspanin and infection, this study demonstrates that this type of correlative microscopy is an incredible asset to depict at the nanoscale tight coordination between protein distribution / recruitment and membrane remodeling.
RESULTS
Nanoscale organization of CD9 during Gag assembly
We had previously studied the dynamics of CD9 at the plasma membrane by Single Particle Tracking. Most CD9 harbors Brownian motion with proteins that sometimes can be transiently confined within tetraspanin-enriched areas 12. In striking contrast, CD9 gets permanently trapped within HIV-1 assembly sites in cells expressing Gag 18. This suggests that Gag interferes with CD9 interacting network. Yet how this affects CD9 nanoscale organization is not clear. To investigate this we performed dSTORM experiments to compare CD9 distribution in control and Gag-expressing HeLa cells. Cells were transfected with equimolar ratios of pGag and pGAG-GFP, inducing the biosynthesis
of VLPs mimicking HIV-1 infection 31 and stained with anti-CD9 antibodies labelled with Alexa647 24h or 48h after transfection. Importantly, imaging was performed in fixed cells since tetraspanins are very dynamic 7. The localization precision was below 30 nm (Fig. S1A)32. dSTORM images of non-transfected HeLa cells showed a sparse distribution of CD9 molecules on the basal membrane surface (Fig. 1A, left column). The mean density of CD9 localizations (i.e. detected events) in control cells was 1192 µm2 ± 127 (sem) (Fig. 1B and Table S1). Upon Gag expression (Fig. 1A, second and third columns and Fig. S1B), Gag-GFP foci assembled at the plasma membrane (white), consistent
with previous reports, and CD9 partitioned into Gag-enriched areas (Fig. 1A). The mean density of localizations in cells 24h and 48h after transfection with pGAG-GFP decreased to 793 ± 141 and 658 ± 151 per µm2, indicating a reduction in CD9 levels upon Gag expression. Interestingly, using a mask based on Gag-GFP signal, we noted a dramatic increase in the localization density within Gag-GFP-enriched areas at the cost of surrounding areas (8430 ± 1655 versus 428 ± 63 localizations/µm2 in areas devoid of Gag, 48h after transfection) (Fig. 1B and Table S1). As expected from Fig. 1A, CD9 localization density in Gag-GFP foci was correlated to Gag-GFP intensity (Fig. S1C, Fig. S1D, and Table S4 for Kendall's tau correlation coefficients).
To refine our analysis of CD9 lateral reorganization, single molecule localizations were analyzed using a segmentation procedure based on Voronoï diagrams. This method allows a precise and
automatic segmentation and quantification of protein organization (Fig. 1A). A framework named
"SR-Tesseler" 33 was used to estimate the size (in nm2) of CD9 clusters at the plasma membrane (for more details, see the Supplemental Materials section). In control cells, the mean area of CD9 clusters or assemblies was 3710 ± 1513 nm2 (Fig. 1C and Table S2) that corresponds to a disk of 68.7 nm diameter. A significant increase of this mean area was observed upon Gag expression, up to 5471 ± 2198 nm2 for cells analyzed 48h after transfection that corresponds to a disk of 83.5 nm diameter. This increase was even more pronounced when considering only Gag-enriched areas using the mask method described above: 6527 ± 2763 nm2 for cells 48h post-transfection versus 3710 ± 1513 nm2 for control cells, corresponding to a disk of 91.2 diameter (see Table S2 and the mirror histograms in
Fig. 1C). Gag expression thus induces an enlargement of CD9 nanodomains, supporting that Gag modulates CD9 interacting network. However the increase in CD9 cluster sizes remains moderate, even in areas of very high CD9 density such as Gag assembly sites. Interestingly, 70-90nm diameter fits with the size range of HIV-1 budding sites 34. This suggests that CD9 may be confined within the budding sites. To verify this, we wanted to precisely correlate CD9 localization with the topography of Gag-induced budding sites. Correlation between Gag assembly within VLP buds and CD9 dSTORM We first implemented correlative TIRF and AFM imaging. To ensure that apical cellular membranes imaged by AFM were in the TIRF evanescent field, we focused on thin regions present at the cell periphery (Fig. 2). Topographic images of the cell surface revealed membrane protrusions that
overlapped with Gag-GFP foci, suggesting they were VLPs. Some fluorescent areas did not coincide with membrane protrusion, likely because Gag assembly occurred on the basal membrane not accessible to the AFM tip (see the asterisk in Fig. 2). Virus-like buds were on average 104 ± 49 nm
high and 162 ± 75 nm wide, which is in accordance with measurements derived from super resolution microscopy (see the review 34 or electron microscopy studies 35. As expected the size distribution of virus-like buds was heterogeneous (Fig. S2A), reflecting the progression of the
content (Fig. 2E). In addition, AFM allowed further characterization of VLPs formation as shown in
Figure 2F where the AFM tip could delineate 2 budding sites that cannot be differentiated with conventional TIRF microscopy. This illustrates well the gain in resolution obtained by AFM.
We thus combined dSTORM and AFM on cells expressing Gag-GFP to get more details on CD9 organization in Gag-enriched domains (Fig. 3). CD9 clusters characterized by dSTORM overlapped well with the shape of Gag-GFP budding sites delineated by the AFM tip (Fig. 3A to 3D). In advanced
buds (spherical bud attached to the membrane by a neck), the neck area was devoid of CD9 (e.g. Fig. 3C). In nascent buds CD9 was localized at the very tip of membrane protrusions and mostly excluded from the basis of budding sites (Fig. 3F and see the gallery of budding sites in Fig. S3). This
demonstrates that CD9 is indeed trapped within the nascent bud. Moreover, CD9 seems to preferentially associate with membrane regions of high positive curvature. As described in Fig. 1, some CD9 clusters were also observed in membrane areas devoid of Gag-GFP proteins. Since
calculation of CD9 densities from 2D projected areas (as in fig.1) may have introduced a drawback, especially in buds, we calculated the number of CD9 localizations divided by the membrane area extracted from AFM images (see supplemental Materials). Taking into account the membrane topography, we confirmed that CD9 density is higher in Gag-GFP budding sites (3836 ± 934
localizations/µm2) compared to membrane regions where Gag proteins are absent (505 ± 111) (Fig. S2B). Gag reduces the cell surface expression of both tetraspanins CD9 and CD81 Interestingly, quantification of our dSTORM data suggests that CD9 level at the plasma membrane globally decreased when Gag is expressed. To confirm this, we analyzed cell surface expression of both CD9 and CD81 on HeLa cells expressing or not Gag-GFP using FACS. Cells were then fixed and
stained with labeled anti-CD9 or anti-CD81. 30-40% of cells were positively transfected and we defined 3 types of populations: untransfected cells (GFP-) and cells with intermediate (GFP+) or high (GFP++) levels of expression (Fig. 4A). While GFP-transfected cells had comparable CD9 levels in the 3 populations, CD9 surface levels were decreased by 70-80% in cells strongly expressing Gag-GFP, as
compared to GFP-negative cells from the same sample. Intra-sample ratios of CD9 and CD81 levels in
GFP++ or GFP+ versus GFP- cells were averaged from 4 independent experiments (Fig. 4B). The values confirmed that cells with high Gag expression are depleted of CD9 and CD81. In contrast, we found that the cell surface levels of CD46, a non-raft transmembrane protein with little association with tetraspanins, remains unaffected upon overexpression of Gag proteins (data not shown), indicating that Gag specifically affects CD9 and CD81 surface levels. These levels are known to be
down-regulated in an HIV-1 infection context due to their degradation and intracellular sequestration by the viral proteins Vpu and Nef 25. Since these proteins are not present in our system, we wondered if the depletion is due to the high excision rate of membrane buds enriched in CD9 and CD81. To test this, we used a Gag mutant protein (Gag∆NC), which assembles at the plasma membrane but is impaired in VLPs release 36. When expressed in HeLa cells, Gag∆NC did not reduce tetraspanin cell surface levels (Fig. 4C). This suggests that CD9 and CD81 downregulation at the cell surface is due to tetraspanin escape from the plasma membrane when VLPs are released. The lateral reorganization of tetraspanins by Gag thus has nanoscopic as well as macroscopic consequences. As of now, the impact of this depletion on the viral cycle and/or the host cell fate is not clear. However, we confirmed that depletion of CD9 and/or CD81 from HeLa cells by siRNA did not affect VLPs
release (Fig. S4A-B). But interestingly, we noted a compensation effect: CD9 is more concentrated in VLPs when CD81 is depleted, and the reverse is also true. This suggests that Gag induces an overall tetraspanin concentration in VLPs during viral egress. DISCUSSION Tetraspanins have been described as organizers of the plasma membrane of eukaryotic cells, playing
a key role in membrane remodeling especially in the infection context. In this study we used dSTORM/AFM correlative microscopy to investigate how HIV-1 Gag affects the lateral organization of the CD9 tetraspanin that becomes trapped within the viral particle.
We characterized CD9 localization in control cells using dSTORM and reported a clustered
organization. Other tetraspanins have been previously characterized by high-resolution techniques, namely STED 14 and dSTORM 13,37. Interestingly, their localizations were also clustered, yet with slightly larger sizes (100-150nm wide) than found here for CD9 (67 nm). However, even though CD9 transiently associates with the tetraspanins characterized in these studies (e.g. CD82, CD81, CD53), their distribution is not expected to be identical. In fact, the area of CD81 clusters measured in the
present work was slightly larger than that of CD9 (disk of 81 nm diameter, Fig. S5). This difference fits well with the slower diffusion of CD81 compared to CD9, as measured by single molecule tracking 38. In addition, it is probable that the tetraspanin clusters differ in composition and size from one cell to another. Taken together, cluster sizes measured in the publications cited above fall in the same range and support a model whereby tetraspanins diffuse in the plasma membrane, embedded in small assemblies that could contain other tetraspanins, some protein partners, and lipids 7,14. CD9 and CD81 being recruited at budding sites during HIV-1 egress suggested that functional platforms could originate from the gathering of these small assemblies. Indeed we confirm here that, upon expression of Gag-GFP in a model system recapitulating HIV-1-induced VLP production, CD9 and CD81 lateral organization is dramatically changed (respectively Fig. 1 and Fig. S5A) and the
two tetraspanins are highly concentrated in regions of Gag assembly, forming large tetraspanin-enriched areas. Surprisingly the average cluster size did not radically change upon Gag expression (Fig. 1C and Fig. S5B), suggesting that the large CD9 and CD81 assemblies observed in Gag-enriched
areas are composed of tetraspanin clusters that gather but do not fully coalesce (they can be resolved by dSTORM). This local concentration of tetraspanins is compensated by a decrease in their density in surrounding regions (as compared to control cells, Fig. S1E), indicating that CD9
enrichment in Gag+ areas is due to lateral reorganization of CD9 rather than protein recruitment from intracellular compartments. This model is in good agreement with our previous work showing that CD9, which diffuses in a Brownian motion in the plasma membrane, is trapped within Gag assembly sites 18. Gag is most likely the driving force that concentrates tetraspanin clusters, which
probably co-segregate with other membrane partners that could facilitate budding. As previously
suggested, lipid composition of these membrane assemblies could also play a key role in building large membrane platforms since Gag proteins are recruited by PIP2 lipids in a cholesterol-dependent manner 4,39.
Correlative dSTORM/AFM on cells expressing Gag-GFP showed that CD9 concentrates at the very tip of nascent VLPs with almost complete exclusion from buds necks at late stages. CD81 had previously
been observed mainly localized at the tips of elongated Influenza viruses using EM 40. In this particular case, CD81 was proposed to also play a role in fission due to its presence at both ends, including the side attached to the host cell. This is quite different from our observations with CD9,
which is thus most likely not involved in bud scission. But CD9 seems to have the propensity to partition within positively curved membranes. This is in good agreement with the presence of CD9 and CD81 in tubular structures such as membrane protrusions and filipodia (data not shown and 41). The correlation between CD9 density and membrane curvature could either reflect a role of CD9 in membrane remodeling and deformation, especially positive curvature, or its sensitivity to membrane curvature. At that time it is difficult to discriminate between these two models but the first hypothesis is more likely since we have also observed CD9 and CD81 in flat membranes. It is
then more tempting to speculate that these proteins are important in the formation of highly curved membranes encountered during virus budding, in the production of exosomes from multivesicular bodies 42, as well as in cell fusion process observed during the gamete fusion where association of CD9 with high membrane curvature regions has been reported previously in oocytes 43 or during myoblast fusion 44. Interestingly, protein confinement within membrane domains has been proposed to induce bending of the lipid bilayer, even in the absence of any specific protein functional domain 45,46. Importantly, the smaller the protein, the stronger the effect 45. These observations are particularly interesting regarding tetraspanins: indeed, they are small proteins (~20kDa) and they are transiently or permanently confined within molecular platforms at the plasma membrane (reviewed
in 38. In this regard, modulation of their confinement through interacting partners (in the case of this study, by Gag) could mediate their ability to curve membranes.
We then performed single or dual depletion of CD9 and CD81 in HeLa cells and measured VLP production (Fig. S4A-B). Similarly to what has already been described 21, CD9 and CD81 are not essential for VLPs release in HeLa cells. However, we observed that CD9 silencing led to an increase of CD81 expression within VLPs, and vice versa, suggesting that one tetraspanin could compensate
for the loss of another. Interestingly, this effect was not observed in cell extracts, emphasizing a specific role of tetraspanins in viral particles. The other side of the coin of this redundancy is the difficulty to clearly establish their functional role.
Markus Thali's group has demonstrated that, despite their enrichment at viral exit sites, the overall levels of tetraspanins are decreased in HIV-1-infected cells. More specifically CD81 down-regulation in HIV-1 infected cells was explained by its degradation in proteasomal and lysosomal pathways.
These processes were shown to depend upon HIV proteins Vpu and Nef 25 . Here, we report that Gag-GFP expression could also trigger CD9 and CD81 depletion in the absence of Vpu and Nef. In addition, tetraspanin levels remain normal upon expression of a Gag mutant impaired in VLP release 36, suggesting that CD9 and CD81 depletion is directly linked to VLP release from host cells. Even if the fraction of cellular plasma membrane escaping through this process remains low (as assessed by unaffected levels of CD46), CD9 and CD81 global protein levels are impacted most probably because of their high concentration within Gag assembly sites. Interestingly, tetraspanin levels influence HIV-1 life cycle at different stages and in opposite manners. Indeed, CD81 potentiates HIV-1 transcription 22,45 through its association to SAMHD1 46, while overexpression of tetraspanins at the surface of virions, including CD9 and CD81, decrease their infectivity 21,22. Tetraspanins thus appear as key elements in the modulation of HIV-1 virulence.
Taken together our results shed new light on the involvement of CD9 and CD81 during HIV-1 egress using a new type of correlative microscopy that is suitable to investigate virus-host interactions, providing topographic details and molecular mapping at the nanoscale in native conditions. The
acute description of tetraspanin distribution at a nanoscopic and microscopic scale in the 3D
topography landscape probed by AFM allow us to make new hypotheses regarding tetraspanins functions in membrane bending. More generally such correlative microscopy appears as an outstanding technique to analyze membrane remodeling and protein partitioning in critical biological processes. Conflicts of interest There are no conflicts to declare. Author contributions
Conceptualization, M.N. & P.E.M.; Methodology, S.D., A.L.G., C.D. & P.D.; Validation, S.D., C.D., M.M., M.N. & P.E.M.; Formal analysis; S.D., C.D., A.L.G. & P.E.M.; Investigation, S.D., C.D., C.C., F.M., L.F. & D.S.P., Resources, M.M., E.R. and P.E.M.; Writing - Original Draft, S.D., C.D. & P.E.M.; Writing - Review & Editing, C.D. E.R., M.N. & P.E.M.; Visualization, C.D. & P.E.M.; Supervision, M.M., M.N. & P.E.M.; Funding acquisition, M.N. & P.E.M. Acknowledgments
We acknowledge the support from France-BioImaging (FBI, ANR-10-INSB-04), the French Infrastructure for Integrated Structural Biology (FRISBI, ANR-10-INBS-05), the European Research Council Starting (ERC-Stg-260787), the Agence Nationale pour la Recherche (ANR-15-CE11-0023) and
the GIS IBISA (Infrastructures en Biologie Santé et Agronomie). LF and DSP were recipients of the French Ministry of Education and Research. LF was a FRM fellow and SD salary was paid with a Sanofi-Pasteur contract. We are grateful to Zhanna Santybayeva for creating the cartoon in Figure 5,
REFERENCES
1 L.-A. Carlson, J. A. G. Briggs, B. Glass, J. D. Riches, M. N. Simon, M. C. Johnson, B. Müller, K.
Grünewald and H.-G. Kräusslich, Cell Host Microbe, 2008, 4, 592–599. 2 J. R. Lingappa, J. C. Reed, M. Tanaka, K. Chutiraka and B. A. Robinson, Virus Res., 2014, 193, 89– 107. 3 J. Fantini, D. Hammache, G. Piéroni and N. Yahi, Glycoconj. J., 2000, 17, 199–204. 4 A. Ono, Vaccine, 2010, 28 Suppl 2, B55-59. 5 A. A. Waheed and E. O. Freed, Virus Res, 2009, 143, 162–76. 6 S. Charrin, S. Jouannet, C. Boucheix and E. Rubinstein, J. Cell Sci., 2014, 127, 3641–3648.7 S. Charrin, F. cois Le Naour, O. Silvie, P. E. Milhiet, C. Boucheix and E. Rubinstein, Biochem. J.,
2009, 420, 133–154.
8 M. E. Hemler, Nat. Rev. Mol. Cell Biol., 2005, 6, 801–811.
9 S. Levy and T. Shoham, Physiol. Bethesda Md, 2005, 20, 218–224.
10 F. Berditchevski, J. Cell Sci., 2001, 114, 4143–4151.
11 O. Barreiro, M. Zamai, M. Yanez-Mo, E. Tejera, P. Lopez-Romero, P. N. Monk, E. Gratton, V. R. Caiolfa and F. Sanchez-Madrid, J. Cell Biol., 2008, 183, 527–542.
12 C. Espenel, E. Margeat, P. Dosset, C. Arduise, C. Le Grimellec, C. A. Royer, C. Boucheix, E. Rubinstein and P.-E. Milhiet, J. Cell Biol., 2008, 182, 765–776. 13 C. M. Termini, M. L. Cotter, K. D. Marjon, T. Buranda, K. A. Lidke and J. M. Gillette, Mol. Biol. Cell, 2014, 25, 1560–1573. 14 M. Zuidscherwoude, F. Göttfert, V. M. E. Dunlock, C. G. Figdor, G. van den Bogaart and A. B. van Spriel, Sci. Rep., 2015, 5, 12201. 15 B. Grigorov, V. Attuil-Audenis, F. Perugi, M. Nedelec, S. Watson, C. Pique, J.-L. Darlix, H. Conjeaud and D. Muriaux, Retrovirology, 2009, 6, 28. 16 C. Jolly and Q. J. Sattentau, J. Virol., 2007, 81, 7873–7884. 17 S. Nydegger, J. Cell Biol., 2006, 173, 795–807.
18 D. N. Krementsov, P. Rassam, E. Margeat, N. H. Roy, J. Schneider-Schaulies, P.-E. Milhiet and M. Thali, Traffic, 2010, 11, 1401–1414. 19 J. J. von Lindern, D. Rojo, K. Grovit-Ferbas, C. Yeramian, C. Deng, G. Herbein, M. R. Ferguson, T. C. Pappas, J. M. Decker, A. Singh, R. G. Collman and W. A. O’Brien, J. Virol., 2003, 77, 3624–3633. 20 E. Tippett, P. U. Cameron, M. Marsh and S. M. Crowe, J. Leukoc. Biol., 2013, 93, 913–920. 21 D. N. Krementsov, J. Weng, M. Lambele, N. H. Roy and M. Thali, Retrovirology, 2009, 6, 64. 22 K. Sato, J. Aoki, N. Misawa, E. Daikoku, K. Sano, Y. Tanaka and Y. Koyanagi, J Virol, 2008, 82, 1021– 33. 23 M. Gordón-Alonso, M. Yañez-Mó, O. Barreiro, S. Alvarez, M. A. Muñoz-Fernández, A. Valenzuela-Fernández and F. Sánchez-Madrid, J. Immunol. Baltim. Md 1950, 2006, 177, 5129–5137. 24 J. Weng, D. N. Krementsov, S. Khurana, N. H. Roy and M. Thali, J. Virol., 2009, 83, 7467–7474. 25 M. Lambelé, H. Koppensteiner, M. Symeonides, N. H. Roy, J. Chan, M. Schindler and M. Thali, J. Virol., 2015, 89, 3247–3255. 26 M. Fanaei, P. N. Monk and L. J. Partridge, Biochem. Soc. Trans., 2011, 39, 524–528.
27 P. D. Odermatt, A. Shivanandan, H. Deschout, R. Jankele, A. P. Nievergelt, L. Feletti, M. W. Davidson, A. Radenovic and G. E. Fantner, Nano Lett., 2015, 15, 4896–4904. 28 Y. F. Dufrêne, T. Ando, R. Garcia, D. Alsteens, D. Martinez-Martin, A. Engel, C. Gerber and D. J. Müller, Nat. Nanotechnol., 2017, 12, 295–307. 29 M. J. Rust, M. Bates and X. Zhuang, Nat Methods, 2006, 3, 793–5. 30 M. Heilemann, S. Van De Linde, M. Schüttpelz, R. Kasper, B. Seefeldt, A. Mukherjee, P. Tinnefeld and M. Sauer, Angew. Chem. Int. Ed., 2008, 47, 6172–6176. 31 S. Nydegger, M. Foti, A. Derdowski, P. Spearman and M. Thali, Traffic, 2003, 4, 902–910.
32 D. I. Cattoni, A. M. Cardozo Gizzi, M. Georgieva, M. Di Stefano, A. Valeri, D. Chamousset, C. Houbron, S. Déjardin, J.-B. Fiche, I. González, J.-M. Chang, T. Sexton, M. A. Marti-Renom, F. Bantignies, G. Cavalli and M. Nollmann, Nat. Commun., 2017, 8, 1753.
33 F. Levet, E. Hosy, A. Kechkar, C. Butler, A. Beghin, D. Choquet and J.-B. Sibarita, Nat. Methods, 2015, 12, 1065–1071. 34 B. Müller and M. Heilemann, Trends Microbiol., 2013, 21, 522–533. 35 J. a. G. Briggs, J. D. Riches, B. Glass, V. Bartonova, G. Zanetti and H.-G. Kräusslich, Proc. Natl. Acad. Sci. U. S. A., 2009, 106, 11090–11095. 36 C. Chamontin, P. Rassam, M. Ferrer, P.-J. Racine, A. Neyret, S. Lainé, P.-E. Milhiet and M. Mougel, Nucleic Acids Res., 2015, 43, 336–347. 37 K. D. Marjon, C. M. Termini, K. L. Karlen, C. Saito-Reis, C. E. Soria, K. A. Lidke and J. M. Gillette, Oncogene, 2016, 35, 4132–4140. 38 S. Dahmane, E. Rubinstein and P.-E. Milhiet, Viruses, 2014, 6, 1992–2011. 39 A. Kerviel, A. Thomas, L. Chaloin, C. Favard and D. Muriaux, Virus Res., 2013, 171, 332–340. 40 J. He, E. Sun, M. V. Bujny, D. Kim, M. W. Davidson and X. Zhuang, PLoS Pathog., 2013, 9,
e1003701.
41 X. A. Zhang and C. Huang, Cell. Mol. Life Sci. CMLS, 2012, 69, 2843–2852. 42 Z. Andreu and M. Yáñez-Mó, Front. Immunol., 2014, 5, 442.
43 K. E. Runge, J. E. Evans, Z.-Y. He, S. Gupta, K. L. McDonald, H. Stahlberg, P. Primakoff and D. G.
Myles, Dev. Biol., 2007, 304, 317–325.
44 S. Charrin, M. Latil, S. Soave, A. Polesskaya, F. Chrétien, C. Boucheix and E. Rubinstein, Nat.
Commun., 2013, 4, 1674. 45 J. C. Stachowiak, C. C. Hayden and D. Y. Sasaki, Proc. Natl. Acad. Sci. U. S. A., 2010, 107, 7781– 7786. 46 J. C. Stachowiak, E. M. Schmid, C. J. Ryan, H. S. Ann, D. Y. Sasaki, M. B. Sherman, P. L. Geissler, D. A. Fletcher and C. C. Hayden, Nat. Cell Biol., 2012, 14, 944–949. 47 M. R. Tardif and M. J. Tremblay, J. Virol., 2005, 79, 4316–4328.
48 V. Rocha-Perugini, H. Suárez, S. Álvarez, S. López-Martín, G. M. Lenzi, F. Vences-Catalán, S. Levy,
B. Kim, M. A. Muñoz-Fernández, F. Sánchez-Madrid and M. Yáñez-Mó, Nat. Microbiol., 2017, 2, 1513–1522.
FIGURE LEGENDS
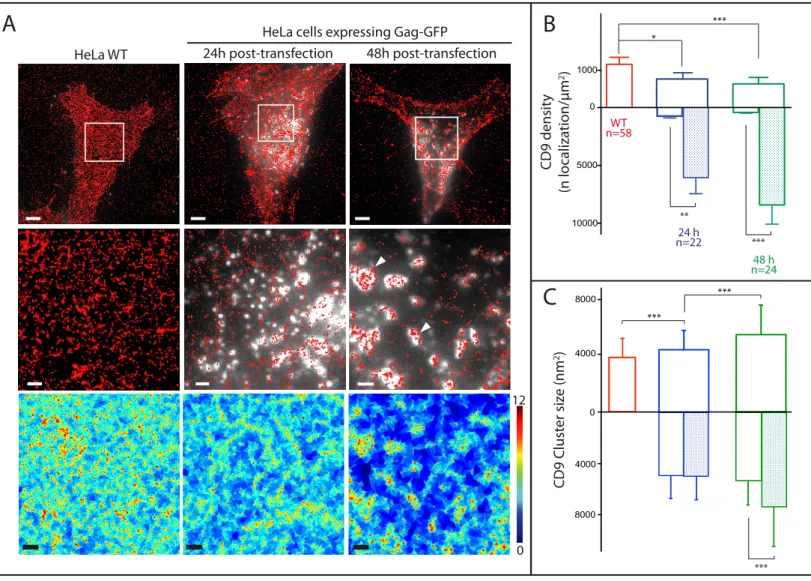
Figure 1 - Gag proteins recruit and reorganize the tetraspanin CD9 at the plasma membrane. (A) Raw CD9 dSTORM localizations (red dots, 2 first rows) and local density map obtained from the SR-Tesseler framework (third row; the colour scale represents local densities in logarithmic scale) in HeLa cells expressing HIV-1 Gag-GFP (white signal in micrographs). From left to right: control cells;
cells expressing Gag-GFP for 24h or 48h; the middle row show zoomed areas outlined in the upper images. Scale bars are 5 µm (upper row) and 1 µm (bottom rows); (B) dSTORM analysis. CD9 density (number of localization/µm2) in control cells (red) or in cells expressing Gag-GFP proteins 24h (blue) or 48h (green) after transfection. In the mirror histograms below the X axis, empty and hatched histograms represent the density outside and within Gag-GFP positive areas, respectively. Error bars are SEM and n is the number of analyzed cells. *, ** and *** indicate p values below 0.05, 0.001 and 0.0001 respectively, as determined by the Mann–Whitney U-test (for exact p values, see Table S1); (C) Histograms of size distribution of CD9 clusters in nm2 for the 3 conditions. The legend is similar to B.
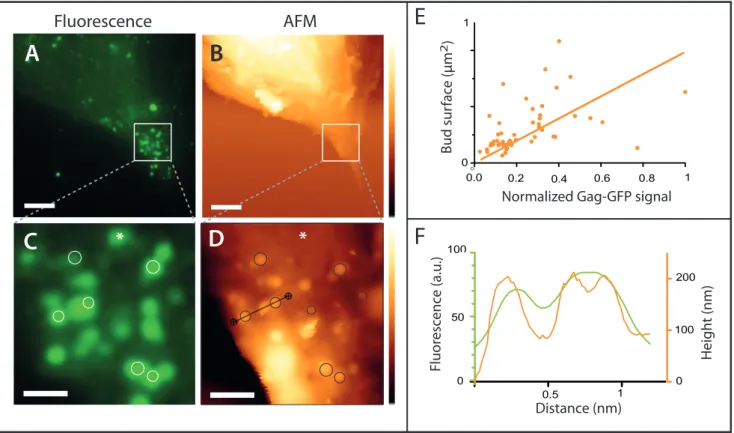
Figure 2 - Nanoscale imaging of HeLa cells expressing Gag-GFP using correlated fluorescence-atomic force microscopy. Gag-GFP fluorescence image (A and C) and AFM topographic images (B and D) were compared (48h post-transfection here). The circles highlight some correlation between fluorescence and the membrane protrusion delineated by the AFM tip. The asterisk points out a Gag assembly where no membrane protrusion was observed by AFM. (E) Normalized Gag-GFP signal as a function of the bud surface measured by AFM. (F) Profile plot of the topography (orange line) and fluorescence signal (green line) along the section indicated by the black line on the AFM image. Scale bars are 5 (A and B) or 1 µm (C and D). The AFM z colour scales are 6.6 µm (upper AFM image) and 800 nm (lower image).
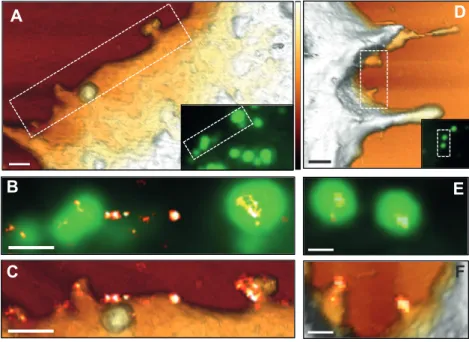
Figure 3 - CD9 recruitment at HIV-1 budding sites. HeLa cells expressing HIV-1 Gag-GFP were
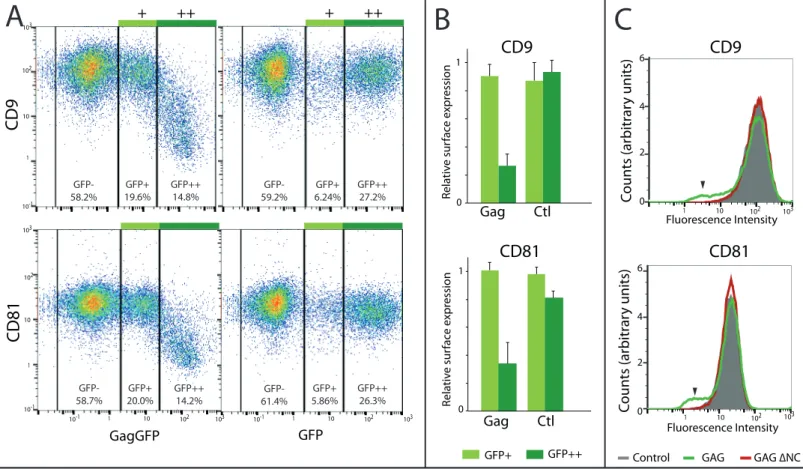
immuno-stained with anti-CD9 coupled to Alexa-647 and imaged by AFM (first row), conventional fluorescence (second row) and dSTORM (third row) TIRF illumination: A and D) AFM 3D images of two different cells (the dotted line delineates the zoomed areas shown below and the insets are the corresponding Gag-GFP signal fluorescence images); B and E) overlays of the Gag-GFP picture with the reconstructed dSTORM image of the tetraspanin CD9. Scale bars are 500 nm (A and D) or 200 nm (B, C, E and F). The colour z scale shown in A and D is 300 nm. Figure 4 - Gag reduces tetraspanin levels at the cell surface of HeLa cells. A, B and C) Surface expression of CD9 and CD81 measured by flow cytometry 48h after transfection with Gag-GFP or GFP (Control). A) Representative flow cytometry 2D dot plots of gated living cells; three cell populations were defined based on their GFP intensity (GFP-, GFP+ and GFP++).
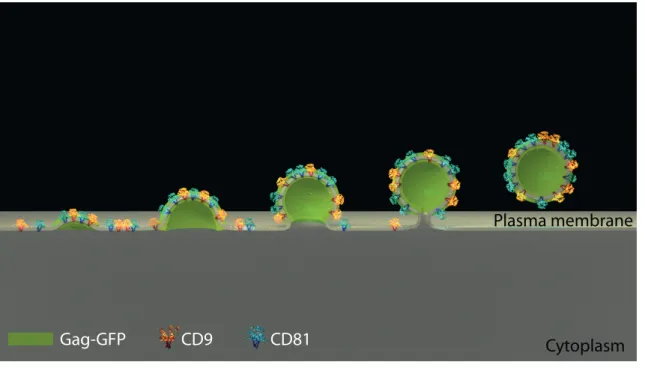
Percentages indicate the representative fraction of each population; B) Mean CD9 and CD81 levels were quantified for each population and normalized to GFP- levels. Data were averaged from 3 independent experiments. Error bars are standard deviations. C) Surface levels of CD9 and CD81 in HeLa cells transfected with GFP alone (grey), with Gag-GFP (green line) or with the Gag ∆NC mutant (red line). Black arrowheads indicate HeLa cells with CD9 or CD81 depletion. Figure 5 – Model of tetraspanin lateral organization in the HIV-1 context. This scheme represents how the tetraspanins CD9 and CD81 (in blue and yellow) are laterally segregated within Gag-induced budding sites (in green). This leads to decreased CD9 and CD81 levels in the surrounding plasma membrane (in light grey), resulting in a net protein loss when Virus-Like Particles are excised.
HeLa WT 24h post-transfection 48h post-transfection HeLa cells expressing Gag-GFP
A
CD9 densit y (n localiza tion/µm 2) 0 5000 10000B
*** ** *** * 1000C
0 12 CD9 Clust er siz e (nm 2) 8000 4000 0 4000 8000 *** *** *** WT n=58 24 h n=22 48 h n=24Figure 1 - Gag proteins recruit and reorganize the tetraspanin CD9 at the plasma membrane.
(A) Raw CD9 dSTORM localizations (red dots, 2 first rows) and local density map obtained from the SR-Tesseler framework (third row; the colour scale represents local densities in logarithmic scale) in HeLa cells expressing HIV-1 Gag-GFP (white signal in micrographs). From left to right: control cells; cells expressing Gag-GFP for 24h or 48h; the middle row show zoomed areas outlined in the upper images. Scale bars are 5 µm (upper row) and 1 µm (bottom rows); (B) dSTORM analysis. CD9 density (number of localization/µm2) in control cells (red) or in cells expressing Gag-GFP proteins 24h (blue) or 48h (green) after transfection. In the mirror histograms below the X axis, empty and hatched histograms represent the density outside and within Gag-GFP positive areas, respectively. Error bars are SEM and n is the number of analyzed cells. *, ** and *** indicate p values below 0.05, 0.001 and 0.0001 respectively, as determined by the Mann–Whitney U-test (for exact p values, see Table S1); (C) Histograms of size distribution of CD9 clusters in nm2 for the 3 conditions. The legend is similar to B.
0.0 0.2 0.4 0.6
Normalized Gag-GFP signal
Bud sur fac e (µm 2)
*
0.8 1 0 1 0 50 100 100 200 0 0.5 1 Heigh t (nm) Distance (nm) Fluor esc enc e (a.u .)B
A
A
C
B
D
E
F
*
Fluorescence
AFM
Figure 2 - Nanoscale imaging of HeLa cells expressing Gag-GFP using correlated fluorescence-atomic force microscopy.
Gag-GFP fluorescence image (A and C) and AFM topographic images (B and D) were compared (48h post-transfection here). The circles highlight some correlation between fluorescence and the membrane protrusion delineated by the AFM tip. The asterisk points out a Gag assembly where no membrane protrusion was observed by AFM. (E) Normalized Gag-GFP signal as a function of the bud surface measured by AFM. (F) Profile plot of the topography (orange line) and fluorescence signal (green line) along the section indicated by the black line on the AFM image. Scale bars are 5 (A and B) or 1 µm (C and D). The AFM z colour scales are 6.6 µm (upper AFM image) and 800 nm (lower image).
A B C D E F
Figure 3 - CD9 recruitment at HIV-1 budding sites.
HeLa cells expressing HIV-1 Gag-GFP were immuno-stained with anti-CD9 coupled to Alexa-647 and imaged by AFM (first row), conventional fluorescence (second row) and dSTORM (third row) TIRF illumination: A and D) AFM 3D images of two different cells (the dotted line delineates the zoomed areas shown below and the insets are the corresponding Gag-GFP signal fluorescence images); B and E) overlays of the Gag-GFP picture with the reconstructed dSTORM image of the tetraspanin CD9. Scale bars are 500 nm (A and D) or 200 nm (B, C, E and F). The colour z scale shown in A and D is 300 nm.
CD9
Gag Ctl Rela tiv e sur fac e e xpr essionCD9
CD81
CD81 CD9 GagGFP GFP 0 1 Coun ts (ar bitr ar y units) GFP+ GFP++ 102 10 1 103 102 10 1 103 2 4 6 102 10 1 103 10-1 102 10 1 103 10-1 103 103 102 102 10 10 1 1 10-1 10-1 ++ + ++ + 0 GFP-58.2% GFP-58.7% GFP-59.2% GFP-61.4% GFP+ 19.6% GFP+ 20.0% GFP+ 6.24% GFP+ 5.86% GFP++ 14.8% GFP++ 14.2% GFP++26.3% GFP++ 27.2%Control GAG GAG ∆NC
CD81
Rela tiv e sur fac e e xpr ession Gag Ctl 1 0 Coun 0 ts (ar bitr ar y units) 2 4 6 Fluorescence Intensity Fluorescence IntensityA
B
C
Figure 4 - Gag reduces tetraspanin levels at the cell surface of HeLa cells.
A, B and C) Surface expression of CD9 and CD81 measured by flow cytometry 48h after transfection with Gag-GFP or GFP (Control). A) Representative flow cytometry 2D dot plots of gated living cells; three cell populations were defined based on their GFP intensity (GFP-, GFP+ and GFP++). Percentages indicate the representative fraction of each population; B) Mean CD9 and CD81 levels were quantified for each population and normalized to GFP- levels. Data were averaged from 3 independent experiments. Error bars are standard deviations. C) Surface levels of CD9 and CD81 in HeLa cells transfected with GFP alone (grey), with Gag-GFP (green line) or with the Gag ∆NC mutant (red line). Black arrowheads indicate HeLa cells with CD9 or CD81 depletion.
Gag-GFP
CD9
CD81
Cytoplasm
Plasma membrane
Figure 5 – Model of tetraspanin lateral organization in the HIV-1 context.
This scheme represents how the tetraspanins CD9 and CD81 (in blue and yellow) are laterally segregated within Gag-induced budding sites (in green). This leads to decreased CD9 and CD81 levels in the surrounding plasma membrane (in light grey), resulting in a net protein loss when Virus-Like Particles are excised.
Supplemental Materials
Nanoscale Organization of Tetraspanins during HIV-1 budding by correlative
dSTORM/AFM
Selma Dahmane1*, Christine Doucet1*, Antoine Le Gall1, Célia Chamontin2, Patrice Dosset1, Florent Murcy1, Laurent Fernandez1, Desirée Salas Pastene1, Eric Rubinstein3,4, Marylène Mougel2, Marcelo
Nollmann1, Pierre-Emmanuel Milhiet1#
1
Centre de Biochimie Structurale (CBS), INSERM, CNRS, Université de Montpellier
2IRIM, CNRS, University of Montpellier, Montpellier, France
3Inserm, U935, Villejuif, France
4 Université Paris Sud, Institut André Lwoff, Villejuif, France # to whom correspondence should be addressed * These two authors equally contributed to the work.MATERIALS AND METHODS Plasmids and antibodies The codon-optimized untagged Gag, Gag-GFP, Gag ∆NC, pNL4-3∆env, and pMA-YFP∆env constructs
have been previously described 1,2. Full length mAbs raised against CD81 (TS81), CD9 (SYB-1) and CD46 (11C5), were labeled with Alexa647 as previously described 3. AlexaFluor 594-conjugated goat
were transfected 14 h before imaging using X-tremeGENE 9 DNA transfection reagent (Roche), according to the manufacturer’s protocol, with two HIV-1 pNL4-3∆env plasmids encoding untagged and YFP tagged Gag at molar ratio 1:1. This mixture is required to get VLP mimicking HIV-1. Cell culture and sample preparation HeLa cells were grown in DMEM (Gibco) supplemented with 10% FCS (Gibco). For imaging, cells were seeded.on 25 mm round glass coverslips placed in 6-well plates (2.105 cells/well) (Marienfeld). Prior to use, coverslips were rinsed with acetone, ethanol, and water, then sonicated in 1M KOH for 20-30 minutes in a water bath. Coverslips were then extensively rinsed in MilliQ water, air-dried and plasma-cleaned for 20 minutes. They were then coated with collagen. Before transfection, cells were placed in fresh medium. Cells were transfected using 2µg DNA per well with an equimolar ratio of Gag-GFP and Gag. Cells were placed in fresh medium 4-6 hours after transfection and analysed 24- 48h post-transfection. For immunostaining, cells were incubated for 15min at 37°C with Alexa647-conjugated primary antibody (1.5μg/mL), washed and fixed with 4% paraformaldehyde in PBS for 20 min at room temperature (fixation increases the membrane spring constant and thus facilitate AFM imaging). After fixation, cells were washed with PBS and incubated for 10min with 1/1000 dilution of 100 nm fluorescent beads emitting at four wavelengths (TetraSpeck Microspheres, Invitrogen) used
as fiducial marks. For dSTORM imaging, an oxygen-scavenging PBS-based buffer included 10% glucose, 0.04 mg/mL glucose oxidase, and 0.5 mg/mL catalase, supplemented with mercaptoethylamine (MEA) (all from Sigma).
Image acquisition on AFM-SMLM Correlative Microscope
The setup was built as a combination of a Nanowizard 3 microscope (JPK, Berlin) together with a homemade objective-type TIRF inverted optical microscope (Zeiss, Le Pecq, France) equipped for
single molecule localization microscopy with an oil-immersion objective (Plan-Apochromat 100x, 1.4 DIC, Zeiss). A 1.5x telescope was used to obtain a final imaging magnification of 150-fold corresponding to a pixel size of 107 nm. Four lasers were used for excitation/photo-activation: 405 nm (OBIS, LX 405-50, Coherent Inc.), 488 nm (OBIS, LX 488-50, Coherent Inc.), 561 nm (OBIS, LX
561-50, Coherent Inc.), and 640 nm (OBIS, LX 640-100, Coherent Inc.). Laser lines were expanded,
and coupled into a single beam using dichroic mirrors (427, 552 and 613 nm laser MUXTM, Semrock). An acousto-optic tunable filter (AOTFnc-400.650-TN, AA opto-electronics) was used to modulate laser intensity. Light was circularly polarized using an achromatic quarter wave plate (QWP). Two achromatic lenses were used to expand the excitation laser and an additional dichroic mirror (zt405/488/561/638rpc, Chroma) to direct it towards the back focal plane of the objective.
Fluorescence light was spectrally filtered with emission filters (ET525/50m, ET600/50m and ET700/75m, Chroma Technology) and imaged on an EMCCD camera (iXon Ultra897, Andor Technologies). The microscope was equipped with a piezo Tip Assisted Optics (TAO) module (JPK,
Berlin) allowing 100x100x10 µm sample displacement in x, y and z direction, respectively.
To ensure the stability of the focus during acquisition, home-made autofocus system was built. 4% of the red laser was deviated from the optical path using a glass plate and directed at the sample/glass
coverslip interface. This beam was then reflected towards the objective lens and redirected following the same path as the incident beam and guided to a home-made QPD allowing its transverse displacements to be detected and corrected by the TAO stage. Camera, lasers and filter wheel were controlled with a software written in LABVIEW (National Instruments).
For dSTORM acquisitions, two lasers were used to illuminate the cells. 1kW/cm2 of 641 nm laser illumination was used for imaging and 0-0.1 kW/cm2 of 405 nm for conversion from the dark state. The 641nm laser continuously illuminated the sample during data acquisition, while the activation laser was pulsed for 50ms. The intensity of activation was progressively increased throughout the acquisition to ensure a constant amount of simultaneously activated fluorophores within the labeled structures. For image acquisition, on average 25,000 frames were recorded at a rate of 50 ms/frame. Cells were further imaged with AFM after replacement of the dSTORM oxygen-scavenging buffer by PBS. AFM imaging was performed with a Nanowizard 3 (JPK Berlin, Germany) using the Quantitative Imaging mode with MLCT cantilevers (Nano-Bruker, Palaiseau, France). To achieve the best
DirectOverlayTM which is using the accuracy of the AFM closed loop scanning system enabling the overlay of both microscopies at high resolution precision, typically 10 to 30nm.
dSTORM data processing and analysis
Post-acquisition image analysis was performed using the Multiple Target Tracking (MTT) algorithm described elsewhere 4 generating tables containing the x-y particle coordinates of each molecule detected during the acquisition. Lateral drift correction was performed as described previously by
following the trajectory of the fiducial marks and employing custom software PALMcbs written in MATLAB (MathWorks)5. The experimental drift correction precision was typically 3-10 nm.
Clusterization analysis was done by a tessellation approach using a modified version of the Voronoi
tesselation algorithm developed by Levet et al. 6. Single-molecule localizations are first converted into a Voronoi diagram. Briefly 10um x 10um regions of interest (ROI) were selected manually and Voronoi diagrams were retrieved using the ‘voronoi’ function. Local densities were calculated as the
inverse value of the corresponding voronoi cells area. For each ROI, a density histogram of experimental localizations was generated and compared to the density histogram of an equivalent number of randomly distributed localizations. The histograms intersection defined a threshold D. Localizations were considered to be clustered when exhibiting a local density d > 1.6D.
A binary map of clustered localizations was generated and localization clusters were then segmented. A mask was created, based on GFP fluorescence, to define areas corresponding to Gag assembly sites. Using this mask, clusters were sorted depending on their co-localization with Gag.
Clusters areas were then calculated for clusters within or outside Gag assembly sites. All analyses were carried out in Matlab. Graphical representations and statistical analyses were performed using Prism.
FACS
48h post-transfection, cells were trypsinized and rinsed twice in cold PBS. Cells were then incubated with appropriate antibodies diluted in PBS +3% serum at 1.5 µg/mL for 30 minutes on ice. Cells were rinsed in PBS + 3% serum and incubated with Alexa647 anti-Mouse (Molecular Probes) for 30
minutes on ice. Cells were then rinsed in cold PBS, fixed in 4%PFA for 10 minutes at room
temperature, and rinsed twice in cold PBS. FACS analysis was carried out on a MACSQuant analyzer (Miltenyi). All data were acquired using the same detector settings and gating parameters. Data were analyzed with FlowJo and the ratio of tetraspanin levels in transfected (GFP+ or GFP++) / untransfected (GFP-) cells were calculated. Data were averaged from 4 independent experiments. Quantitation of VLP production in HeLa cells depleted or not of CD9 and CD81
HeLa cells were seeded in 6 well plates and co-transfected with 1µg of pNL4-3∆Env, 1µg pMaYFP-∆Env, 100pmol siRNA (either, scrambled or against CD9 and/or CD81). 48h after transfection, culture supernatants were collected and submitted to ultracentrifugation at 30,000g for 90 minutes on a
sucrose cushion. Pellets were resuspended in 40µl of DMEM without serum and stored at -80°C until SDS-PAGE analysis. Cells were scraped on ice and pelleted. Each pellet was resuspended in 100ul of TNE-Triton (10mM Tris pH7.5, 150mM NaCl, 5mM EDTA, 1% Triton), complemented with protease inhibitor cocktail (EDTA-free Complete, Roche) and incubated on ice for 10 minutes, vortexing 2-3 times. Lysates were spun for 10 minutes at 11,000g; supernatants were collected and stored at -80°C until SDS-PAGE analysis. CD9, CD81 and p24 contents in both cell extract and supernatant were analyzed by western blotting
using anti-tetraspanin antibodies described above and anti-p24 antibodies (Serotec), revealed by peroxidase-conjugated goat anti-mouse antibodies from Jackson ImmunoResearch. Quantitation of western-blotting signals was performed with FIJI.
Silencing RNA oligonucleotides were from Ambion: Oligo sc (UAGAUACCAUGCACAAAUCC dTdT), siCD9 (GCAGAAATCCTGCAATGAAdTdT) and siCD81 (CACGUCGCCUUCAACU GUAdTdT).
FIGURE LEGENDS
Figure S1 - dSTORM cluster analysis of CD9 in HeLa cells
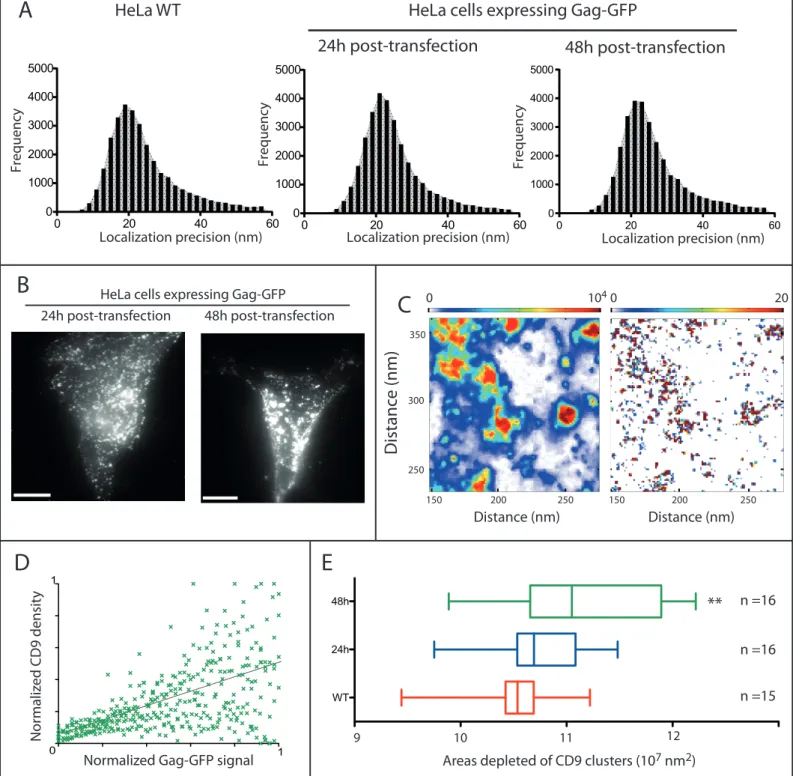
(A) Localization accuracy: frequency distributions of dSTORM localization precision in HeLa cells under naive (WT), 24h or 48h Gag-GFP expression. (B) Gag-GFP fluorescence signal acquired by TIRF microscopy from HeLa cells expressing HIV-1 Gag-GFP for 24h or 48h (shown in Fig. 1A). Scale bars, 10µm. (C) Left: TIRF image of Gag-GFP foci at the plasma membrane of a HeLa cells 48h post-transfection (left); relative GFP intensity is pseudo-colored according to the associated color scale bar (arbitrary units). Right: the corresponding molecular density map of CD9-Alexa647; density is pseudo-colored according to the associated color scale.
D) Normalized CD9 density (ratio of molecular density of CD9 within Gag-GFP domains to total
molecular density) correlated to the normalized intensity of Gag-GFP assembly sites (48h post-transfection, number of cells = 8). The correlation coefficient is 0.44 with a r2 of 0.33. E) Box and Whiskers representation (5-95% percentile) of areas depleted of CD9 clusters calculated from dSTORM analysis in control cells (red) or in cells expressing Gag-GFP proteins 24h (blue)
or 48h (green) after transfection. Error bars are SEM and n is the number of analysed cells.
** indicates p value below 0.001 as compared to WT, as determined by the Mann–Whitney
U-test.
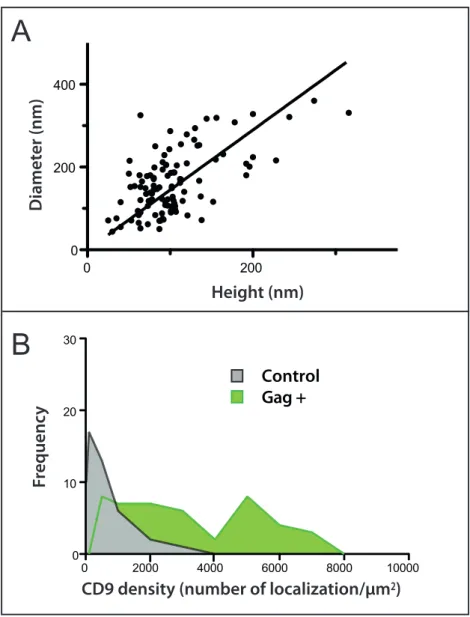
Figure S2 - Size of budding sites measured by AFM(A) Size distribution of HIV-1 Gag-GFP particles. Height and diameter of GFP-positive buds were measured by AFM (n = 60). The line represents the linear regression between these 2 parameters. (B) Distribution of CD9 “true” density in Gag-GFP domains (Gag+) compared to regions of the
membrane where Gag-GFP protein is absent (control). The true density is the number of CD9 dSTORM localizations divided by the bud membrane area, measured from AFM topographic images.
The control distribution is calculated from areas randomly selected in membrane regions devoid of Gag-GFP (n = 53); these densities were calculated from a 3 pixels x 3 pixels ROI, which is the range of the bud area. Figure S3 - Gallery of correlative images of budding sites Panel of six representative images of budding sites in different cells expressing Gag-GFP (670 nm x
670 nm zooms): first row, AFM topography images; second row, AFM signal is overlaid with CD9 dSTORM localizations (red dots); third row, idem with GFP-Gag signal in addition (green). The color scale bar for AFM is 350 nm.
Figure S4 - CD9 and CD81 are dispensable for VLPs release
The acute enrichment of CD9 and CD81 into Gag-induced budding sites questioned about the
functional role of CD9 and CD81 in membrane remodeling and/or bud fission. Since tetraspanins share a number of interactors, CD9 and CD81 may be at least partially redundant, we thus co-depleted CD9 and CD81 by siRNA approach and measured VLP production as well as CD9 and CD81 expression within both cells and VLPs.
A) Cells were co-transfected or not (control - Ctl) with Gag (pNL4-3∆) and siRNA targeting CD9, CD81, both tetraspanins or scrambled (Sc) SiRNA. Expression of p24, CD9 and CD81 were analyzed by western blotting. The supernatant is representative of VLP particles released in the extracellular
medium. Brackets highlight the expression of CD81 and CD9 when downregulating CD9 and CD81, respectively.
B) Relative expression of CD9 (white box) and CD81 (grey box) in supernatants as compared to
control cells (scrambled SiRNA). No significant difference were observed in cell extracts. Importantly no significant difference in p24 expression was observed in both cell extracts and supernatants. Quantitation was performed with FIJI and statistical analysis in Prism using ANOVA test combined
Figure S5 - Gag proteins recruit and reorganize the tetraspanin CD81 at the plasma membrane of HeLa cells (A) dSTORM images of CD81 in a naïve HeLa cell (top) and a Gag-GFP expressing HeLa cell at 48h post-transfection (down) with regions in white boxes (10μm × 10μm) enlarged on the second row. Scale bars are 5 µm (first row) and 1 µm (second row).
(B) Histograms representing the CD81 cluster size in nm2 in WT cells (red) or GFP-Gag-expressing cells 48 h after transfection (green). In the mirror histograms below the X axis, empty and hatched histograms represent the density outside and within Gag-GFP positive areas, respectively. ***
indicates a p value below 0.0001 for comparison of CD81 cluster sizes inside Gag domains versus cluster sizes outside these domains, as determined by the Mann-Whitney U-test.
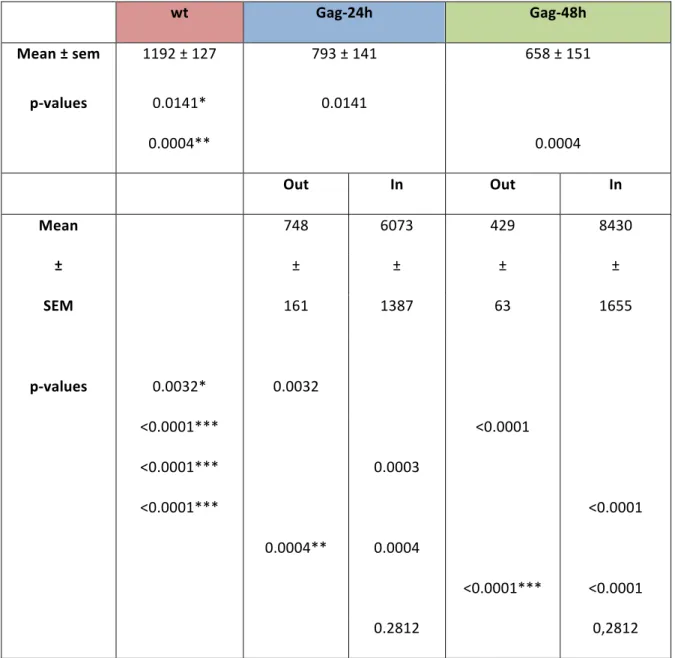
Table S1: CD9 density wt Gag-24h Gag-48h Mean ± sem 1192 ± 127 793 ± 141 658 ± 151 p-values 0.0141* 0.0004** 0.0141 0.0004
Out In Out In
Mean 748 6073 429 8430 ± ± ± ± ± SEM 161 1387 63 1655 p-values 0.0032* 0.0032 <0.0001*** <0.0001*** <0.0001*** 0.0004** 0.0003 0.0004 <0.0001 <0.0001*** <0.0001 <0.0001 0.2812 0,2812
CD9 density is expressed as the number of localization events per µm2 (± sem). p values were calculated using a non parametric two-tailed Mann-Whitney U-test. *, **, and *** respectively
indicate p values below 0.05, 0,001 and 0.0001. Each p value corresponding to a pair of data sets is indicated twice on the same line in the corresponding data set column.
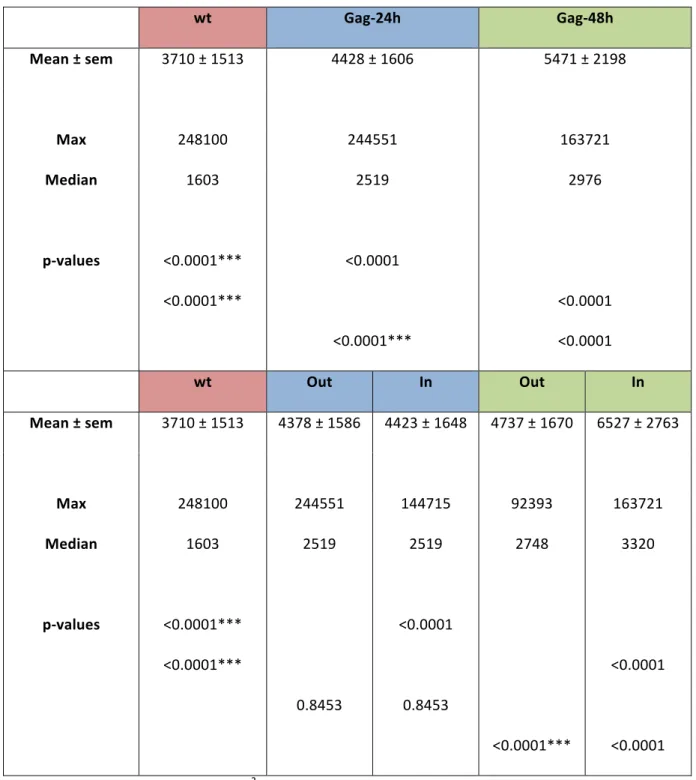
Table S2: CD9 cluster sizes wt Gag-24h Gag-48h Mean ± sem 3710 ± 1513 4428 ± 1606 5471 ± 2198 Max 248100 244551 163721 Median p-values 1603 <0.0001*** <0.0001*** 2519 <0.0001 <0.0001*** 2976 <0.0001 <0.0001
wt Out In Out In
Mean ± sem 3710 ± 1513 4378 ± 1586 4423 ± 1648 4737 ± 1670 6527 ± 2763 Max 248100 244551 144715 92393 163721 Median p-values 1603 <0.0001*** <0.0001*** 2519 0.8453 2519 <0.0001 0.8453 2748 <0.0001*** 3320 <0.0001 <0.0001 CD9 cluster size is expressed in nm2 (± sem). p values were calculated using a non parametric two-tailed Mann-Whitney U-test. *, **, and *** respectively indicate p values below 0.05, 0,001 and 0.0001. Each p value corresponding to a pair of data sets is indicated twice on the same line in the
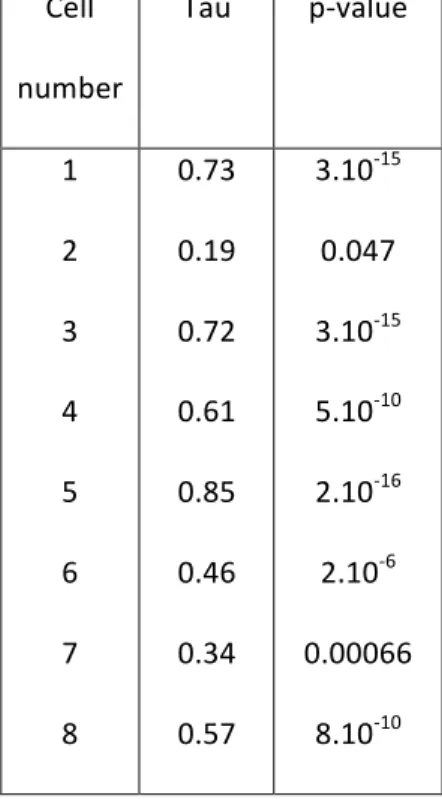
Table S4: Correlation between GFP-Gag intensity and CD9 density (Kendall method) Cell number Tau p-value 1 2 3 4 5 6 7 8 0.73 0.19 0.72 0.61 0.85 0.46 0.34 0.57 3.10-15 0.047 3.10-15 5.10-10 2.10-16 2.10-6 0.00066 8.10-10 Bibliography 1 C. Chamontin, P. Rassam, M. Ferrer, P.-J. Racine, A. Neyret, S. Lainé, P.-E. Milhiet and M. Mougel, Nucleic Acids Res., 2015, 43, 336–347.
3 C. Espenel, E. Margeat, P. Dosset, C. Arduise, C. Le Grimellec, C. A. Royer, C. Boucheix, E. Rubinstein and P.-E. Milhiet, J. Cell Biol., 2008, 182, 765–776. 4 A. Sergé, N. Bertaux, H. Rigneault and D. Marguet, Nat Meth, 2008, 5, 687–694. 5 J.-B. Fiche, D. I. Cattoni, N. Diekmann, J. M. Langerak, C. Clerte, C. A. Royer, E. Margeat, T. Doan and M. Nöllmann, PLoS Biol., 2013, 11, e1001557. 6F. Levet, E. Hosy, A. Kechkar, C. Butler, A. Beghin, D. Choquet and J.-B. Sibarita, Nat. Methods, 2015, 12, 1065–1071.
24h post-transfection 48h post-transfection HeLa cells expressing Gag-GFP
B
C
Normalized Gag-GFP signal
Nor maliz ed CD9 densit y 0 1 1 Frequency Localization precision (nm) 0 20 40 60 0 1000 2000 3000 4000 5000 0 20 40 60 0 1000 2000 3000 4000 5000 Localization precision (nm) Frequency 0 20 40 60 0 1000 2000 3000 4000 5000 Localization precision (nm) Frequency
24h post-transfection
48h post-transfection
Distance (nm)Distanc
e (nm)
150 200 250 150 200 250 Distance (nm) 250 300 350 0 20 0 104D
WT 24h 48hAreas depleted of CD9 clusters (107 nm2)
9 10 11 12
E
**
n =15 n =16 n =16Figure S1 - dSTORM cluster analysis of CD9 in HeLa cells
(A) Localization accuracy: frequency distributions of dSTORM localization precision in HeLa cells under naive (WT), 24h or 48h Gag-GFP expression.
(B) Gag-GFP fluorescence signal acquired by TIRF microscopy from HeLa cells expressing HIV-1 Gag-GFP for 24h or 48h (shown in Fig. 1A). Scale bars, 10µm.
(C) Left: TIRF image of Gag-GFP foci at the plasma membrane of a HeLa cells 48h post-transfection (left); relative GFP intensity is pseudo-colored according to the associated color scale bar (arbitrary units). Right: the corresponding molecular density map of CD9-Alexa647; density is pseudo-colored according to the associated color scale. D) Normalized CD9 density (ratio of molecular density of CD9 within Gag-GFP domains to total molecular density) correlated to the normalized intensity of Gag-GFP assembly sites (48h post-transfection, number of cells = 8). The correlation coefficient is 0.44 with a r2 of 0.33.
E) Box and Whiskers representation (5-95% percentile) of areas depleted of CD9 clusters calculated from dSTORM analysis in control cells (red) or in cells expressing Gag-GFP proteins 24h (blue) or 48h (green) after transfection. Error
Height (nm)
D
iamet
er (nm)
0 200 0 200 400Gag +
Control
CD9 density (number of localization/µm
2)
B
A
0 2000 4000 6000 8000 10000 0 10 20 30Fr
equenc
y
Figure S2 - Size of budding sites measured by AFM
(A) Size distribution of HIV-1 Gag-GFP particles. Height and diameter of GFP-positive buds were measured by AFM (n = 60). The line represents the linear regression between these 2 parameters.
(B) Distribution of CD9 “true” density in Gag-GFP domains (Gag+) compared to regions of the membrane where Gag-GFP protein is absent (control). The true density is the number of CD9 dSTORM localizations divided by the bud membrane area, measured from AFM topographic images. The control distribution is calculated from areas randomly selected in membrane regions devoid of Gag-GFP (n = 53); these densities were calculated from a 3 pixels x 3 pixels ROI, which is the range of the bud area.
AFM
AFM
CD9 (dSTORM)
AFM
CD9 (dSTORM)
Gag-GFP
Figure S3 - Gallery of correlative images of budding sites
Panel of six representative images of budding sites in different cells expressing Gag-GFP (670 nm x 670 nm zooms): first row, AFM topography images; second row, AFM signal is overlaid with CD9 dSTORM localizations (red dots); third row, idem with GFP-Gag signal in addition (green). The color scale bar for AFM is 350 nm. Figure S3 - Gallery of correlative images of budding sites
Panel of six representative images of budding sites in different cells expressing Gag-GFP (670 nm x 670 nm zooms): first row, AFM topography images; second row, AFM signal is overlaid with CD9 dSTORM localizations (red dots); third row, idem with GFP-Gag signal in addition (green). The color scale bar for AFM is 350 nm.
CD9
CD81
p24
pNL4-3∆
SiRNA
+
+
+
+
-
+
+
+
+
-CD9
CD81
CD9-CD81
Ctl
Sc
Sc
CD9
CD81
CD9-CD81
Ctl
Supernatant
Cell extract
CD9
CD9-CD81
CD81
Sc
SiRNA
Relative Expression
as compard to Sc
0 0.4 0.8 1.2 * *
A
B
CD9
CD81
Figure S4 - CD9 and CD81 are dispensable for VLPs release
The acute enrichment of CD9 and CD81 into Gag-induced budding sites questioned about the functional role of CD9 and CD81 in membrane remodeling and/or bud fission. Since tetraspanins share a number of interactors, CD9 and CD81 may be at least partially redundant, we thus co-depleted CD9 and CD81 by siRNA approach and measured VLP production as well as CD9 and CD81 expression within both cells and VLPs.
A) Cells were co-transfected or not (control - Ctl) with Gag (pNL4-3∆) and siRNA targeting CD9, CD81, both tetraspanins or scrambled (Sc) SiRNA. Expression of p24, CD9 and CD81 were analyzed by western blotting. The supernatant is representative of VLP particles released in the extracellular medium. Brackets highlight the
expression of CD81 and CD9 when downregulating CD9 and CD81, respectively.
B) Relative expression of CD9 (white box) and CD81 (grey box) in supernatants as compared to control cells (scrambled SiRNA). No significant difference were observed in cell extracts. Importantly no significant difference in p24 expression was observed in both cell extracts and supernatants. Quantitation was performed with FIJI and statistical analysis in Prism using ANOVA test combined with a Turkey's multiple comparison test; * indicates a p value below 0.05.
A
HeLa e xpr essing G ag-GFP HeLa WTB
CD81 Clust er siz e (nm 2) 8000 4000 0 4000 8000 48h WT n=12 n=9 ***Figure S5 - Gag proteins recruit and reorganize the tetraspanin CD81 at the plasma membrane of HeLa cells (A) dSTORM images of CD81 in a naïve HeLa cell (top) and a Gag-GFP expressing HeLa cell at 48h post-transfection (down) with regions in white boxes (10µm × 10µm) enlarged on the second row. Scale bars are 5 µm (first row) and 1 µm (second row).
(B) Histograms representing the CD81 cluster size in nm2 in WT cells (red) or GFP-Gag-expressing cells 48 h after transfection (green). In the mirror histograms below the X axis, empty and hatched histograms represent the density outside and within Gag-GFP positive areas, respectively. *** indicates a p value below 0.0001 for comparison of CD81 cluster sizes inside Gag domains versus cluster sizes outside these