HAL Id: hal-02898156
https://hal.inrae.fr/hal-02898156
Submitted on 13 Jul 2020HAL is a multi-disciplinary open access archive for the deposit and dissemination of sci-entific research documents, whether they are pub-lished or not. The documents may come from teaching and research institutions in France or abroad, or from public or private research centers.
L’archive ouverte pluridisciplinaire HAL, est destinée au dépôt et à la diffusion de documents scientifiques de niveau recherche, publiés ou non, émanant des établissements d’enseignement et de recherche français ou étrangers, des laboratoires publics ou privés.
behaviors at 2 years of age and subsequent adiposity:
the EDEN mother–child cohort
Cécilia Saldanha-Gomes, Barbara Heude, M-A Charles, Blandine de
Lauzon-Guillain, Jérémie Botton, Sophie Carles, Anne Forhan, Patricia
Dargent-Molina, Sandrine Lioret, Eden Mother-Child Cohort Study Group
To cite this version:
Cécilia Saldanha-Gomes, Barbara Heude, M-A Charles, Blandine de Lauzon-Guillain, Jérémie Botton, et al.. Prospective associations between energy balance-related behaviors at 2 years of age and subse-quent adiposity: the EDEN mother–child cohort. International Journal of Obesity, Nature Publishing Group, 2017, 41 (1), pp.38-45. �10.1038/ijo.2016.138�. �hal-02898156�
Prospective associations between energy balance-related behaviors at 2 years of age and subsequent adiposity: the EDEN mother-child cohort
Cécilia Saldanha-Gomes, Barbara Heude, Marie-Aline Charles, Blandine de Lauzon-Guillain, Jérémie Botton, Sophie Carles, Anne Forhan, Patricia Dargent-Molina, Sandrine Lioret; on behalf of the EDEN mother-child cohort study group1.
Affiliations:
INSERM, UMR1153 Epidemiology and Biostatistics Sorbonne Paris Cité Center, Early ORigin of the Child’s Health and Development Team (ORCHAD), Paris, F-75014 France. (CSG, BH, MAC, BLG, JB, SC, AF, PDM, SL)
Paris-Sud University, Faculty of medicine. Kremlin-Bicêtre, France. (CSG, SC) Paris Descartes University, Paris, France. (BH, MAC, BLG, AF, PDM, SL). Paris-Sud University, Faculty of Pharmacy, Châtenay-Malabry, France. (JB). 1
Members of the EDEN Mother-Child Cohort Study Group: I. Annesi-Maesano, J.Y. Bernard, J. Botton, M.A. Charles, P. Dargent-Molina, B. de Lauzon-Guillain, P. Ducimetière, M. de Agostini, B. Foliguet, A. Forhan, X. Fritel, A. Germa, V. Goua, R. Hankard, B. Heude, M. Kaminski, B. Larroque†, N. Lelong, J. Lepeule, G. Magnin, L. Marchand, C. Nabet, F Pierre, R. Slama, M.J. Saurel-Cubizolles, M. Schweitzer, O. Thiebaugeorges.
Conflict of interest
None of the authors had a conflict of interest.
Corresponding Author (and requests for reprints): S Lioret, INSERM, UMR1153
Epidemiology and Biostatistics Sorbonne Paris Cité Center (CRESS), Early ORigin of the Child’s Health And Development Team (ORCHAD), 16, avenue Paul Vaillant Couturier,
94807 Villejuif Cedex France. sandrine.lioret@inserm.fr. Tel 33 1 45 59 51 78, Fax: 33 1 47 26 94 54.
Funding: We acknowledge all funding sources for the EDEN study: Foundation for Medical
Research (FRM), National Agency for Research (ANR), National Institute for Research in Public Health (IRESP: TGIR cohorte santé 2008 program), French Ministry of Health (DGS), French Ministry of Research, INSERM Bone and Joint Diseases National Research (PRO-A) and Human Nutrition National Research Programs, Paris–Sud University, Nestlé, French National Institute for Population Health Surveillance (InVS), French National Institute for Health Education (INPES), the European Union FP7 programmes (FP7/2007-2013, HELIX, ESCAPE, ENRIECO, Medall projects), Diabetes National Research Program (through a collaboration with the French Association of Diabetic Patients (AFD)), French Agency for Environmental Health Safety (now ANSES), Mutuelle Générale de l’Education Nationale (a complementary health insurance fund) (MGEN), French national agency for food security, French-language association for the study of diabetes and metabolism (ALFEDIAM). The funders had no influence of any kind on the analyses or the interpretation of the results.
Short running head: Early obesogenic energy balance-related behaviors
Abbreviations: bioelectrical impedance analysis (BIA); Body mass index (BMI); Energy
balance-related behaviors (EBRBs); Food frequency questionnaire (FFQ); Percentage of body fat (%BF); Principal component analysis (PCA); Socio-economic position (SEP).
Abstract
1Background/Objectives Sedentary behavior, physical activity and dietary behavior are formed 2
early during childhood and tend to remain relatively stable into later life. No longitudinal studies 3
have assessed the independent influence of these three energy balance-related behaviors during 4
toddlerhood on later adiposity. We aimed to analyze the associations between screen time, outdoor 5
play time, and dietary patterns at age 2 years and child adiposity at age 5, in boys and girls 6
separately. 7
Subjects/Methods This study included 883 children from the French EDEN mother-child cohort. 8
Screen time, outdoor play time and dietary intakes were reported by parents in questionnaires when 9
the child was aged 2. Two dietary patterns, labelled “Guidelines” and “Processed, fast-foods”, were 10
identified in a previous study. Percentage of body fat (%BF) based on bioelectrical impedance 11
analysis and body mass index were measured at age 5. 12
Results In boys, screen time at age 2 was positively associated with %BF at age 5 (β= 0.51 (95% 13
confidence interval (CI): 0.02, 1.01) for those boys with ≥60 min/day of screen time vs. those with 14
≤15 min/day, P for trend 0.045). In girls, outdoor play was inversely associated with %BF (β= -0.93 15
(95%CI: -1.58, -0.28) for those in the highest tertile of outdoor play time vs. those in the lowest 16
tertile, P= 0.002). Overall, at age 2, dietary patterns were associated with both screen time and 17
outdoor play time, but no significant and independent association was observed between dietary 18
patterns and later adiposity. 19
Conclusion This study shows longitudinal and gender differentiated relations between both screen 20
time and outdoor play time in toddlerhood and later adiposity, while evidence for a relation between 21
dietary patterns and subsequent fat development was less conclusive. Early childhood - by age 2 - 22
should be targeted as a critical time for promoting healthy energy balance-related behaviors. 23
24 25
INTRODUCTION
26Childhood overweight and obesity have reached epidemic proportions worldwide.1 In 2010, the 27
estimated prevalence among preschool children was as high as 11.7% in developed countries and 28
6.1% in developing countries.2 This epidemic has reached the whole pediatric population, with 29
secular trends towards higher fat mass in both obese and non-obese children. Beyond any 30
predisposition due to genetic susceptibility or programming of later adiposity by the intrauterine 31
environment, the rapid increase in adiposity in recent decades in young children may also indicate 32
that obesogenic energy balance-related behaviors (EBRBs), namely high levels of sedentary 33
behaviors, low levels of physical activity and unhealthy dietary behaviors, come into play at an 34
early age.3 4 35
Early childhood (< 5 years) is critical for the setting of EBRBs for a number of reasons. Early 36
exposure to active play stimulates motor skills, which predict later physical activity.5 Early food 37
experiences influence the development of taste and food preferences, which in turn affect 38
subsequent eating habits.6-8 Furthermore, there is some evidence that sedentary behaviors, physical 39
activity and dietary intakes track (the concept of tracking relates to the stability, or relative ranking 40
within a cohort, of behaviors over time) from early childhood into later childhood, adolescence and 41
even adulthood.9-13 The early establishment of obesogenic EBRBs, which are maintained once 42
habits are formed, is therefore hypothesized to lead to a cumulative increase of positive energy 43
balance over the life course, favoring the development of body fat.4 Hence, identifying the specific 44
early behaviors that are most predictive of later body fat development, especially those that are 45
modifiable, is a necessary step for developing effective interventions and public health policies 46
aimed at reducing childhood overweight and obesity. 47
Accumulating evidence from longitudinal studies in preschoolers (roughly aged 3-5 years at 48
baseline) indicates that sedentary behavior - mainly television viewing - is deleterious and physical 49
activity protective for later adiposity.4 14 Inconsistent evidence characterizes the prospective 50
relations between early dietary behaviors and overweight.13-15 There is however a dearth of research 51
examining these longitudinal associations among children younger than 3,13 16 despite growing 52
evidence that toddlers are already engaging in high levels of screen time17 and that suboptimal 53
dietary patterns are already established by age 2.12 18 Moreover, despite a careful search, we have 54
been unable to find any longitudinal studies among toddlers that have taken the three EBRBs into 55
account simultaneously, nor have we found any that have studied boys and girls separately, 56
although both body composition19 and physical activity20 21 differ between preschool boys and girls. 57
58
We aimed to analyze the independent associations between screen time, outdoor play time, and 59
dietary patterns at age 2 and child adiposity at age 5, assessed by comprehensive and specific 60
measurements, including bioelectrical impedance analysis. We hypothesized that outdoor play time 61
and healthy dietary patterns would be protective against the development of adiposity, while screen 62
time and non-healthy dietary patterns would not be. We assumed that the effects might be modified 63
by gender and therefore conducted the analysis separately in boys and girls. 64
65
SUBJECTS AND METHODS
66Subjects 67
The EDEN mother-child study is a prospective cohort designed to assess pre- and postnatal 68
determinants of child health and development; it has been described in detail elsewhere.22 In brief, 69
between 2003 and 2006, 2002 pregnant women (< 24-weeks’ gestation) aged 18-44 years were 70
recruited in two university hospital maternity clinics, in Nancy and Poitiers, France. Exclusion 71
criteria were multiple pregnancies, diabetes history, French illiteracy, and plans to move out of the 72
region within the next three years. Approval for the study was obtained from the relevant ethics 73
committee (ID 0270 of 12 December 2012) and the French Data Protection Authority (CNIL, ID 74
902267 of 12 December 2012). Written consents were obtained from each participant. 75
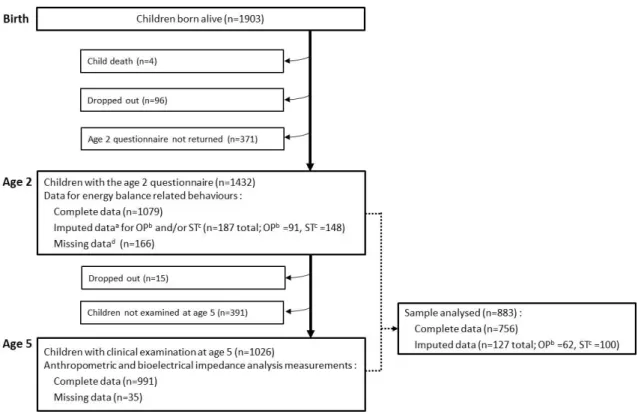
There were 1903 live born children; 1266 sets of parents returned the questionnaire with complete 76
or imputed data for the child EBRBs at age 2; the participants selected for this study are the 883 for 77
whom data were available for both anthropometric and bioelectrical impedance analysis (BIA) 78
measurements at age 5 (Figure 1). The current sample thus comprised 473 boys and 410 girls with 79
both behavioral and adiposity measurements. 80
81
Adiposity measurements at age 5 82
Anthropometric and bioelectrical impedance data were collected during the clinical examination 83
that took place at the Nancy and Poitiers university hospitals when the child was 5 (mean 5.65 84
years, SD 0.16). Measurements were performed by trained investigators, using standard procedures. 85
Anthropometric measurements. Height and weight were measured twice, then averaged. The
86
children’s heights were measured to the nearest 0.1 cm with wall-mounted stadiometers (Model 87
208, SECA, Hamburg, Germany) as they stood barefoot, and their weights to the nearest 0.2 kg 88
with an electronic scale (Model 888, SECA, Hamburg, Germany), while they wore light underwear. 89
Body mass index (BMI) was calculated as weight (kg)/height² (m²). Skinfold thickness was taken 90
three times, then averaged, to the nearest 0.2 mm at the left triceps and subscapular sites, with a 91
Holtain skinfold caliper (Chasmors Ltd, London, UK). 92
Bioelectrical impedance analysis (BIA) measurements. All children underwent BIA twice (and the
93
two measurements were averaged), with a single-frequency impedance analyzer (Model BIA 101, 94
Akern-RJL, Italy)after 5 minutes of rest and with an empty bladder. 95
Percentage of body fat. The estimated percentage of body fat (%BF) was based on the
96
anthropometric and BIA measures and used three different equations: from Houtkooper et al.,23 97
Slaughter et al.24 and Goran et al.25 The latter, which takes body resistance and all anthropometric 98
measures listed above (height, weight, and skinfold thickness) into account, was developed among 99
white children aged 4-9 years. Because it was considered the most suitable for our study population, 100
it was prioritized in the analysis. 101
102
Energy balance-related behaviors at age 2 103
Sedentary behavior and physical activity. Postal questionnaires were sent to parents and completed,
104
primarily by mothers, when the children were aged 2 (mean 2.03 years, SD 0.09). Sedentary 105
behavior was assessed from the responses to three questions regarding the time (in min/day) that the 106
child spent watching television or playing video or computer games, on a typical weekday 107
(excluding Wednesday), Wednesday (which was a day off school at the time of the study), and 108
weekend days; there was one question for each type of day. Similarly, physical activity was 109
assessed from three questions about the time the child usually spent playing outdoors (e.g., in a 110
backyard, a park, a playground) for each type of day. An average daily time was calculated and 111
weighted for both types of activity. Sedentary screen time was split into three categories, i.e., ≤15 112
min/day, >15 min/day to <1 h/day, and ≥ 1 h/day, which corresponded to tertiles in our population. 113
Given the children’s age and the period of data collection (2005-2008), we can reasonably think that 114
television (and DVDs) accounted for most of the screen time in our study.26 There is evidence of 115
seasonal variations in physical activity, especially for the time children spend playing outdoors.27 116
Hence, the daily time spent playing outdoors was categorized into season-specific tertiles (low, 117
intermediate, and high). Imputations were done for 187 children when one or two items of the three 118
(i.e., weekday, Wednesday, weekend day) were missing for a given activity, based on the values 119
available for any other day. 120
Dietary patterns. Children dietary intake at age 2 was collected with a food frequency questionnaire
121
(FFQ) included in the postal questionnaire and described in detail elsewhere.12 In brief, the food 122
classification was established based on similarities in food type and context of consumption and 123
was designed to be able to describe the patterns of the child’s diet. The FFQ included 26 food 124
groups along with seven possible responses, ranging from “Never” to “Several times per day”; all 125
were converted into weekly frequencies. A previous analysis of these data12 using principal 126
component analysis (PCA), identified two dietary patterns, which accounted for 19.8% of the 127
explained variance. The first pattern, labelled “Processed, fast-food”, was positively correlated with 128
intake of French fries, processed meat, carbonated soft drinks, crisps, biscuits, pizzas, fruit juices, 129
dairy puddings and ice cream, legumes, and bread (by descending order of factor loadings) and 130
inversely correlated with the intake of cooked vegetables. The second pattern, labelled 131
“Guidelines”, was mainly characterized by high consumption frequency of cooked vegetables, rice, 132
fruits, raw vegetables, low fat fish, potatoes, ham, compotes, meat, and bread. Scores for each 133
pattern were calculated at the individual level by summing the observed standardized frequencies of 134
consumption per food group, weighted according to the PCA loadings. 135
136
Covariates 137
Baseline BMI. Using the Jenss-Bayley nonlinear model and measurements collected from the 138
child’s health care booklet (birth to 5 years) and at the clinical examinations undertaken at the 139
university clinics at ages 1, 3, and 5, we fitted individual weight and height growth trajectories.28 140
The resulting equation allowed us to predict both weight and height and therefore BMI at age 2. 141
Socio-economic position (SEP). Since SEP is a recognized covariate of diet in early childhood,18 29
142
the analysis adjusted for maternal education (the highest diploma obtained: less than high-school, 143
high school diploma, 2-year university degree and ≥3 year university degree) and monthly 144
household income (in €) at inclusion (categorized as ≤1500, 1501 to 2300, 2301 to 3000, 3001 to 145 3800, >3800). 146 147 Statistical analysis 148
The study population was compared to the EDEN population not selected for this study (that is, the 149
initially included families with live born children for whom any of behavioral variables at age 2 or 150
adiposity measurements at age 5 were not available) for infant birth characteristics, parental 151
demographic characteristics and SEP. Within the study population, boys and girls were compared 152
for EBRBs, adiposity outcomes, and covariates. Chi-square tests were used for categorical variables 153
and Student t-tests for continuous variables. The relations between the EBRBs at age 2 were also 154
assessed, adjusting for SEP and study center, with multivariable linear and ordinal logistic 155
regression analyses. 156
Multivariable linear regression analysis was used to assess the association between EBRBs at age 2 157
and adiposity at age 5. For each of the four outcomes (i.e., BMI and %BF with each of the three 158
equations described above), the analysis was conducted in two steps. First, screen time, outdoor 159
play time, and dietary patterns were each included in separate models. Then the three EBRBs were 160
included simultaneously along with the SEP variables in a single model, referred as the fully-161
adjusted model. All models were run for boys and girls separately, and adjusted for center (Poitiers 162
or Nancy), baseline BMI, and exact age at the 5-year clinical examination. Finally, sensitivity 163
analyses were carried out for the sample excluding children with imputed data (complete case 164
sample, n=756). 165
SAS 9.3 was used for the statistical analyses, and the level of significance set at P<0.05. 166
167
RESULTS
168Characteristics of the study population 169
Table 1 summarizes the characteristics of boys and girls in the study sample. At age 2, the boys 170
spent more time playing outdoors and had a slightly lower mean BMI than girls. There was no 171
significant difference between genders for either dietary pattern scores or screen time. Overall, 172
12.2% of the 2-year-old children spent no time on screen activities, 54.7% less than 1 h/day, and 173
33.1% 1 h/day or more. At age 5, %BF and prevalence of overweight (including obesity) were both 174
significantly lower among boys than girls. 175
Compared to non-selected children, children selected for the current study were less likely to have 176
been born to a young mother (28.9 years vs. 30.2, P <10-4), to have a mother with a lower education 177
level (42% with education < high school diploma vs. 19%, P <10-4), and to live in a low-income 178
household (22.2% vs. 10.8% with household monthly income ≤1500 €, P <10-4). However, there 179
was no significant difference in birth weight between the two samples. 180
181
Interrelations between energy balance-related behaviors at age 2 182
Associations between EBRBs at age 2 are presented by gender in Table 2. Among boys, higher 183
scores for the “Processed, fast-foods” dietary pattern were positively associated with screen time. 184
Among girls, “Guidelines” dietary pattern scores and, to a lesser extent, “Processed, fast-food” 185
dietary pattern scores were positively associated with outdoor play time (upper tertile). There was 186
no significant association in either gender between time spent at outdoor play and in front of a 187
screen (results not shown). 188
189
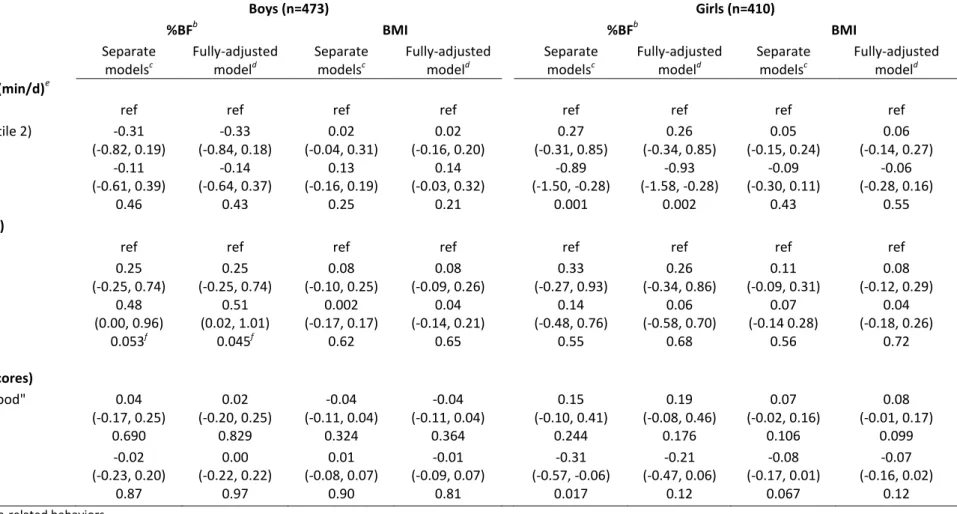
Independent associations between screen time, outdoor play time, and dietary patterns at age 190
2 and child adiposity at age 5 191
In boys, screen time at age 2 was the only EBRB that was significantly and positively associated 192
with %BF at age 5 in the separate models (Table 3). This association remained significant and the 193
coefficient estimates barely changed after adjustment for the other two EBRBs and for SEP. The 194
regression coefficient estimates suggest a graded dose-response relation (adjusted linear trend β 195
0.42, P = 0.045). In girls, both the time spent playing outdoors and the score on the “guideline” 196
dietary pattern at age 2 were significantly and negatively associated with %BF at age 5 in the 197
separate models. The association with outdoor play remained significant and the coefficient 198
estimates barely changed in the fully adjusted model, while the association with the “Guideline” 199
dietary pattern was no longer significant. The regression coefficient estimates for outdoor play 200
suggested that the effect was driven by the upper tertile of the variable. Similar results were found 201
with the other two estimates of %BF (i.e., based on Houtkooper’s and Slaughter’s equations) 202
(Supplementary Table 1). No EBRB was significantly and independently associated with BMI at 203
age 5 in either gender. Sensitivity analyses for the sample excluding children with imputed data 204
(complete case sample) produced consistent results (Supplemental Table 2). 205
206
DISCUSSION
207This study, which highlights the precocity of the onset of behavioral risk factors for obesity, is to 208
our knowledge the first to find that the amounts of time spent on screen and in outdoor play during 209
toddlerhood are each prospectively and independently associated with later adiposity, regardless of 210
diet, SEP, and baseline BMI. 211
212
Our results confirm previous findings in preschoolers suggesting that early exposure to screens - 213
mainly measured as television viewing - is obesogenic.14 30 They further show that this effect is 214
apparent at an age as early as 2 in boys. The literature suggests several underlying mechanisms that 215
may explain this association, including reduced resting metabolic rate,31 displacement of more 216
active pursuits,32 exposure to advertising of junk food and fast food leading to increased children’s 217
requests for those particular foods and products, and increased snacking while watching television 218
or movies.33 34 Consistent with observations in older children,35 36 we found a positive association 219
between screen time and “Processed and fast-foods” dietary pattern scores at age 2, but only in 220
boys. This may help to explain why the positive association between screen time and later adiposity 221
was significant only in boys, even though it was unaltered by adjustment for dietary patterns. 222
Finally, screen time has been inversely associated with sleep time,37 and short sleep duration has 223
been longitudinally associated with excess weight gain in early childhood.38 39 Screen time was not 224
associated with parent-reported sleep time at 2 years in our population (not shown). A previous 225
cross-sectional analysis of EDEN data at 3 years did however suggest that - again for boys only - 226
short sleep duration was positively associated with both screen time and BMI.40 Current guidelines 227
recommend to avoid exposure to screens before age 2 and to limit screen time to less than 1 h or 2 h 228
daily between age 2 and 5.41-44 In our sample of 2-year olds, only 12.2% had no screen activities at 229
all, while about a third had an hour or more daily. The graded dose-response shape of the 230
association with adiposity in our results, added to the growing evidence that increased screen time 231
in early years is associated with unfavorable scores on measures of psychological health and 232
cognitive development,30 45 is a further reason that parents should be informed about the deleterious 233
health effects of early screen exposure. 234
235
Our findings also provide unique insights into the protective role of outdoor play in toddlerhood for 236
later adiposity. This is consistent with the review by te Velde et al.14 that showed strong evidence 237
for an inverse longitudinal association between objectively-measured total physical activity at 238
preschool age and later overweight. As these authors noted, however, these findings did not allow 239
them to identify the specific components of physical activity that drove the association. Play time 240
spent outdoors has been positively related to total physical activity in preschoolers,21 and we can 241
reasonably hypothesize that this is also true at age 2, since the physical activity of children younger 242
than 5 is essentially unstructured, and might be described more appropriately as “active free play”.20 243
Furthermore, preschoolers are generally more physically active outdoors than indoors.46Hence, it 244
has been suggested that outdoor play is a major contributor of physical activity in young children.47 245
Toddlers who engage in more outdoor play are thus likely to expend more energy, which leads to 246
both a healthier energy balance and stimulated motor skills.5 Of note, the negative association 247
between outdoor play and adiposity was present only in girls. Outdoor play time may be an even 248
better indicator of total physical activity for girls than for boys, since girls are overall less active 249
than boys and may spend more of their indoor play time in quiet play (e.g., drawing, tinkering, 250
looking into books, which are considered as productive sedentary behaviors26) than boys do. 251
Noteworthy, outdoor play in young children is under parental control, and there is some evidence to 252
suggest that children’s physical activity is strongly associated with parental activity and 253
encouragement, especially in girls.48 Moreover, only the upper tertile of outdoor play was 254
negatively associated with later adiposity, and girls in that highest tertile also had higher scores on 255
the “Guidelines” dietary pattern. Hence, taking toddlers outdoors to stimulate their motor skills and 256
provide them with an opportunity for active play may also reflect healthier family lifestyles and 257
attitudes, especially for girls.48 Current physical activity guidelines49-51 recommend that children 258
aged 1-5 years should be physically active every day for at least a total of 3 hours, at any intensity, 259
spread throughout the day.In our sample of 2-year old French children, the upper tertile of outdoor 260
play corresponds to a median play time around 2 to 4 hours, depending on the season. Although 261
parents have traditionally assumed that young children were spontaneously and sufficiently 262
physically active, growing evidence suggests that this is not necessarily the case and that large inter-263
individual variability exists.20 52 Young girls are even less active than young boys,20 21 and our 264
results suggest that encouraging outdoor play may be a particularly effective way to promote 265
physical activity in young girls. 266
267
We found no strong evidence that dietary patterns at toddler ages are independent predictors of 268
subsequent body fat at 5 years, consistent with previous studies in children 0-5 years,14 15 18 38 but 269
not all.13 The current lack of consensus on the influence of diet on overweight is due in part to 270
methodological issues. Various measures have been used to define dietary intake; some studies have 271
focused on specific nutrients or foods, while others have addressed the diet as a whole, through 272
dietary patterns or eating behaviors. Residual confounding may also be important where analyses 273
have not taken major covariates such as physical activity and sedentary behavior into account. 274
Finally, most existing studies linking dietary intakes and child obesity are limited by their cross-275
sectional designs. Nevertheless, given that dietary patterns emerge early in life, tend to track into 276
the preschool years and beyond,9 10 12 13 and that we found they co-varied with other EBRBs, it is 277
possible that the cumulative effect of dietary patterns on adiposity will become more visible at older 278
ages, when most children enter formal schooling and levels of physical activity tend to decrease,53 279
as suggested by results from both the Avon Longitudinal Study of Parents and Children38 54 and the 280
Southampton Women’s Survey.13 281
282
A novel aspect and main strength of our study was the assessment of these associations from 283
toddlerhood, prospectively and considering both sides of the energy equation (i.e., intake and 284
expenditure) as well as the effect modification by gender. The comprehensive and objective 285
measurements of adiposity, together with the consistency of these associations across different 286
measurements of fat mass and different samples (study sample with imputed data vs. complete-case 287
sample), are additional strengths of this work. Overall, our findings also show the relevance of 288
using specific measures of body fat, because none of the associations observed was significant with 289
BMI, which cannot distinguish between fat and fat-free mass. The sole reliance on parental report 290
of behaviors is however a limitation in our analyses. These measurements are subject to social 291
desirability bias and are relatively imprecise compared to objective measurements (e.g., by 292
accelerometry), which may have attenuated the associations under study. We acknowledge that the 293
estimation of food intake would have been more precise with a quantitative FFQ. Nevertheless, 294
research shows that frequency of consumption is actually the major determinant of intake, while the 295
inclusion of portion or serving size in FFQs adds limited information about variance in food 296
intake.55 Therefore, frequencies of consumption have commonly been used to identify dietary 297
patterns,56 which are recognized to be relevant not only for assessing the association between total 298
diet and obesity but also because they can be translated into guidelines for the public.57 Finally, 299
although all levels of SEP were represented in this study, the sample is generally well educated (as 300
is most often the case in cohorts), with 81% of the mothers reporting ≥ high school education. 301
Prevalence of overweight and obesity at 5 years was also lower than in the general population, i.e., 302
7.6% vs. 11.9-13.5%.58 59 The presence of a selection bias is therefore possible and may have 303
implications for generalization of the findings. We can hypothesize that better representation of 304
disadvantaged families, in particular of those with clusters of unhealthy behaviors, would have 305
provided more contrast and better power to show higher effect sizes for the supposed longitudinal 306
effects of EBRBs on later adiposity. This may be especially true for dietary patterns, which are 307
known to be strongly socially patterned from early childhood.18 29 Remarkably, the current findings 308
suggest both adverse and protective effects even in this rather low-risk sample and thus make the 309
public health arguments even stronger. 310
311
In conclusion, this study shows longitudinal and gender-differentiated relations between screen time 312
and outdoor play in toddlerhood and later adiposity, while less conclusive findings were found for 313
the relation between dietary patterns and subsequent fat development. These results provide 314
additional evidence that early childhood - by age 2 - should be targeted as a critical time for 315
promoting healthy energy balance-related behaviors. 316
Acknowledgements: We are extremely grateful to all the families who took part in this study, the 317
midwives and psychologists who recruited and followed them, and the whole EDEN team, 318
including research scientists, engineers, technicians and managers and especially Josiane Sahuquillo 319
and Edith Lesieux for their commitment and their role in the success of the study. We also 320
acknowledge the commitment of the members of the EDEN Mother-Child Cohort Study Group: I. 321
Annesi-Maesano, J.Y. Bernard, J. Botton, M.A. Charles, P. Dargent-Molina, B. de Lauzon-Guillain, 322
P. Ducimetière, M. de Agostini, B. Foliguet, A. Forhan, X. Fritel, A. Germa, V. Goua, R. Hankard, 323
B. Heude, M. Kaminski, B. Larroque†, N. Lelong, J. Lepeule, G. Magnin, L. Marchand, C. Nabet, 324
F Pierre, R. Slama, M.J. Saurel-Cubizolles, M. Schweitzer, O. Thiebaugeorges. We thank Jo Ann 325
Cahn for her help in preparing the manuscript. 326
327
Contributors: CSG, PDM and SL conceived and designed the work, with advice from BH and 328
MAC. CSG analyzed the data with advice from BH, JB, PDM and SL. CSG, PDM and SL drafted 329
and revised the manuscript. All authors interpreted the data and criticized the manuscript for 330
important intellectual content. MAC and BH designed and led the EDEN mother-child cohort. AF is 331
responsible for the EDEN data management. JB and SC have fitted weight and height growth 332
trajectories using the Jenss-Bayley nonlinear model and provided the relevant data. All authors have 333
read and approved the final version of the manuscript. This article is the work of the authors. SL 334
serves as guarantor for the contents of this article. All authors had full access to all of the data 335
(including statistical reports and tables) in the study and take the responsibility for the integrity of 336
the data and the accuracy of the data analysis. All researchers are independent of the funding 337
bodies. All members in the EDEN mother-child cohort study group designed the study and revised 338
the draft manuscript. 339
340
Supplementary information is available at the International Journal Obesity’s website 341
REFERENCES 342
1. Lobstein T, Baur L, Uauy R. Obesity in children and young people: a crisis in public health. Obes Rev 343
2004;5 Suppl 1:4-104. 344
2. de Onis M, Blossner M, Borghi E. Global prevalence and trends of overweight and obesity among 345
preschool children. Am J Clin Nutr 2010;92:1257-1264. 346
3. Hill JO, Wyatt HR, Reed GW, Peters JC. Obesity and the environment: where do we go from here? 347
Science 2003;299:853-855.
348
4. Reilly JJ. Physical activity, sedentary behaviour and energy balance in the preschool child: opportunities 349
for early obesity prevention. Proc Nutr Soc 2008;67:317-325. 350
5. Barnett LM, van Beurden E, Morgan PJ, Brooks LO, Beard JR. Childhood motor skill proficiency as a 351
predictor of adolescent physical activity. J Adolesc Health 2009;44:252-259. 352
6. Birch LL. Development of food preferences. Annu Rev Nutr 1999;19:41-62. 353
7. Schwartz C, Scholtens PA, Lalanne A, Weenen H, Nicklaus S. Development of healthy eating habits early 354
in life. Review of recent evidence and selected guidelines. Appetite 2011;57:796-807. 355
8. de Lauzon-Guillain B, Jones L, Oliveira A, Moschonis G, Betoko A, Lopes C, et al. The influence of early 356
feeding practices on fruit and vegetable intake among preschool children in 4 European birth 357
cohorts. Am J Clin Nutr 2013;98:804-812. 358
9. Mikkila V, Rasanen L, Raitakari OT, Pietinen P, Viikari J. Consistent dietary patterns identified from 359
childhood to adulthood: the cardiovascular risk in Young Finns Study. Br J Nutr 2005;93:923-931. 360
10. Northstone K, Emmett PM. Are dietary patterns stable throughout early and mid-childhood? A birth 361
cohort study. Br J Nutr 2008;100:1069-1076. 362
11. Jones RA, Hinkley T, Okely AD, Salmon J. Tracking physical activity and sedentary behavior in 363
childhood: a systematic review. Am J Prev Med 2013;44:651-658. 364
12. Lioret S, Betoko A, Forhan A, Charles MA, Heude B, de Lauzon-Guillain B. Dietary patterns track from 365
infancy to preschool age: cross-sectional and longitudinal perspectives. J Nutr 2015;145:775-782. 366
13. Okubo H, Crozier SR, Harvey NC, Godfrey KM, Inskip HM, Cooper C, et al. Diet quality across early 367
childhood and adiposity at 6 years: the Southampton Women's Survey. Int J Obes (Lond) 368
2015;39:1456-1462. 369
14. te Velde SJ, van Nassau F, Uijtdewilligen L, van Stralen MM, Cardon G, De Craemer M, et al. Energy 370
balance-related behaviours associated with overweight and obesity in preschool children: a 371
systematic review of prospective studies. Obes Rev 2012;13 Suppl 1:56-74. 372
15. Jago R, Baranowski T, Baranowski JC, Thompson D, Greaves KA. BMI from 3-6 y of age is predicted 373
by TV viewing and physical activity, not diet. Int J Obes (Lond) 2005;29:557-564. 374
16. Pagani LS, Fitzpatrick C, Barnett TA, Dubow E. Prospective associations between early childhood 375
television exposure and academic, psychosocial, and physical well-being by middle childhood. Arch 376
Pediatr Adolesc Med 2010;164:425-431.
17. Downing KL, Hnatiuk J, Hesketh KD. Prevalence of sedentary behavior in children under 2years: A 378
systematic review. Prev Med 2015;78:105-114. 379
18. Smithers LG, Golley RK, Brazionis L, Lynch JW. Characterizing whole diets of young children from 380
developed countries and the association between diet and health: a systematic review. Nutr Rev 381
2011;69:449-467. 382
19. Mast M, Kortzinger I, Konig E, Muller MJ. Gender differences in fat mass of 5-7-year old children. Int J 383
Obes Relat Metab Disord 1998;22:878-884.
384
20. Timmons BW, Naylor PJ, Pfeiffer KA. Physical activity for preschool children-how much and how? Can 385
J Public Health 2007;98 Suppl 2:S122-134.
386
21. Hinkley T, Crawford D, Salmon J, Okely AD, Hesketh K. Preschool children and physical activity: a 387
review of correlates. Am J Prev Med 2008;34:435-441. 388
22. Heude B, Forhan A, Slama R, Douhaud L, Bedel S, Saurel-Cubizolles MJ, et al. Cohort Profile: The 389
EDEN mother-child cohort on the prenatal and early postnatal determinants of child health and 390
development. Int J Epidemiol 2015 Aug 17. pii: dyv151. [Epub ahead of print]. 391
23. Houtkooper LB, Lohman TG, Going SB, Hall MC. Validity of bioelectric impedance for body 392
composition assessment in children. J Appl Physiol (1985) 1989;66:814-821. 393
24. Slaughter MH, Lohman TG, Boileau RA, Horswill CA, Stillman RJ, Van Loan MD, et al. Skinfold 394
equations for estimation of body fatness in children and youth. Hum Biol 1988;60:709-723. 395
25. Goran MI, Driscoll P, Johnson R, Nagy TR, Hunter G. Cross-calibration of body-composition techniques 396
against dual-energy X-ray absorptiometry in young children. Am J Clin Nutr 1996;63:299-305. 397
26. De Craemer M, Lateva M, Iotova V, De Decker E, Verloigne M, De Bourdeaudhuij I, et al. Differences 398
in energy balance-related behaviours in European preschool children: the ToyBox-study. PLoS One 399
2015;10:e0118303. 400
27. Carson V, Spence JC. Seasonal variation in physical activity among children and adolescents: a review. 401
Pediatr Exerc Sci 2010;22:81-92.
402
28. Botton J, Scherdel P, Regnault N, Heude B, Charles MA. Postnatal weight and height growth modeling 403
and prediction of body mass index as a function of time for the study of growth determinants. Ann 404
Nutr Metab 2014;65:156-166.
405
29. Camara S, de Lauzon-Guillain B, Heude B, Charles MA, Botton J, Plancoulaine S, et al. 406
Multidimensionality of the relationship between social status and dietary patterns in early childhood: 407
longitudinal results from the French EDEN mother-child cohort. Int J Behav Nutr Phys Act 408
2015;12:122. 409
30. LeBlanc AG, Spence JC, Carson V, Connor Gorber S, Dillman C, Janssen I, et al. Systematic review of 410
sedentary behaviour and health indicators in the early years (aged 0-4 years). Appl Physiol Nutr 411
Metab 2012;37:753-772.
412
31. Klesges RC, Shelton ML, Klesges LM. Effects of television on metabolic rate: potential implications for 413
childhood obesity. Pediatrics 1993;91:281-286. 414
32. Bryant MJ, Lucove JC, Evenson KR, Marshall S. Measurement of television viewing in children and 415
adolescents: a systematic review. Obes Rev 2007;8:197-209. 416
33. Rey-Lopez JP, Vicente-Rodriguez G, Biosca M, Moreno LA. Sedentary behaviour and obesity 417
development in children and adolescents. Nutr Metab Cardiovasc Dis 2008;18:242-251. 418
34. Zimmerman FJ, Bell JF. Associations of television content type and obesity in children. Am J Public 419
Health 2010;100:334-340.
420
35. Lioret S, Touvier M, Lafay L, Volatier JL, Maire B. Dietary and physical activity patterns in French 421
children are related to overweight and socioeconomic status. J Nutr 2008;138:101-107. 422
36. Gubbels JS, van Assema P, Kremers SP. Physical Activity, Sedentary Behavior, and Dietary Patterns 423
among Children. Curr Nutr Rep 2013;2:105-112. 424
37. Marinelli M, Sunyer J, Alvarez-Pedrerol M, Iniguez C, Torrent M, Vioque J, et al. Hours of television 425
viewing and sleep duration in children: a multicenter birth cohort study. JAMA Pediatr 426
2014;168:458-464. 427
38. Reilly JJ, Armstrong J, Dorosty AR, Emmett PM, Ness A, Rogers I, et al. Early life risk factors for 428
obesity in childhood: cohort study. BMJ 2005;330:1357. 429
39. Scharf RJ, DeBoer MD. Sleep timing and longitudinal weight gain in 4- and 5-year-old children. Pediatr 430
Obes 2015;10:141-148.
431
40. Plancoulaine S, Lioret S, Regnault N, Heude B, Charles MA. Gender-specific factors associated with 432
shorter sleep duration at age 3 years. J Sleep Res 2015;24:610-620. 433
41. Brown A. Media use by children younger than 2 years. Pediatrics 2011;128:1040-1045. 434
42. Strasburger VC. Children, adolescents, obesity, and the media. Pediatrics 2011;128:201-208. 435
43. Tremblay MS, Leblanc AG, Carson V, Choquette L, Connor Gorber S, Dillman C, et al. Canadian 436
Sedentary Behaviour Guidelines for the Early Years (aged 0-4 years). Appl Physiol Nutr Metab 437
2012;37:370-391. 438
44. Department of Health. Australia’s Physical Activity and Sedentary Behaviour Guidelines. 2009. 439
Available from: http://www.health.gov.au/internet/main/publishing.nsf/Content/health-pubhlth-440
strateg-phys-act-guidelines#npa05. 441
45. Carson V, Kuzik N, Hunter S, Wiebe SA, Spence JC, Friedman A, et al. Systematic review of sedentary 442
behavior and cognitive development in early childhood. Prev Med 2015;78:115-122. 443
46. Brown WH, Pfeiffer KA, McIver KL, Dowda M, Addy CL, Pate RR. Social and environmental factors 444
associated with preschoolers' nonsedentary physical activity. Child Dev 2009;80:45-58. 445
47. Burdette HL, Whitaker RC, Daniels SR. Parental report of outdoor playtime as a measure of physical 446
activity in preschool-aged children. Arch Pediatr Adolesc Med 2004;158:353-357. 447
48. Cleland V, Timperio A, Salmon J, Hume C, Baur LA, Crawford D. Predictors of time spent outdoors 448
among children: 5-year longitudinal findings. J Epidemiol Community Health 2010;64:400-406. 449
49. Institute of Medicine of the National Academies. Early Childhood Obesity Prevention Policies. 450
Washington (DC), US: The National Academies Press., 2001. 451
50. Department of Health and Ageing. Get up and grow: Healthy eating and physical activity for early 452
childhood. Commonwealth of Australia, 2009. Available from: 453
https://www.health.gov.au/internet/main/publishing.nsf/Content/2CDB3A000FE57A4ECA257BF00 454
01916EC/$File/HEPA%20-%20B5%20Book%20-%20Staff%20and%20Carer%20Book_LR.pdf. 455
51. Department of Health, Physical Activity, Health Improvement and Protection. Start Active, Stay Active: 456
A report on physical activity for health from home countries' Chief Medical Officers, 2011. 457
52. Hesketh KD, Hinkley T, Campbell KJ. Children's physical activity and screen time: qualitative 458
comparison of views of parents of infants and preschool children. Int J Behav Nutr Phys Act 459
2012;9:152. 460
53. Sallis JF. Age-related decline in physical activity: a synthesis of human and animal studies. Med Sci 461
Sports Exerc 2000;32:1598-1600.
462
54. Johnson L, Mander AP, Jones LR, Emmett PM, Jebb SA. Energy-dense, low-fiber, high-fat dietary 463
pattern is associated with increased fatness in childhood. Am J Clin Nutr 2008;87:846-854. 464
55. Noethlings U, Hoffmann K, Bergmann MM, Boeing H. Portion size adds limited information on variance 465
in food intake of participants in the EPIC-Potsdam study. J Nutr 2003;133:510-515. 466
56. Newby PK, Tucker KL. Empirically derived eating patterns using factor or cluster analysis: a review. 467
Nutr Rev 2004;62:177-203.
468
57. Ambrosini GL. Childhood dietary patterns and later obesity: a review of the evidence. Proc Nutr Soc 469
2014;73:137-146. 470
58. Lioret S, Touvier M, Dubuisson C, Dufour A, Calamassi-Tran G, Lafay L, et al. Trends in child 471
overweight rates and energy intake in France from 1999 to 2007: relationships with socioeconomic 472
status. Obesity (Silver Spring) 2009;17:1092-1100. 473
59. Chardon O, Guignon N, de Saint Pol T. La santé des élèves de grande section de maternelle en 2013: des 474
inégalités sociales dès le plus jeune âge. Etudes et résultats. Direction de la recherche, des études, 475
de l'évaluation et des statistiques 2015;0920.
476
60. Cole TJ, Bellizzi MC, Flegal KM, Dietz WH. Establishing a standard definition for child overweight and 477
obesity worldwide: international survey. Br Med J 2000;320:1240-1243. 478
479 480 481 482
Figure 1: Flow diagram for selection of children a
Non-reponses to 1 or 2 questions regarding outdoor play and/or screen time were imputed (see methods); b
Table 1. Children’s characteristics, by gender (values are percentages (numbers) unless stated otherwise). The EDEN mother-child cohort.
Boys (n=473) Girls (n=410) P
Variables at inclusion or birth
Maternal education
Did not complete high school 20.1 (95) 18.5 (76) 0.84
High school diploma 17.8 (84) 17.1 (70)
2-year university degree 26.0 (123) 25.4 (104)
≥ 3-year university degree 36.1 (171) 39.0 (160)
Household income, €/month
≤ 1500 11.6 (55) 9.7 (40) 0.51 1501 to 2300 28.8 (136) 27.1 (111) 2301 to 3000 32.4 (153) 31.0 (127) 3001 to 3800 15.4 (73) 19.5 (80) > 3800 11.8 (56) 12.7 (52) Centre Nancy 56.0 (265) 49.8 (204) 0.06 Poitiers 44.0 (208) 50.2 (206)
Maternal age at delivery (y), mean(SD) 30.2 (4.7) 30.1 (4.8) 0.77
Birth weight (g), mean (SD) 3357 (526) 3218 (482) <0.001
Children's characteristics at age 2 years
Screen time, min/day
≤15 33.8 (160) 34.6 (142) 0.43
>15 to <60 31.3 (148) 34.4 (141)
≥60 34.9 (165) 31.0 (127)
Outdoor play timea
Low (Tertile 1) 28.5 (135) 38.3 (157) 0.003
Medium (Tertile 2) 34.0 (161) 33.2 (136)
High (Tertile 3) 37.4 (177) 28.5 (117)
"Processed, fast food" dietary pattern scores, mean (SD) -0.03 (0.96) -0.04 (0.96) 0.80
"Guidelines" dietary pattern scores, mean (SD) -0.02 (0.93) 0.10 (0.97) 0.080
BMI (kg/m²)b, mean (SD) 17.3 (1.9) 17.5 (2) 0.048
Children's characteristics at age 5 years
BMI (kg/m²) mean (SD) 15.4 (1.3) 15.4 (1.4) 0.74
Prevalence of overweight (including obesity)c 5.7 (27) 9.8 (40) 0.024
Percentage of body fatd, mean (SD) 12.6 (2.9) 16.7 (3.2) <0.001
a
Ranges for outdoor play time categories. Low (Tertile 1): spring (9 min to 1 h 23 min), summer (23 min to 1 h 58 min), autumn (4 min to 1 h 12 min), winter (0 min to 50 min). Intermediate (Tertile 2): spring (1 h 24 min to 2 h 15 min), summer (1 h 59 min to 2h 55 min), autumn (1 h 13 min to 1 h 58 min), winter (51 min to 1 h 18 min). High (Tertile 3): spring (2 h 16 min to 6 h), summer (2 h 56 min to 6 h 34 min), autumn (1 h 59 min to 6 h), winter (1 h 19 min to 4 h 09 min).
b
Predicted BMI based on Jenss’ nonlinear model28 (see methods). c
International Obesity Task Force cut-off.60 d
Table 2. Associations between dietary patterns scoresa and both outdoor play and screen times (values are linear regression coefficients (95% CI))b. The EDEN mother-child cohort
Boys (n=473) Girls (n=410) "Processed, fast food" dietary pattern scores “Guidelines" dietary pattern scores "Processed, fast food" dietary pattern scores "Guidelines" dietary pattern scores Outdoor play timec
Low (Tertile 1) ref ref ref ref
Intermediate (Tertile 2) 0.10 (-0.11, 0.31) 0.08 (-0.13, 0.29) -0.04 (-0.25, 0.18) -0.08 (-0.30, 0.14) High (Tertile 3) 0.22 (0.01, 0.43) -0.04 (-0.24, 0.17) 0.24 (0.00, 0.47) 0.41 (0.17, 0.64) P 0.12 0.52 0.052 0.0002
Screen time (min/day)
≤15 ref ref ref ref
>15 to <60 0.03 (-0.18, 0.23) 0.05 (-0.16, 0.26) 0.23 (0.01, 0.44) 0.07 (-0.16, 0.30) ≥60 0.38 (0.18, 0.58) 0.06 (-0.15, 0.26) 0.17 (-0.07, 0.40) -0.05 (-0.29, 0.19) P 0.0002 0.83 0.12 0.60 a
Scores for each pattern were calculated at the individual level by summing the observed standardized frequencies of consumption per food group, weighted according to the PCA loadings.
b
Linear regression analyses were undertaken including outdoor play and screen time in separate models. All models adjusted for centre (Poitiers or Nancy) and SEP variables (maternal education and household income).
c
Ranges for outdoor play time categories. Low (Tertile 1): spring (9 min to 1 h 23 min), summer (23 min to 1 h 58 min), autumn (4 min to 1 h 12 min), winter (0 min to 50 min). Intermediate (Tertile 2): spring (1 h 24 min to 2 h 15 min), summer (1 h 59 min to 2 h 55 min), autumn (1 h 13 min to 1 h 58 min), winter (51 min to 1 r 18 min). High (Tertile 3): spring (2 h 16 min to 6 h), summer (2 h 56 min to 6 h 34 min), autumn (1 h 59 min to 6 h), winter (1 h 19 min to 4 h 09 min).
Table 3. Associations between EBRBs at age 2 and adiposity at age 5 (values are linear regression coefficients (95% CI)). The EDEN mother-child cohort. Boys (n=473) Girls (n=410) %BFb BMI %BFb BMI Separate modelsc Fully-adjusted modeld Separate modelsc Fully-adjusted modeld Separate modelsc Fully-adjusted modeld Separate modelsc Fully-adjusted modeld
Outdoor play time (min/d)e
Low (Tertile 1) ref ref ref ref ref ref ref ref
Intermediate (Tertile 2) -0.31 (-0.82, 0.19) -0.33 (-0.84, 0.18) 0.02 (-0.04, 0.31) 0.02 (-0.16, 0.20) 0.27 (-0.31, 0.85) 0.26 (-0.34, 0.85) 0.05 (-0.15, 0.24) 0.06 (-0.14, 0.27) High (Tertile 3) -0.11 (-0.61, 0.39) -0.14 (-0.64, 0.37) 0.13 (-0.16, 0.19) 0.14 (-0.03, 0.32) -0.89 (-1.50, -0.28) -0.93 (-1.58, -0.28) -0.09 (-0.30, 0.11) -0.06 (-0.28, 0.16) P 0.46 0.43 0.25 0.21 0.001 0.002 0.43 0.55
Screen time (min/d)
≤15 ref ref ref ref ref ref ref ref
>15 to <60 0.25 (-0.25, 0.74) 0.25 (-0.25, 0.74) 0.08 (-0.10, 0.25) 0.08 (-0.09, 0.26) 0.33 (-0.27, 0.93) 0.26 (-0.34, 0.86) 0.11 (-0.09, 0.31) 0.08 (-0.12, 0.29) ≥60 0.48 (0.00, 0.96) 0.51 (0.02, 1.01) 0.002 (-0.17, 0.17) 0.04 (-0.14, 0.21) 0.14 (-0.48, 0.76) 0.06 (-0.58, 0.70) 0.07 (-0.14 0.28) 0.04 (-0.18, 0.26) P 0.053f 0.045f 0.62 0.65 0.55 0.68 0.56 0.72
Dietary patterns (scores)
"Processed, fast-food" 0.04 (-0.17, 0.25) 0.02 (-0.20, 0.25) -0.04 (-0.11, 0.04) -0.04 (-0.11, 0.04) 0.15 (-0.10, 0.41) 0.19 (-0.08, 0.46) 0.07 (-0.02, 0.16) 0.08 (-0.01, 0.17) P 0.690 0.829 0.324 0.364 0.244 0.176 0.106 0.099 "Guidelines" -0.02 (-0.23, 0.20) 0.00 (-0.22, 0.22) 0.01 (-0.08, 0.07) -0.01 (-0.09, 0.07) -0.31 (-0.57, -0.06) -0.21 (-0.47, 0.06) -0.08 (-0.17, 0.01) -0.07 (-0.16, 0.02) P 0.87 0.97 0.90 0.81 0.017 0.12 0.067 0.12 a
Energy balance-related behaviors. b
Body fat percentage measured and calculated based on Goran’s equation.25 c
Screen time, outdoor play and dietary patterns were included in three separate models, which adjusted for center (Poitiers or Nancy), baseline BMI and exact age at the age 5 clinical examination.
d
The three EBRBs were included simultaneously along with the SEP variables (maternal education and household income). All models adjusted for center (Poitiers or Nancy), baseline BMI and exact age at the age 5 clinical examination.
e
Ranges for outdoor play time categories. Low (Tertile 1): spring (9 min to 1 h 23 min), summer (23 min to 1 h 58 min), autumn (4 min to 1 h 12 min), winter (0 min to 50 min). Intermediate (Tertile 2): spring (1 h 24 min to 2 h 15 min), summer (1 h 59 min to 2 h 55 min), autumn (1 h 13 min to 1 h 58 min), winter (51 min to 1 r 18 min). High (Tertile 3): spring (2 h 16 min to 6 h), summer (2 h 56 min to 6 h 34 min), autumn (1 h 59 min to 6 h), winter (1 h 19 min to 4 h 09 min).
f
Supplementary Table 1. Associations between EBRBs at age 2 and adiposity at age 5 (values are linear regression coefficients (95% CI)). The EDEN mother-child cohort.
Boys (n=473) Girls (n=410)
%BFb from Slaughter %BFb from Houtkooper %BFb from Slaughter %BFb from Houtkooper
Separate modelsc Fully-adjusted modeld Separate modelsc Fully-adjusted modeld Separate modelsc Fully-adjusted modeld Separate modelsc Fully-adjusted modeld
Outdoor play time (min/d)e
Low (Tertile 1) ref ref ref ref ref ref ref ref
Intermediate (Tertile 2) -0.28 (-0.81, 0.24) -0.34 (-0.61, 0.44) -0.48 (-1.37, 0.42) -0.47 (-1.38, 0.43) 0.35 (-0.23, 0.94) 0.34 (-0.26, 0.93) 0.04 (-0.89, 0.97) 0.003 (-0.94, 0.95) High (Tertile 3) -0.03 (-0.55, 0.49) -0.08 (-0.87, 0.20) -0.45 (-1.32, 0.43) -0.46 (-1.35, 0.43) -0.61 (-1.22, -0.01) -0.72 (-1.37, -0.06) -1.68 (-2.66, -0.71) -1.63 (-2.66, -0.59) P 0.49 0.42 0.51 0.51 0.010 0.007 0.001 0.003
Screen time (min/d)
≤15 ref ref ref ref ref ref ref ref
>15 to <60 0.24 (-0.27, 0.76) 0.25 (-0.27, 0.77) 0.33 (-0.55, 1.20) 0.32 (-0.56, 1.19) -0.03 (-0.62, 0.56) -0.13 (-0.73, 0.47) 1.14 (0.19, 2.09) 1.15 (0.19, 2.10) ≥60 0.50 (0.00, 1.00) 0.51 (-0.01, 1.02) 0.74 (-0.11, 1.58) 0.77 (-0.10, 1.65) -0.09 (-0.70, 0.52) -0.21 (-0.84, 0.43) 0.74 (-0.24, 1.72) 0.80 (-0.21, 1.81) P 0.052f 0.045f 0.089f 0.083f 0.96 0.81 0.058 0.057
Dietary patterns (scores)
"Processed, fast-food" 0.06 (-0.15, 0.28) 0.02 (-0.21, 0.25) 0.06 (-0.31, 0.43) 0.06 (-0.33, 0.45) 0.15 (-0.11, 0.41) 0.18 (-0.09, 0.45) 0.12 (-0.29, 0.53) 0.17 (-0.26, 0.60) P 0.570 0.873 0.766 0.764 0.250 0.188 0.575 0.428 "Guidelines" -0.02 (-0.25, 0.20) 0.01 (-0.22, 0.24) -0.12 (-0.50, 0.26) -0.11 (-0.50, 0.27) -0.23 (-0.48, 0.03) -0.14 (-0.40, 0.13) -0.50 (-0.91, -0.10) -0.36 (-0.78, 0.06) P 0.83 0.93 0.55 0.56 0.080 0.31 0.016 0.092 a
Energy balance-related behaviors. b
Body fat percentage. c
Screen time, outdoor play and dietary patterns were included in three separate models, which adjusted for center (Poitiers or Nancy), baseline BMI and exact age at the age 5 clinical examination.
d
The three EBRBs were included simultaneously along with the SEP variables (maternal education and household income). All models adjusted for center (Poitiers or Nancy), baseline BMI and exact age at the age 5 clinical examination.
e
Ranges for outdoor play time categories. Low (Tertile 1): spring (9 min to 1 h 23 min), summer (23 min to 1 h 58 min), autumn (4 min to 1 h 12 min), winter (0 min to 50 min). Intermediate (Tertile 2): spring (1 h 24 min to 2 h 15 min), summer (1 h 59 min to 2 h 55 min), autumn (1 h 13 min to 1 h 58 min), winter (51 min to 1 r 18 min). High (Tertile 3): spring (2 h 16 min to 6 h), summer (2 h 56 min to 6 h 34 min), autumn (1 h 59 min to 6 h), winter (1 h 19 min to 4 h 09 min).
f
Supplementary Table 2. Associations between EBRBsa at age 2 and adiposity at age 5 in the sample with complete case data (values are linear regression coefficients (95% CI)). The EDEN mother-child cohort. Boys (n=411) Girls (n=345) %BFb %BFb Separate modelsc Fully-adjusted modeld Separate modelsc Fully-adjusted modeld Outdoor play time (min/d)e
Low (Tertile 1) ref ref ref ref
Intermediate (Tertile 2) -0.25 (-0.79, 0.30) -0.24 (-0.79, 0.31) 0.29 (-0.36, 0.94) 0.32 (-0.34, 0.98) High (Tertile 3) -0.14 (-0.68, 0.40) -0.13 (-0.68, 0.42) -1.00 (-1.67, -0.33) -1.05 (-1.77, -0.34) P 0.671 0.69 0.001 0.001
Screen time (min/d)
≤15 ref ref ref ref
>15 to <60 0.29 (-0.25, 0.83) 0.29 (-0.25, 0.84) 0.33 (-0.34, 1.01) 0.20 (-0.48, 0.88) ≥60 0.54 (0.03, 1.06) 0.60 (0.07, 1.13) -0.04 (-0.73, 0.66) -0.20 (-0.92, 0.52) P 0.042f 0.028f 0.49 0.52
Dietary patterns (scores)
"Processed, fast-food" -0.0002 (-0.22, 0.22) -0.01 (-0.24, 0.23) 0.11 (-0.18, 0.40) 0.15 (-0.51, 0.08) P 0.999 0.951 0.444 0.317 "Guidelines" -0.04 (-0.28, 0.19) -0.03 (-0.27, 0.20) -0.33 (-0.62, -0.05) -0.21 (-1.36, -0.18) P 0.72 0.79 0.023 0.16 a
Energy balance-related behaviors. b
Body fat percentage measured and calculated based on Goran’s equation.25 c
Screen time, outdoor play and dietary patterns were included in three separate models, which adjusted for center (Poitiers or Nancy), baseline BMI and exact age at the age 5 clinical examination.
d
The three EBRBs were included simultaneously along with the SEP variables (maternal education and household income). All models adjusted for center (Poitiers or Nancy), baseline BMI and exact age at the age 5 clinical examination.
e
Ranges for outdoor play time categories. Low (Tertile 1): spring (9 min to 1 h 23 min), summer (23 min to 1 h 58 min), autumn (4 min to 1 h 12 min), winter (0 min to 50 min). Intermediate (Tertile 2): spring (1 h 24 min to 2 h 15 min), summer (1 h 59 min to 2 h 55 min), autumn (1 h 13 min to 1 h 58 min), winter (51 min to 1 r 18 min). High (Tertile 3): spring (2 h 16 min to 6 h), summer (2 h 56 min to 6 h 34 min), autumn (1 h 59 min to 6 h), winter (1 h 19 min to 4 h 09 min).
f