HAL Id: hal-01395980
https://hal.archives-ouvertes.fr/hal-01395980
Submitted on 13 Nov 2016
HAL is a multi-disciplinary open access
archive for the deposit and dissemination of
sci-entific research documents, whether they are
pub-lished or not. The documents may come from
teaching and research institutions in France or
abroad, or from public or private research centers.
L’archive ouverte pluridisciplinaire HAL, est
destinée au dépôt et à la diffusion de documents
scientifiques de niveau recherche, publiés ou non,
émanant des établissements d’enseignement et de
recherche français ou étrangers, des laboratoires
publics ou privés.
Is there any relationship between physical activity level
and patterns, and physical performance in children?
Aurélie Blaes, Georges Baquet, Claudine Fabre, Emmanuel van Praagh, Serge
Berthoin
To cite this version:
Aurélie Blaes, Georges Baquet, Claudine Fabre, Emmanuel van Praagh, Serge Berthoin. Is there
any relationship between physical activity level and patterns, and physical performance in children?.
International Journal of Behavioral Nutrition and Physical Activity, BioMed Central, 2011, 8, pp.122
- 122. �10.1249/MSS.0b013e3181824d98�. �hal-01395980�
R E S E A R C H
Open Access
Is there any relationship between physical activity
level and patterns, and physical performance in
children?
Aurélie Blaes
1†, Georges Baquet
1*†, Claudine Fabre
1†, Emmanuel Van Praagh
2†and Serge Berthoin
1†Abstract
Background: It is often assumed that physical activity (PA) and physical performance during childhood and adolescence are beneficial for health during adulthood, but a positive relationship between PA and physical performance has not been precisely clarified in children. The lack or the weakness of the relationships between PA and physical performance could be due to the measure of PA. If the use of accelerometry is considered as an objective and common measure of PA, the real patterns of children’s habitual PA must be reflected. The aim of this study was to investigate the relationship between the levels and patterns of PA assessed with high frequency accelerometry and physical performance in young children.
Methods: Eighty-six boys and 101 girls aged 6-12 years participated in this study. Physical activity was measured over a 7-day period, using a 5-s epoch. Physical performance was assessed by means of EUROFIT tests
(anthropometrics, standing broad jump, the 10 × 5 meter shuttle run, the sit-and-reach, the handgrip, the number of sit-ups in 30 seconds, the 20-meter shuttle run).
Results: No relationship was found between PA and physical performance. In boys only, body fatness was negatively associated with vigorous PA (r = -0.38, p < 0.001) and very high PA (r = -0.35, p < 0.01), in contrast to light PA (r = 0.28, p < 0.01), which was positively related to body fatness.
Conclusion: In 6- to- 12 year- old children, the more active children were not the fittest. Our results also underline the need for uniformity in approach to measurement of PA, body composition and health-related fitness between studies.
Background
It is well established that physical activity (PA) is an important health determinant in young people. Sirard and Pate [1] reported an inverse relationship between PA and chronic diseases such as obesity, cancer, ische-mia and coronary disease. Active children appear to be engaged in a sufficient variety of activities that enhance multiple components of health-related fitness [2]. The literature shows that a physically active lifestyle during childhood and adolescence may decrease the risk of hav-ing health problems durhav-ing adulthood and that more active children tend to be more active adults [3,4].
Thus, it is often assumed that PA and physical perfor-mance during childhood and adolescence are beneficial for health during adulthood [5], but a positive relation-ship between PA and physical performance has not been precisely clarified in children [6,7]. Although Katz-marzyk et al. [8] have reported a significant relationship between PA and health-related physical performance, they noticed that a large part of the variability (80-90%) in performance is not accounted for by PA. The dose-response relationship between physical activity and per-formance and health during childhood remains incom-plete and is not fully understood [9]. The lack or the weakness of the relationships between PA and physical performance could be due to the measure of PA. From an observational study, Bailey et al. [10] have provided objective evidence on the highly transitory nature of children’s PA. Thus questionnaires or monitoring
* Correspondence: [email protected] † Contributed equally
1
University of Lille Nord de France, UDSL, EA 4488, Physical Activity - Muscle - Health, Lille, France
Full list of author information is available at the end of the article
© 2011 Blaes et al; licensee BioMed Central Ltd. This is an Open Access article distributed under the terms of the Creative Commons Attribution License (http://creativecommons.org/licenses/by/2.0), which permits unrestricted use, distribution, and reproduction in any medium, provided the original work is properly cited.
children’s PA with a 1-min sampling do not reflect the real patterns of children’s physical activity. The use of accelerometry is considered as an objective (frequency, intensity and duration) and common measure of chil-dren’s habitual PA [11]. Using such a device with a 2-s epoch, Baquet et al. [12] demonstrated that the mean PA bout duration lasted about 20s and that 95% of high intensity activities lasted less than 10s with a median duration of 4s. Moreover, if vigorous and very high intensity activity bouts represented 2.4% of the daily PA, they accounted for 36.1 ± 5.8% of the amount of the total daily PA. Thus, monitoring with a 1-min epoch does not discriminate between high and very high inten-sity PA that can be related to physical performance.
Thus, to assess in detail the PA patterns in children, a high frequency monitoring is needed [12,13]. These studies have reported the nature of children’s sponta-neous activity patterns, but not their impact on health outcomes and physical performance. In adults, Murphy et al. [14] reported that, at least for aerobic fitness, accumulated and continuous patterns of exercise train-ing of the same total duration confer similar benefits. In boys, Stone et al. [15] showed that the frequency of short bouts of PA were strongly related with health than longer bouts and reported a significant relation-ship between PA patterns and peak of oxygen uptake. However, to our knowledge, it is not known if PA pat-terns (frequency, intensity and duration) are related to other physical performance in boys and in girls. Some physical performances (speed, explosive strength) could be related with PA bout frequency and intensity and other (aerobic fitness) with PA bout duration. Therefore, the purpose of the present study was to investigate the relationship between PA level (time spent in different PA intensity), PA patterns (number of bouts of PA according to their duration and inten-sity) and physical performance level in 6- to 12- year-old children, through high frequency accelerometry monitoring.
Methods Participants
At the beginning, two hundred and fourteen children (98 boys and 116 girls), aged 6 to 12, participated in this study. The children were taken from 16 elementary classes in the North of France. Full advice about possi-ble risks and discomfort with the protocol was given to the children and their parents. All children gave their assent to take part in the study and all parents signed a written informed consent. The study was designed in accordance with the ethical standards of the Helsinki Declaration of 2008, and received approval of the local “Consultative Committee for the Protection of Persons in Biomedical Research”.
Anthropometry
Height was measured to the nearest 0.1 cm with a wall stadiometer (Vivioz medical, Paris, France). Body mass was measured to the nearest 0.1 kg with a calibrated electronic balance (Tanita TBF 543, Tanita Inco, Iokyo, Japan). Waist and hip circumferences were measured with the subjects in a standing position with a non-elas-tic measuring tape. Waist circumference was measured at the midpoint between the lower border of the rib cage and the iliac crest, and hip circumference was mea-sured at the widest part of the hip region. The waist/hip (W/H) ratio was then calculated. Percentage of body fat was estimated from skinfold (SF) thickness (0.1 mm). Measurements were assessed with a Harpenden caliper (Harpenden Inc.) at two sites (Triceps, and Calf). According to Slaughter et al. [16], the equations were: Estimated percentage of body fat = 0.735 (∑SF) + 1.0 and percentage of body fat = 0.61 (∑SF) + 5.0, for boys and girls, respectively.
Physical Performance Assessment
Prior to participating in the study, the children were fully familiarized with the testing procedures. The chil-dren performed seven field tests from the European Physical Fitness (EUROFIT) test battery. According to EUROFIT test battery recommendations [17], anthropo-metrics (hip and waist circumferences, percentage of body fat, height and weight) were included in the EUROFIT items. This battery was developed between 1976 and 1986 due to an initiative of the European Council. The goals of this battery were to establish stan-dardized tests in Europe to help teachers to assess the physical performance of their pupils in schools and to help in measuring the health-related performance of the population. To comply with EUROFIT standards, the recommendations of the Committee of Experts on Sports Research [17] were followed. Mahoney and Bore-ham [18] reported that the EUROFIT tests were repro-ducible in primary schools (113 children, 7 to 11 yrs-old, with a one month-interval assessment). The tests were the standing broad jump (SBJ, explosive strength, in cm), the 10 × 5 meter shuttle run (SHR, speed and agility, in s), the sit-and-reach (SAR, flexibility, in cm), the handgrip (HG, static strength, in kgf), the number of sit-ups in 30 seconds (SUP, abdominal muscular power), the 20-meter shuttle run (20-MST, maximal aerobic power, in km.h-1). Sixty randomly selected children (30 boys and 30 girls) performed the 20-m shuttle run test with continuous heart rate (HR) monitoring (Polar Accurex+, Finland) to assess the maximality of the test (Table 1). A HR value above 195 bpm was accepted as a maximal index, associated with visible exhaustion [19].
As recommended by the EUROFIT guidelines, the subjects performed the tests in the following order: SBJ,
Blaes et al. International Journal of Behavioral Nutrition and Physical Activity 2011, 8:122 http://www.ijbnpa.org/content/8/1/122
SHR, SAR, HG, SUP and 20-MST. Each test was sepa-rated by at least 15-min. Testing was completed by all participants over one week.
Physical Activity Assessment
Children’s physical activity was assessed using an uniaxial accelerometer, over a 7-day consecutive period (The Acti-graph, Manufacturing Technologies, Inc., model 7164, Fort Walton Beach, FL). Only the children who completed at least a 6-day monitoring were included for further ana-lysis. The Actigraph accelerometer facilitates the quantifi-cation of human motion (frequency and intensity) over a user-specified time interval called an epoch. The accelera-tion signal is digitized and the magnitude is summed over the epoch. At the end of each epoch duration, the summed value or activity“count” is stored in memory, and the integrator is reset. For this study, the epoch dura-tion was set at 5-s, and data between 7 am and 9 pm were retained to subsequent analysis. The Actigraph used in this study has been shown to be a valid and reliable tool for quantifying PA in children [20].
To maximize the quality of the data, strategies were employed to encourage children compliance. Children received oral and written information to use the acceler-ometers comfortably: they wore the acceleracceler-ometers on the right hip fastened with an elastic belt from waking up until bedtime. The accelerometer was removed dur-ing bathdur-ing and swimmdur-ing. The investigators demon-strated to the parents and children, how to wear the device properly and reminded parents and children of the importance of not forgetting to wear it.
All the files were visually inspected to delete missing data. If the child had forgotten the device at any time of the day (morning, afternoon and evening), the file was rejected. A sequence of 120 zero counts (10 min record-ing) was defined as the level of missing data [21]. The 5-s activity counts were uploaded to an Excel© macro to calculate the time spent below and above different PA thresholds, corresponding to light (LPA < 3 METs), moderate (MPA, 3≤ MPA < 6 METs), vigorous (VPA, 6 ≤ VPA < 9 METs) and very high PA (VHPA ≥ 9 METs). The Actigraph outputs of 162, 440 and 790 counts per 5s were the cut-offs used to define 3, 6 and 9 METs, respectively [22]. Times spent below and above the different intensity thresholds were calculated for each of the 7 days. To examine continuous PA behavior patterns, the daily number of PA bouts of various dura-tions [from 5 to 15s], [from 16 to 30s], [31 to 60s], [61 to 180s], [181 to 300s], [301 to 600s] and [> 600s] were calculated for each intensity level [12].
According to Strong et al. [7], the percentage of chil-dren who reached the PA international guideline (60 accumulated minutes from MPA to VHPA, each day a week) was calculated.
Statistical analysis
The normality distribution of the data was checked using the Kolmogorov-Smirnov test. The experimental values were expressed as mean ± standard deviation (mean ± SD). A Student’s t-test was used to identify dif-ferences between boys and girls in anthropometric data, times spent below and above the different intensity thresholds over time (one week); number of bouts according to their duration and intensity and the EUROFIT performances.
We hypothesized that physical activity would be sig-nificantly associated with physical fitness dimensions as assessed from physical performances. Some of these per-formances (speed, explosive strength) may be related with PA bout frequency and intensity and aerobic per-formance with PA bout duration. Univariate analyses were conducted to examine the relationships between PA, times spent at various PA intensities, and physical performance, using Pearson product moment correla-tions, adjusted for age and percentage of body fat. A multivariate stepwise regression analysis was developed a priori to account for variation for each physical perfor-mance with a correlation significant at a 0.2 p-level. Other PA variables were added to the basic model to determine which model explained the most variance with the fewest number of covariates. When significant relationships were observed between times spent at var-ious PA intensities level and physical performance, rela-tionships with the corresponding activity pattern variables were explored.
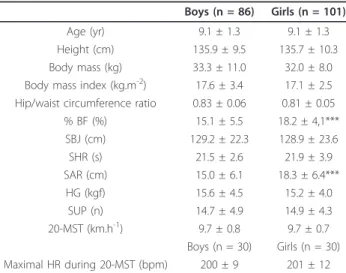
Table 1 Mean ± SD for anthropometric measurements and EUROFIT performances in boys and girls
Boys (n = 86) Girls (n = 101) Age (yr) 9.1 ± 1.3 9.1 ± 1.3 Height (cm) 135.9 ± 9.5 135.7 ± 10.3 Body mass (kg) 33.3 ± 11.0 32.0 ± 8.0 Body mass index (kg.m-2) 17.6 ± 3.4 17.1 ± 2.5 Hip/waist circumference ratio 0.83 ± 0.06 0.81 ± 0.05 % BF (%) 15.1 ± 5.5 18.2 ± 4,1*** SBJ (cm) 129.2 ± 22.3 128.9 ± 23.6 SHR (s) 21.5 ± 2.6 21.9 ± 3.9 SAR (cm) 15.0 ± 6.1 18.3 ± 6.4*** HG (kgf) 15.6 ± 4.5 15.2 ± 4.0 SUP (n) 14.7 ± 4.9 14.9 ± 4.3 20-MST (km.h-1) 9.7 ± 0.8 9.7 ± 0.7 Boys (n = 30) Girls (n = 30) Maximal HR during 20-MST (bpm) 200 ± 9 201 ± 12
% BF: percentage of body fat; SBJ: standing broad jump; SHR: 10 × 5 m shuttle run; SAR: sit and reach; HG: handgrip; SUP: number of Sit-ups; 20-MST: 20 meter shuttle run. Maximal HR during 20-MST: maximal heart rate during the 20 m shuttle run test.
Statistical analyses were conducted with Instat 3 (GraphPad software). The threshold for statistical signif-icance was set at p≤ 0.05.
Results
Although investigators and parents reminded children of the importance of wearing their device during the experimental period and tried to complete the measure-ment of physical performance, twenty-seven children (12 boys and 15 girls) were rejected for an incomplete PA data set or for absences in measured physical perfor-mances. One hundred and eighty-seven children (101 girls and 86 boys) were finally retained for the study.
Anthropometry and physical performance
Age, anthropometric data and physical performance are presented in Table 1. The Student’s t-test revealed no sex difference, except for a higher percentage of body fat and a higher flexibility in girls (p < 0.001).
Physical activity
For boys and girls, the daily PA time spent at different intensity levels is presented in Table 2. Girls spent more time in LPA than boys (+17.4 min, p < 0.001), whilst the latter spent more time in MPA (+12.6 min, p < 0.001) and in VPA (+3.5 min,p < 0.01). No sex-related difference was found for time spent in VHPA. Boys (95.3%) were more likely to attain (p < 0.05) the current PA guidelines (i.e. accumulating at least 60 min of mod-erate to vigorous PA per day) than the girls (77.5%).
For the whole population, the mean duration of PA bouts was 95.4 ± 22.2s for LPA, 13.6 ± 2.8s for MPA, 8.3 ± 0.9s for VPA and 6.9 ± 0.7s for VHPA. Girls showed (p < 0.001) longer LPA bouts (100.3 ± 1.6s) than, the boys (89.5 ± 20.8s), while boys showed (p < 0.001) longer MPA bouts (14.8 ± 2.6s) than the girls (12.7 ± 1.6s). No gender difference was found for VPA and VHPA mean duration bouts.
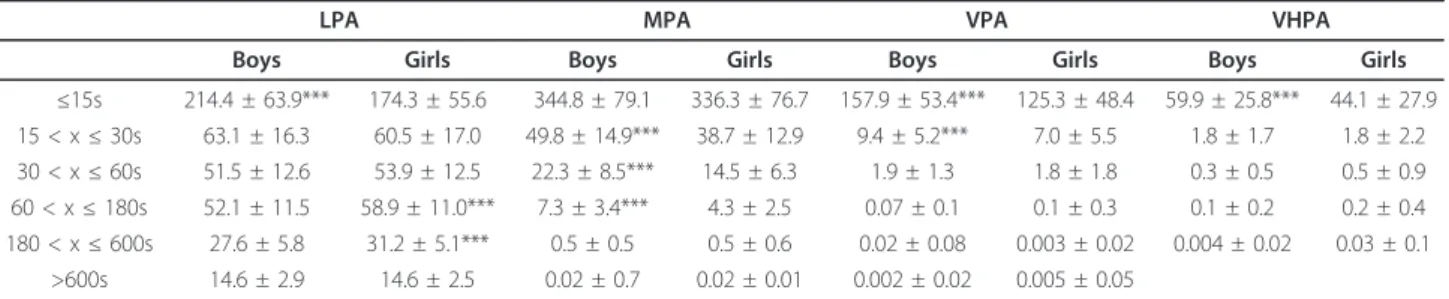
Table 3 displayed the distribution of PA bouts accord-ing to their intensity and duration. As intensity increased from LPA to VHPA, there was a steady decrease in the frequency of bouts as a function of their respective durations. Girls showed significantly more 1-to 10-min LPA bouts than the boys (p < 0.01). Boys pre-sented significantly more 16-s to 3-min MPA bouts (p <
0.001), more VPA bouts inferior to 30-s (p < 0.05) and more VHPA bouts shorter than 15-s (p < 0.001) than the girls.
Relation between physical activity and EUROFIT tests
Relationships between physical performance and times spent at PA intensity levels are presented in Table 4. For girls, no aspect of physical performance was related to PA. In boys, percentage of body fat was positively correlated with LPA (r = 0.28, p < 0.01) and negatively with VPA and VHPA (r = -0.38, p < 0.001 and r = -0.35, p < 0.01, respectively). No relationship was found between time spent in MPA and physical performance.
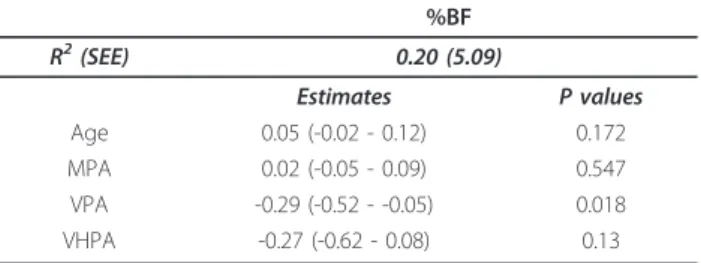
The multivariate stepwise regression analysis was developed to account for variation in percentage of body fat for boys, and, in SUP and 20-MST for girls. Only a significant relationship was found for body fatness in boys (r2 = 0.20, p < 0.01). VPA makes a significant con-tribution to the model, while LPA and MPA provided redundant information. LPA was not included in the model (Table 5).
Relationships between PA patterns and physical per-formance are presented in Table 6. In boys, long bouts of LPA (>600s) were positively related to higher percen-tage of body fat (r = 0.34, p < 0.01), while negative cor-relations were found with short and medium bouts of LPA (5 to 180-s, from r = -0.31, p < 0.01 to r = -0.23, p < 0.05), VPA (5 to 60-s, from r = -0.44, p < 0.001 to r = -0.25, p < 0.05) and VHPA (5 to 60-s, from r = -0.39, p < 0.001 to r = -0.24, p < 0.05. A multivariate stepwise regression analysis was developed to account for varia-tion in percentage of body fat for boys. A significant relationship was found for percentage of body fatness in boys (r2
= 0.26, p < 0.001). Short bouts of VPA (from 5 to 15s) make a significant contribution to the model (Table 7).
Discussion
This study investigated the relationship between physical performance and PA patterns in prepubertal children by means of EUROFIT tests and high frequency accelero-metry measurement. The main finding is that the physi-cal performance was not related to physiphysi-cal activity level in 6- to 12-yr-old children. Only a trivial negative rela-tionship between PA level and body fatness was
Table 2 Mean ± SD for daily times spent at various PA intensity levels between 7 am to 9 pm and percentage of boys and girls who reached the international PA guideline [7]
LPA (min) MPA (min) VPA (min) VHPA (min) ≥60 min MPA to VHPA (%) Boys (n = 86) 745.6 ± 24.4*** 69.5 ± 16.6*** 16.3 ± 6.4** 7.6 ± 3.9 95.3
Girls (n = 101) 763.0 ± 21.1 56.9 ± 14.2 12.8 ± 5.2 6.5 ± 5.4 77.5
LPA: light physical activity; MPA: moderate physical activity; VPA: vigorous physical activity; VHPA: very high physical activity.≥60 min MPA to VHPA (%): percentage of children which accumulated more than 60 min MPA to VHPA.
**: significantly different between genders at p < 0.01; ***: significantly different between genders at p < 0.001.
Blaes et al. International Journal of Behavioral Nutrition and Physical Activity 2011, 8:122 http://www.ijbnpa.org/content/8/1/122
observed in boys with short bouts of VPA (from 5 to 15s) that made a significant contribution in percentage body fat variation as demonstrated by the multivariate analysis.
From childhood to adolescence, the literature has gen-erally shown a weak to moderate relationship between PA and physical performance [23]. We hypothesized that high frequency accelerometry monitoring (5s epoch) should be able to provide a more accurate mea-surement of children PA behaviors, notably to capture short bouts of VPA and VHPA that are generally diluted in PA measurement when accelerometer epoch is set at 1 min. In the current study, no relationship was found between PA and physical performance. As observed in adults [24], these results suggests that habitual activity did not show adequate intensity, volume, and duration to induce positive changes in motor and functional capacities. Indeed, VPA or VHPA are generally consid-ered as the upper boundaries of physical activity domains in the context of health related studies. The cut off used in the present study for VPA and VHPA were derived from counts values associated with veloci-ties of 6.4 km.h-1 (6 METs) and 9.7 km.h-1(9 METs),
respectively. However, these intensities of exercise remain largely lower than those reached in the context of performance. For instance, in the present study, the running velocity associated with 20-MST performance (around 10 km.h-1) was certainly not sustained for suffi-cient long periods to expect an improvement in aerobic fitness. Similarly, a 9.7 km.h-1velocity (VHPA) remained two times lower than a sprint velocity in such a popula-tion that is around 20 km.h-1. Thus, it could be hypothesized that systematic training and not time spent in VPA or VHPA is needed to increase physical performances such as SBJ, SHR or 20-MST.
Only for boys, time spent in LPA was positively corre-lated with body fatness, whereas VPA and VHPA were negatively associated. Rowlands et al. [25] reported a negative relationship between fatness and PA in 8- to 10-yr-old boys and girls, whilst Dencker and Andersen [26] reported only low to moderate inverse relationships between moderate to vigorous PA and body fatness with a comparable population. Using accelerometry, Abbott and Davies [27] and Dencker et al. [28] found significant relationships between VPA and VHPA and body fatness, but no relationship was reported with MPA. These
Table 3 Mean ± SD for the daily number of continuous bouts of physical activity according to their duration and intensity
LPA MPA VPA VHPA
Boys Girls Boys Girls Boys Girls Boys Girls
≤15s 214.4 ± 63.9*** 174.3 ± 55.6 344.8 ± 79.1 336.3 ± 76.7 157.9 ± 53.4*** 125.3 ± 48.4 59.9 ± 25.8*** 44.1 ± 27.9 15 < x≤ 30s 63.1 ± 16.3 60.5 ± 17.0 49.8 ± 14.9*** 38.7 ± 12.9 9.4 ± 5.2*** 7.0 ± 5.5 1.8 ± 1.7 1.8 ± 2.2 30 < x≤ 60s 51.5 ± 12.6 53.9 ± 12.5 22.3 ± 8.5*** 14.5 ± 6.3 1.9 ± 1.3 1.8 ± 1.8 0.3 ± 0.5 0.5 ± 0.9 60 < x≤ 180s 52.1 ± 11.5 58.9 ± 11.0*** 7.3 ± 3.4*** 4.3 ± 2.5 0.07 ± 0.1 0.1 ± 0.3 0.1 ± 0.2 0.2 ± 0.4 180 < x≤ 600s 27.6 ± 5.8 31.2 ± 5.1*** 0.5 ± 0.5 0.5 ± 0.6 0.02 ± 0.08 0.003 ± 0.02 0.004 ± 0.02 0.03 ± 0.1 >600s 14.6 ± 2.9 14.6 ± 2.5 0.02 ± 0.7 0.02 ± 0.01 0.002 ± 0.02 0.005 ± 0.05
LPA: light physical activity; MPA: moderate physical activity; VPA: vigorous physical activity; VHPA: very high physical activity. ***: significantly different between genders at p < 0.001.
Table 4 Correlations between the times spent at various intensity levels, anthropometry and EUROFIT performances for the boys and the girls.
Boys Height (cm) Weight (kg) BMI (kg.m-2) H/W % BF SBJ (cm) SHR (s) SAR (cm) HG (kgf) SUP (n) 20-MST (km.h-1) LPA -0.06 0.06 -0.11 -0.04 0.28** -0.11 0.18 -0.07 -0.08 -0.15 -0.08 MPA 0.08 -0.02 -0.06 0.04 -0.19 0.06 -0.15 0.02 0.11 0.11 0.08 VPA 0.04 -0.09 -0.15 0.05 -0.38*** 0.18 -0.18 0.12 0.03 0.20 0.08 VHPA 0.06 -0.06 -0.12 -0.02 -0.35** 0.18 -0.19 0.08 -0.004 0.21 0.06 Girls LPA -0.05 -0.08 -0.08 -0.06 0.03 0.10 0.05 -0.04 -0.03 -0.12† -0.10 MPA 0.02 0.06 0.08 0.09 -0.01 -0.15 -0.02 0.07 0.02 0.12† 0.10 VPA 0.04 0.05 0.05 0.04 -0.04 -0.08 -0.07 -0.01 -0.001 0.11 0.16† VHPA -0.19† -0.18† 0.12 -0.01 -0.15† -0.16 0.08 -0.05 -0.14 -0.08 -0.01
LPA: light physical activity; MPA: moderate physical activity; VPA: vigorous physical activity; VHPA: very high physical activity. BMI: body mass index; H/W: hip/ waist circumference ratio; % BF: percentage of body fat; SBJ: standing broad jump; SHR: 10 × 5m shuttle run; SAR: sit and reach; HG: handgrip; SUP: number of sit-ups; MS: maximal shuttle speed.
findings agree with the present study, where trivial rela-tionships between VPA and VHPA and body fatness were also observed. Conversely, Ness et al. [29] reported higher correlations between moderate to vigorous PA and body fatness in boys of comparable ages. These dif-ferences could be explained by an acute measure of fat mass (dual x-ray emission absorptiometry) in the latter study, while skinfold measurement, as used in the pre-sent study, remains a less robust method. Nevertheless, the weak relationship found between LPA and percen-tage body fat in boys only, should also be carefully inter-preted. The cut-offs used [22] in the present study do not allow to differentiate between LPA and sedentary activity, the latter being included in LPA. Body fatness in boys may thus be more related to sedentary activity than to LPA. Few recent studies proposed thresholds to discriminate between LPA and sedentary activity [30-32] but none of them used a 5s- epoch. It is possible that the 5-s epoch might not be appropriate to assess “true” sedentary activities. Indeed, this type of activity would better assessed with longer epochs such as 1-min rather than 5-s epoch. The latter could lead to an overestima-tion of sedentary activity. For example, during sponta-neous PA, where children alternate short bouts of PA with short recovery periods, the recovery bout would be classified as sedentary activity, whereas it is not.
Relationships between waist circumference and body composition seem to be associated with cardiovascular disease risk and suggested that PA may have a beneficial effect, notably with respect to overweight [33,34]. In the present study, no relationship was found between hip and waist circumferences and times spent from LPA to VHPA. Using accelerometry, Hussey et al. [35] reported a significant negative correlation between waist circum-ference and time spent in VPA in boys, but not in girls. Similar conclusions were drawn by Ness et al. [29].
In the literature, positive relationships between PA and aerobic fitness have generally been observed in chil-dren [25,26]. However, correlations reported in the lit-erature are moderate, therefore Dencker et al. [26] suggested that the aerobically fitter children were not obligatorily the more active. The results found in the current study showed that aerobic fitness was not asso-ciated with overall physical activity. Differences between experimental protocols (epoch length and/or field vs laboratory tests) may explain these discrepancies.
Children’s PA is characterized by rapid changes from rest to PA including vigorous intensities. Investigating PA patterns related to health gives information about how to promote PA during childhood. To the best of our knowledge, only one study [15] has investigated the relationship between PA patterns and physical fitness. They reported that children’s sporadic activity was nega-tively related to waist circumference and aerobic fitness. In the present study, short bouts of VPA in boys were positively related to lower body fatness, whereas LPA and sedentary long bouts were negatively associated. Our results show that PA intensity has a positive influ-ence on the maintenance of a healthy body composition and suggest that children should be engaged in longer VPA sessions. As the majority of children’s VPA and VHPA is accumulated via short intermittent bouts rather than long continuous bouts, intermittent activity seems to be efficient to promote healthy body composi-tion and health-related fitness. However, there is an
Table 5 Variables (times spent at various PA intensities) explaining the percentage of body fat in boys
%BF R2(SEE) 0.20 (5.09) Estimates P values Age 0.05 (-0.02 - 0.12) 0.172 MPA 0.02 (-0.05 - 0.09) 0.547 VPA -0.29 (-0.52 - -0.05) 0.018 VHPA -0.27 (-0.62 - 0.08) 0.13
%BF: percentage of body fat; MPA: moderate physical activity; VPA: vigorous physical activity; VHPA: very high physical activity; SEE: standard error of the estimate. Confidence intervals: 95% of estimates are displayed in brackets.
Table 6 Correlations between the number of bouts according to their duration and intensity and percentage of body fat in boys.
% BF % BF % BF
≤15s -0.31** -0.44*** -0.39***
15 < x≤ 30s -0.30* -0.38* -0.26* 30 < x≤ 60s LPA -0.25* VPA -0.25* VHPA -0.24* 60 < x≤ 180s -0.23* -0.02 -0.09 180 < x≤ 600s -0.10 -0.02 -0.04
>600s 0.34**
LPA: light physical activity; VPA: vigorous physical activity; VHPA: very high physical activity; % body fat: percentage of body fat.
*: p < 0.05 significance; **: p < 0.01 significance; ***: p < 0.001 significance.
Table 7 Variables (number of bouts according to their duration and their intensity) explaining the percentage of body fat in boys
% BF R2(SEE) 0.26 (4.91) Estimates P values Age 0.03 (-0.05 - 0.11) 0.51 LPA≤ 15s 0.02 (-0.02 - 0.05) 0.31 LPA > 600s 0.42 (-0.012 - 0.96) 0.13 VPA≤ 15s -0.05 (-0.08 - -0.14) 0.006 VHPA 30 < x≤ 60s -1.57 (-3.84 - 0.71) 0.17
LPA: light physical activity; VPA: vigorous physical activity; VHPA: very high physical activity; %BF: percentage of body fat; SEE: standard error of the estimate. Confidence intervals: 95% of estimates are displayed in brackets
Blaes et al. International Journal of Behavioral Nutrition and Physical Activity 2011, 8:122 http://www.ijbnpa.org/content/8/1/122
urgent need for more longitudinal studies on children in which PA, physical fitness (or performance), and health are measured repeatedly in the same individual over an extended period of time [36,37].
More than ninety-five percent of the boys and 77.5% of the girls accumulated 60 or more minutes of moder-ate to very high PA per day. These results are higher than reported on UK children [15], but lower compared with some American or European studies [21,38]. How-ever, the proportion of children reaching PA guidelines should be interpreted with caution. The use of higher accelerometer thresholds to classify intensity or the use of a smaller epoch to monitor PA might explain these discrepancies between studies.
Times spent from MPA to VHPA were lower than reported in the literature. Girls spent more time in LPA than boys (2.1%, p < 0.001), whilst the latter spent more time in MPA (1.5%, p < 0.001) and in VPA (0.4%,p < 0.05). A sex-related difference was only found for 5 to 10-s VHPA bouts (p < 0.001). Hussey et al. [35] assessed PA during 4 days on Irish children aged 7 to 10. They observed that boys spent twice as much VPA and VHPA as girls (64.3 min vs 37 min each day, p < 0.001). Trost et al. [39] reported that boys spent about 120 min in MPA, whereas girls spent 100 min per day (p < 0.05). These dif-ferences may be explained by the use of different acceler-ometers [35,40]; different epochs [21,39]; number of the monitoring days [41] and different cut-offs [30]. In the present study a 5-s epoch was used to assess more accu-rately children’s PA patterns in free-living conditions. Vigorous PA and VHPA are captured and not diluted in MPA or LPA. Using a 2-s epoch, Rowlands et al. [13] reported that differences in PA were largely due to the intensity of the most frequent bouts of activity and the frequency of the most intense bouts. McClain et al. [42] also reported that shorter epoch lengths should be used to minimize error among individual estimates.
Conclusion
In 6- to- 12 yr- old children, the children’s PA level is poorly related to the physical performance. Only a trivial relationship between vigorous physical activity and body fatness was observed. Our results also underline the need for uniformity in approach to measurement of PA, body composition and health-related fitness between studies.
Acknowledgements
The authors would like to acknowledge the teachers and children from the primary schools of Illies, Herlies and Santes (North of France).
Author details
1University of Lille Nord de France, UDSL, EA 4488, Physical Activity - Muscle
- Health, Lille, France.2Blaise Pascal University, UFR STAPS, Laboratory of Exercise Biology (BAPS), EA 3533, Clermont-Ferrand, France.
Authors’ contributions
AB and GB were involved in acquisition, analysis, and interpretation of data, drafting and manuscript writing. SB was involved in analysis and
interpretation of data, drafting and critically revising the manuscript. CF and EVP were involved in the conception and design of the paper and played a role in critically revising and editing the manuscript. All authors read and approved the final manuscript.
Competing interests
The authors declare that they have no competing interests. Received: 16 September 2010 Accepted: 4 November 2011 Published: 4 November 2011
References
1. Sirard JR, Pate RR: Physical activity assessment in children and adolescents. Sports Med 2001, 31(6):439-454.
2. Sallis JF, McKenzie TL, Alcaraz JE: Habitual physical activity and health-related physical fitness in fourth-grade children. Am J Dis Child 1993, 147(8):890-896.
3. Telama R, Yang X, Laasko L, Viikari J: Physical activity in childhood and adolescence as predictor of physical activity in young adulthood. Am J Prev Med 1997, 13(4):317-323.
4. Trudeau F, Laurencelle L, Tremblay J, Rajie M, Shephard RJ: A long-term follow-up of participants in the Trois Rivières semi-longitudinal study of growth and development. Pediatr Exerc Sci 1998, 10(4):366-377. 5. Blair SN, Kohl HW, Paffenbarger RS, Clark DG, Cooper KH, Gibbons LW:
Physical fitness and all cause mortality point prospective study of healthy men and women. JAMA 1999, 262(17):2395-2401.
6. Riddoch CJ, Boreham C: Physical activity physical fitness and children’s health: current concepts. In Pediatric Exercise and Medicine. Edited by: Armstrong N, Van Mechelen W. Oxford: Oxford University Press; 2000:243-252.
7. Strong WB, Malina RM, Blimkie CJR, Daniels SR, Dishman RK, Gutin B, Hergenroeder AC, Must A, Nixon PA, Pivarnik JM, Rowland TW, Trost SG, Trudeau F: Evidence based physical activity for school-age youth. J Pediatr 2005, 146:732-737.
8. Katzmarzyk PT, Malina RM, Song TM, Bouchard C: Physical activity and health-related fitness in youth: a multivariate analysis. Med Sci Sports Exerc 1998, 30(5):709-714.
9. Lee IM: Dose-response relation between physical activity and fitness: even a little is good; more is better. JAMA 2007, 297(19):2137-2139. 10. Bailey RC, Olson J, Pepper SL, Porszasz J, Barstow TJ, Cooper DM: The level
and tempo of children’s physical activities: an observational study. Med Sci Sports Exerc 1995, 27(7).
11. Troiano RP: Large-scale applications of accelerometers: new frontiers and new questions. Med Sci Sports Exerc 2007, 39(9):1501.
12. Baquet G, Stratton G, Van Praagh E, Berthoin S: Improving physical activity assessment in prepubertal children with high-frequency accelerometry monitoring: a methodological issue. Prev Med 2007, 44(2):143-147. 13. Rowlands AV, Pilgrim EL, Eston RG: Patterns of habitual activity across
weekdays and weekend days in 9-11-year-old children. Prev Med 2008, 46(4):317-324.
14. Murphy MH, Blair SN, Murtagh EM: Accumulated versus continuous exercise for health benefit: a review of empirical studies. Sports Med 2009, 39(1):29-43.
15. Stone MR, Rowlands AV, Middlebrooke AR, Jawis MN, Eston RG: The pattern of physical activity in relation to health outcomes in boys. Int J Pediatr Obes 2009, 4(4):306-315.
16. Slaughter MH, Lohman TG, Boileau RA, Horswill CA, Stillman RJ, Van Loan MD, Bemben DA: Skinfold equations for estimation on body fatness in children and youth. Hum Biol 1988, 60:709-723.
17. Committee of Experts on Sports Research: Handbook for the EUROFIT tests of physical fitness Rome: Edigraf Editoriale Grafica; 1988.
18. Mahoney C, Boreham C: Validity and reliability of fitness testing in Primary School. In Fitness Testing and Primary School Children Sport and Physical Activity. Edited by: Williams TJ, et al. London: E and FN Spon; 1992:429-437.
19. Tolfrey K, Campbell IG, Batterham AM: Aerobic trainability of prepubertal boys and girls. Pediatr Exerc Sci 1998, 10:248-263.
20. De Vries S, Van Hirtum WJEM, Bekker I, Hopman-Rock M, Hirasing RA, Van Mechelen W: Validity and Reproducibility of Motion Sensors in Youth: A Systematic Update. Med Sci Sports Exerc 2009, 41(4):818-827.
21. Riddoch CJ, Andersen LB, Wedderkopp N, Harro M, Klasson-Heggebo L, Sardinha LB, Cooper AM, Ekelund U: Physical activity levels and patterns of 9- and 15-yr-old European children. Med Sci Sports Exerc 2004, 36(1):86-92.
22. Nilsson A, Ekelund U, Yngve A, Sjöström N: Assessing physical activity among children with accelerometers using different time sampling intervals and placements. Pediatr Exerc Sci 2002, 14:87-96.
23. Malina RM: Adherence to physical activity from childhood to adulthood: a perspective from tracking studies. Quest 2001, 53:346-355.
24. Ruzic L, Heimer S, Misigoj-Durakovic M, Matkovic BR: Increased occupational physical activity does not improve physical fitness. Occup Environ Med 2003, 60(12):983-985.
25. Rowlands AV, Roger G, David K: Relationship between activity levels, aerobic fitness and body fat in 8- to 10-yr-old children. J Appl Physiol 1999, 86(4):1428-1435.
26. Dencker M, Andersen LB: Health-related aspects of objectively measured daily physical activity in children. Clin Physiol Funct Imaging 2008, 28:133-134.
27. Abbott RA, Davies PS: Habitual physical activity and physical activity intensity: their relation to body composition in 5.0-10.5-y-old children. Eur J Clin Nutr 2004, 58(2):285-291.
28. Dencker M, Thorsson O, Karlsson M, Lindén C, Eiberg S, Wollmer P, Andersen LB: Daily physical activity related to body fat in children aged 8-11 years. J Pediatr 2006, 149:38-42.
29. Ness AR, Leary SD, Mattocks C, Blair SN, Reilly JJ, Wells J, Ingle S, Tilling K, Smith GD, Riddoch C: Objectively measured physical activity and fat mass in a large cohort of children. PLoS Medicine 2007, 4(3):e97. 30. Puyau MR, Adolph AL, Vohra FA, Butte NF: Validation and calibration of
physical activity monitors in children. Obes Res 2002, 10(3):150-157. 31. Trost SG, McIver KL, Pate RR: Conducting accelerometer-based activity
assessments in field-based research. Med Sci Sports Exerc 2005, 37(11):531-543.
32. Pulsford RM, Cortina-Borja M, Rich C, Kinnafick FE, Dezateux C, Griffiths LJ: Actigraph accelerometer-defined boundaries for sedentary behaviour and physical activity intensities in 7 year old children. PLoS One 2011, 6(8):e21822.
33. Andersen LB, Sardinha LB, Froberg K, Riddoch CJ, Page AS, Anderssen SA: Fitness fatness and clustering of cardiovascular risk factors in children from Denmark, Estonia and Portugal: the European Youth Heart Study. Int J Pediatr Obes 2008, 1:58-66.
34. Klein-Platat C, Oujaa M, Wagner A, Haan MC, Arveiler D, Schlienger JL, Simon C: Physical activity is inversely related to waist circumference in 12-y-old children. Int J Obes 2005, 29(1):9-14.
35. Hussey J, Bell C, Benett K, O’Dwyer J, Gormley J: Relationship between the intensity of physical activity inactivity cardiorespiratory fitness and body composition in 7 to 10-year-old Dublin children. Br J Sports Med 2007, 41:311-316.
36. Kemper HCG: Amsterdam Growth and Health Longitudinal Study (A 23-year follow-up from teenager to adult about lifestyle and health). In Medicine and Sport Science. Volume 47. Basel: Karger; 2004.
37. Matton L, Thomis M, Wijndaele K, Duvigneaud N, Beunen G, Claessens AL, Vanreusel B, Philippaerts R, Lefevre : Tracking of physical fitness and physical activity from youth to adulthood in females. Med Sci Sports Exerc 2006, 38(6):1114-1120.
38. Pate RR, Freedson PS, Sallis JF, Taylor WC, Sirard J, Trost SG, Dowda M: Compliance with physical activity guidelines: prevalence in a population of children and youth. Ann Epidemiol 2002, 12(5):303-308.
39. Trost SG, Pate RR, Sallis JF, Freedson PS, Taylor WC, Dowda M, Sirard J: Age and gender differences in objectively measured physical activity in youth. Med Sci Sports Exerc 2002, 34:350-355.
40. Rowlands AV, Thomas PW, Eston RG, Topping R: Validation of the RT3 triaxial accelerometer for the assessment of physical activity. Med Sci Sports Exerc 2004, 36(3):518-524.
41. Trost SG, Pate RR, Freedson PS, Sallis JF, Taylor WC: Using objective physical activity measures with youth: How many days of monitoring are needed? Med Sci Sports Exerc 2000, 32(2):426-431.
42. McClain JJ, Abraham TL, Brusseau TA Jr, Tudor-Locke C: Epoch length and accelerometer outputs in children: comparison to direct observation. Med Sci Sports Exerc 2008, 40(12):2080-2087.
doi:10.1186/1479-5868-8-122
Cite this article as: Blaes et al.: Is there any relationship between physical activity level and patterns, and physical performance in children? International Journal of Behavioral Nutrition and Physical Activity 2011 8:122.
Submit your next manuscript to BioMed Central and take full advantage of:
• Convenient online submission
• Thorough peer review
• No space constraints or color figure charges
• Immediate publication on acceptance
• Inclusion in PubMed, CAS, Scopus and Google Scholar
• Research which is freely available for redistribution
Submit your manuscript at www.biomedcentral.com/submit
Blaes et al. International Journal of Behavioral Nutrition and Physical Activity 2011, 8:122 http://www.ijbnpa.org/content/8/1/122