HAL Id: hal-01057872
https://hal-univ-rennes1.archives-ouvertes.fr/hal-01057872
Submitted on 25 Aug 2014
HAL is a multi-disciplinary open access
archive for the deposit and dissemination of sci-entific research documents, whether they are pub-lished or not. The documents may come from teaching and research institutions in France or abroad, or from public or private research centers.
L’archive ouverte pluridisciplinaire HAL, est destinée au dépôt et à la diffusion de documents scientifiques de niveau recherche, publiés ou non, émanant des établissements d’enseignement et de recherche français ou étrangers, des laboratoires publics ou privés.
Chronic exposure to low doses of pharmaceuticals
disturbs the hepatic expression of circadian genes in lean
and obese mice.
Sébastien Anthérieu, Dounia Le Guillou, Cédric Coulouarn, Karima Begriche,
Viviane Trak-Smayra, Sophie Martinais, Mathieu Porceddu, Marie-Anne
Robin, Bernard Fromenty
To cite this version:
Sébastien Anthérieu, Dounia Le Guillou, Cédric Coulouarn, Karima Begriche, Viviane Trak-Smayra, et al.. Chronic exposure to low doses of pharmaceuticals disturbs the hepatic expression of circadian genes in lean and obese mice.. Toxicology and Applied Pharmacology, Elsevier, 2014, 276 (1), pp.63-72. �10.1016/j.taap.2014.01.019�. �hal-01057872�
1
Chronic exposure to low doses of pharmaceuticals disturbs the hepatic
1
expression of circadian genes in lean and obese mice
2 3
Sébastien Anthérieu a, †, Dounia Le Guilloua, †, Cédric Coulouarn a, Karima Begriche a, Viviane 4
Trak-Smayra b, Sophie Martinais a,Mathieu Porceddu c,Marie-Anne Robin a, Bernard Fromenty a,* 5
6 7
a
INSERM, U991, Université de Rennes 1, 35000 Rennes, France 8
b
Pathology Department, Saint-Joseph University, Beirut, Lebanon 9
c
Mitologics SAS, Hôpital Robert Debré, 48 boulevard Sérurier, 75019 Paris, France 10
11 12
*
Corresponding author at: INSERM, U991, Université de Rennes 1, 35000 Rennes, France. 13
E-mail address: bernard.fromenty@inserm.fr 14
15
†
These authors contributed equally to this work 16 17 18 19 20 21 22
Abbreviations: Alas1, aminolevulinic acid synthase 1; ALT, alanine aminotransferase; APAP, 23
acetaminophen; Arntl, aryl hydrocarbon receptor nuclear translocator-like; Arrdc3, arrestin domain 24
containing 3; AST, aspartate aminotransferase; Atp2b2, ATPase calcium transporting, plasma 25
membrane 2; Bmal1; brain and muscle ARNT-like 1; Clock, circadian locomotor output cycles kaput; 26
Cry1, Cryptochrome 1; CYP, cytochromes P450; Dbp, D site albumin promoter binding protein; GEO, 27
gene expression omnibus; GSEA, gene set enrichment analysis; H&E, hematoxylin-eosin; Mt, 28
metallothionein; Npas2, neuronal PAS domain protein 2; Per, period circadian clock; RT-qPCR, Real-29
time quantitative PCR; Usp2, ubiquitin specific peptidase 2. 30
31 32 33 34
2
ABSTRACT
35 36
Drinking water can be contaminated with pharmaceuticals. However, it is uncertain whether this 37
contamination can be harmful for the liver, especially during obesity. Hence, the goal of our study 38
was to determine whetherchronic exposure to low doses of pharmaceuticals could have deleterious 39
effects in livers of lean and obese mice. To this end, lean and ob/ob male mice were treated for 4 40
months with a mixture of 11 drugs provided in drinking water at concentrations ranging from 10 to 41
106 ng/l. At the end of the treatment, some liver and plasma abnormalities were observed in ob/ob 42
mice treated with the cocktail containing 106 ng/l of each drug. For this dosage, a gene expression 43
analysis by microarray showed altered expression of circadian genes (e.g. Bmal1, Dbp, Cry1) in 44
lean and obese mice. RT-qPCR analyses carried out in all groups of animals confirmed that 45
expression of 8 different circadian genes was modified in a dose-dependent manner. For some 46
genes, a significant modification was observed for dosages as low as 102-103 ng/l. Drug mixture and 47
obesity presented an additive effect on circadian gene expression. These data were validated in an 48
independent study performed in female mice. Thus, our study showed that chronic exposure to trace 49
pharmaceuticals disturbed hepatic expression of circadian genes, particularly in obese mice. 50
Because some of the 11 drugs can be found in drinking water at such concentrations (e.g. 51
acetaminophen, carbamazepine, ibuprofen) our data could be relevant in environmental toxicology, 52
especially for obese individuals exposed to these contaminants. 53
54 55 56
Key words: microarray; drug; liver; mouse; obesity; circadian rhythm 57 58 59 60 61 62 63 64 65 66 67 68
3 Introduction
69 70
Contamination of air, soil and water with pharmaceuticals and personal care products is currently 71
a major concern for many countries. Indeed, such contamination could endanger the health of 72
millionsof individuals, especially in the case of chronic and multiple exposures in sensitive 73
populations (Sanderson, 2011). Regarding pharmaceuticals, it is noteworthy that the parent drugs 74
and their metabolites are excreted by patients as waste and some people also get rid of unused 75
pharmaceuticals in the toilets. Hence, all these pharmaceuticals can thereafter be found in water 76
(Kasprzyk-Hordern et al., 2008; Mompelat et al., 2009). For instance, the following drugs were 77
detected in tap water in several independent studies: acetaminophen (APAP), bezafibrate and other 78
fibrates, caffeine, carbamazepine, cotinine (a nicotine metabolite), diazepam, diclofenac, 79
erythromycin, flumequine, ibuprofen, phenazone (antipyrine), roxithromycin, salicylic acid and 80
sulfamethoxazole (Daughton and Ternes, 1999; Halling-Sorensen et al., 1998; Heberer, 2002; 81
Mompelat et al., 2009; Stackelberg et al., 2004; Webb et al., 2003; Ye and Weinberg, 2007; Yu et 82
al., 2007; Zuccato et al., 2000). As reported in most of these investigations, these drugs were found 83
in the drinking water at concentrations ranging generally between 1 and 20 ng/l. However, for some 84
pharmaceuticals such as APAP, caffeine, carbamazepine, fibrates, ibuprofen and phenazone, several 85
hundreds of ng/l were sometimes found in tap water (Daughton and Ternes, 1999; Mompelat et al., 86
2009). 87
Long-term exposure to drug contaminants could have deleterious consequence for some 88
sensitive tissues, especially the liver. Indeed, liver expresses high levels of cytochromes P450 89
(CYPs) that can transform drugs into toxic metabolites, which are able to induce oxidative stress, 90
mitochondrial dysfunction and cell death (Aubert et al., 2012; Leung et al., 2012). It is also worthy 91
to mention that recent investigations indicated that the liver could be particularly sensitive to drug-92
induced toxicity in the context of obesity (Aubert et al., 2012; Fromenty, 2013). 93
Taken all these data into consideration, the aim of the present study was to determine the long-94
term hepatic effects of pharmaceutical contaminants in lean and obese ob/ob mice. These mice were 95
treated for 4 months with a mixture of 11 drugs provided in drinking water at concentrations ranging 96
from 10 to 106 ng/l. These drugs included APAP, caffeine, carbamazepine, cotinine, diclofenac, 97
erythromycin, ibuprofen, phenazone, roxithromycin, salicylic acid and sulfamethoxazole. 98
Importantly, all these molecules were previously detected in drinking water, as mentioned 99
previously. 100
4
Materials and methods
101 102
Animals and exposure to drugs.Five-week-old male C57BL/6J-+/+mice (wild-type, also referred to 103
as lean mice) weighing 19 to 20g and C57BL/6J-ob/ob mice, weighing 28 to 32 g, were purchased 104
from Janvier (Le-Genest-St-Isle, France) and housed in the animal house facility of Rennes 1 105
University under a 12 h light-dark cycle.All mice were fed ad libitumon a normal diet bringing 2820 106
kcal per kg of food (A04 biscuits; UAR,Villemoisson-sur-Orge, France). After 1 week of 107
acclimatization,wild-type and ob/ob mice were further split into 7different groups that were treated 108
or not with a drug cocktail containing 11 molecules at the following concentrations: 10, 102, 103, 109
104, 105 and 106 ng/l. All these drugs (APAP, caffeine, carbamazepine, cotinine, diclofenac, 110
erythromycin, ibuprofen, phenazone, roxithromycin, salicylic acid and sulfamethoxazole) were 111
purchased from Sigma-Aldrich (St. Quentin-Fallavier, France). Considering the molecular weight of 112
the molecules, 106 ng/l corresponded to concentrations ranging from 1.2 M for roxithromycin to 113
7.2 M for salicylic acid. In a second independent series of investigations, five-week-old female 114
C57BL/6J-+/+and C57BL/6J-ob/ob mice were purchased from Janvier (Le-Genest-St-Isle, France) 115
and housed in the animal house facility of the Robert Debré Hospital. In this study, mice were 116
treated or not with the same cocktail containing the 11 drugs at the following concentrations: 104, 117
105 and 106 ng/l. For both studies conducted in Rennes and Paris, mice were exposed during 4 118
months to these drugs by way of the drinking water, which was renewed every week. Because ob/ob 119
mice are drinking more than lean mice (Fromenty et al. 2009; Massart et al. 2012), drug 120
concentrations in the drinking water was adapted in the group of obese mice to keep constant the 121
daily intake of the drugs between lean and obese mice. Consumption of water was monitored every 122
week and it was not reduced by the presence of the mixture, whatever the drug concentrations.The 123
last day of the treatment, blood was drawn in the morning between 10 a.m. and 2 p.m. Blood 124
withdrawal was carried out from the retro orbital sinus with heparinized capillary Pasteur pipettes 125
for biochemistry analyses. Mice were then sacrificed by cervical dislocation and liver was quickly 126
removed. While a majority of the liver fragments were immediately frozen in liquid nitrogen some 127
of them were rapidly processed for appropriate histological staining. Collected tissues frozen in 128
liquid nitrogen were subsequently stored at -80°C until use. All experimentswere performed 129
according to national guidelines for the useof animals in biomedical research and approved by the 130
local Ethics Committee in Animal Experiment of Rennes 1 University and Robert Debré Hospital. 131
132
Plasma analyses.Immediately after collection, blood was centrifuged for 10 min at 1000g and 133
plasma was stored at -20°C until assay. Plasma activity of alanine aminotransferase (ALT) and 134
5 aspartate aminotransferase (AST), total cholesterol, triglycerides and glucose levels were measured 135
on an automatic analyzer AU2700 (Olympus Diagnostics, Rungis, France) with Olympus 136
commercial Kits OSR6107, OSR6109, OSR6116, OSR6133 and OSR6121, respectively. 137
138
Liver histology. To evaluate necrosis, inflammation and steatosis, liver fragments were fixed in 10% 139
neutral formalin and embedded in paraffin. Then, 4-µm thick sections were cut and stained with 140
hematoxylin-eosin (H&E). All these sections were thoroughly examined by an experienced 141
pathologist (V.T.-S.). The amount of hepatic steatosis in ob/ob and the classification of this lesion 142
into 3 different categories (i.e. microvesicular, mediovesicular and macrovacuolar) were determined 143
as recently described (Trak-Smayra et al., 2011). 144
145
RNA extraction and gene expression profiling.For the microarrays, total RNA extraction, linear T7-146
based amplification step, hybridization procedure, detection and read out of the fluorescence signals 147
were carried out by Miltenyi Biotec GmbH (Bergisch Gladbach, Germany). Total RNA was 148
extracted from liver samples using a standard RNA extraction protocol (Trizol) and quality-checked 149
with an Agilent 2100 Bioanalyzer platform. All RNA samples revealed RNA Integrity Number 150
(RIN) values between 7.2 and 8. Further information on T7-based amplification, Cy3-labeling, 151
hybridization of the Agilent microarray and detection of the fluorescent signals is given in the 152
Supplementary Data. 153
154
Analysis and data mining of microarray data. Gene expression data were analyzed using Feature 155
Extraction and GeneSpring softwares (Agilent Technologies) and further analyzed using R-based 156
array tools, as previously described (Sulpice et al., 2013). Agilent Feature Extraction Software was 157
used to read out and process the microarray image files. This software determines feature intensities 158
(including background subtraction), rejects outliers and calculates statistical confidences. Features 159
that were not positive and significant or below the background signal were filtered out. Microarray 160
data were normalized by using the 75th percentile shift normalization algorithm. Differentially 161
expressed genes were identified by a two-sample univariate t-test and a random variance model as 162
previously described (Coulouarn et al., 2012). Clustering analysis was done using Cluster 3.0 and 163
TreeView 1.6 with uncentered correlation and average linkage options. Enrichment for specific 164
biological functions or canonical pathways was evaluated by using gene ontology annotations, as 165
described previously (Coulouarn et al., 2012). Gene set enrichment analysis (GSEA) was performed 166
using the Java-tool developed at the Broad Institute (Cambridge, MA, USA). Microarray data were 167
submitted to the gene expression omnibus (GEO) database (www.ncbi.nlm.nih.gov/geo; 168
GSE49195). 169
6 170
Real-time quantitative PCR (RT-qPCR) analysis. In order to study the hepatic mRNA expression of 171
selected genes, cDNAs were preparedby reverse transcription of 1 µg of total RNA using theHigh 172
Capacity cDNA Reverse Transcription Kit (Applied Biosystems, Courtaboeuf, France). cDNAswere 173
thus amplified with specific primers using the Power SYBRGreen PCR Master Mix (Applied 174
Biosystems), in an ABI Prism 7900 instrument (Applied Biosystems). Further information on PCR 175
analysis is provided in the Supplementary Data. 176
177
Statistical analysis. Data are presented as means ± SEM (standard error of mean). In order to assess 178
statistical significances for body weight, plasma parameters and hepatic mRNA expression of 179
selected genes, a two-way Analysis of variance (ANOVA) was performed with the factors of 180
genotype (G) and drug mixture treatment (T). Individual means were compared with the post hoc 181
Bonferroni test. 182
7
Results
184 185
Body weight, plasma parameters and liver histology 186
Body weight was measured on a regular basis for each mouse so that the gain of body weight 187
could be calculated over the 4-month period of treatment. Body weight was 31.2 ± 1.0 and 60.6 ± 188
1.0 g, respectively in untreated lean and obese mice at the end of the treatment. The gain of body 189
weight was higher in obese mice compared to lean mice and the treatment significantly modified 190
this parameter (Table 1). However, it was either decreased, unchanged or increased depending in the 191
different groups with no dose-dependent effect (Table 1). 192
Some plasma parameters were measured at the end of the treatment. When compared to lean 193
mice, untreated ob/ob mice presented higher levels of plasma ALT, AST and total cholesterol but 194
normal levels of plasma triglycerides (Table 1), as previously reported (Fromenty et al., 2009; 195
Lindström, 2007; Massart et al., 2012). In addition, the obese mice did not present hyperglycemia 196
(Table 1), which was consistent with previous data showing that the diabetic state of ob/ob mice 197
ameliorated with age (Fromenty et al., 2009; Lindström, 2007). Interestingly, treatment with the 198
drug mixtures significantly modified the plasma levels of total cholesterol and ALT (Table 1). This 199
was particularly evident in ob/ob mice treated with the cocktail containing 106 ng/l of each drug 200
since this group of animals presented the highest plasma levels of total cholesterol and ALT (Table 201
1). 202
Liver histology was also studied at the end of the treatment in mice treated or not with the 203
cocktails containing 105 and 106 ng/l of each drug. There were no histological alterations in lean 204
mice whatever the groups of animals (data not shown). Slight necroinflammation was observed in 205
untreated obese mice (data not shown), which could explain higher levels of plasma AST and ALT 206
(Begriche et al., 2008; Trak-Smayra et al., 2011). However, treatment with the drug mixture did not 207
aggravate the histological score of necroinflammation (data not shown). 208
Hepatic steatosis was observed in all obese mice (Supplementary Table 1) but this lesion was 209
absent in lean mice, treated or not with the cocktails (data not shown). Although the percentage of 210
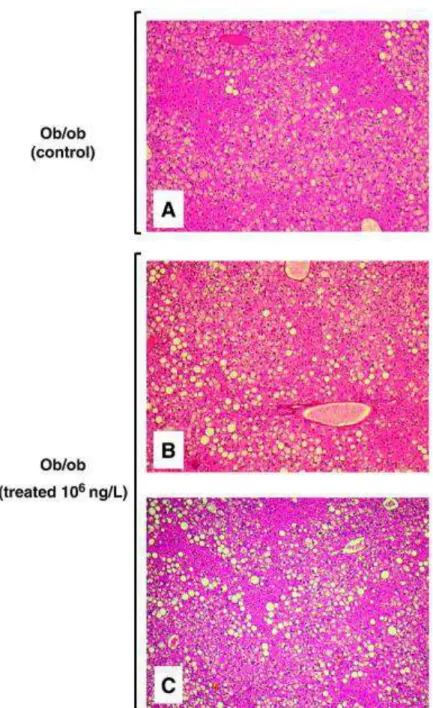
hepatocytes with steatosis was unchanged by the treatment in ob/ob mice, a lower proportion of 211
microvesicular steatosis was observed in obese mice treated with the cocktail containing 106 ng/l of 212
each drug (Supplementary Table 1). Accordingly, the fat droplets were larger in treated ob/ob mice 213
when compared to the controls (Fig. 1). 214
215
Microarray analysis 216
8 Gene expression profiling was carried out in order to determine whether the cocktail containing 217
106 ng/l of each drug induced transcriptional changes in the livers of lean and obese mice. 218
Unsupervised microarray analysis demonstrated that the cocktail significantly modified the hepatic 219
expression of 280 and 284 genes (P<0.05; fold-change>1.5), respectively in lean and obese mice. 220
Among these genes, only 21 were dysregulated in both genotypes thus suggesting that drug-induced 221
transcriptional changes were tightly dependent of the genetic background. Table 2 provides the top 222
10 well-annotated genes that were up or down-regulated by the cocktail in lean and obese mice. 223
Interestingly, when a gene ontology analysis was performed, circadian rhythm was found as the 224
only functional category significantly enriched for the hepatic genes differentially expressed by the 225
cocktail in both lean and obese mice (Supplementary Table 2). In addition, this analysis indicated 226
that the functional categories were linked to biosynthetic processes and transcription factor activity 227
in lean mice and to cell cycle and cytoskeleton for ob/ob mice (Supplementary Table 2). 228
Although this was not the main goal of this study, our unsupervised microarray analysis allowed us 229
to determine the differential hepatic gene expression between lean and ob/ob mice. Our analysis 230
identified 2,434 non-redundant genes that were differentially expressed between lean and obese 231
mice (P<0.001; fold-change>2; data not shown). As previously reported (Fromenty et al., 2009; 232
Yang et al., 2010), ob/ob mice were characterized by an increased expression of many genes 233
involved in lipid synthesis, such as Elovl7 (x15.9), Scd2 (x12.7), Agpat9 (x8.3), Elovl6 (x7.7), 234
Gpam (x5.3), Fasn (x4.6), Acaca (x4.6), Acly (x4.2), Pparg (x4.0) and Thrsp (x3.1). Moreover, 235
there was in ob/ob mice a profound up- or down-regulation of the hepatic expression of several 236
genes involved in the circadian rhythm such as Dbp (x14.3), Per3 (x7.1), Clock (x0.49), Arntl (also 237
referred to as Bmal1) (x0.42) and Cry1 (x0.28). Interestingly, a recent study carried out in ob/ob 238
mice reported lower hepatic expression of the last three genes compared to wild-type mice when the 239
animals were investigated at zeitgeber times similar to our investigations (i.e. zeitgeber times 2 to 6) 240
(Ando et al., 2011). In order to validate the whole data set obtained from our microarray analysis, a 241
GSEA was performed using independent hepatic gene expression profiles from ob/ob and lean mice 242
(Sharma et al. 2010), uploaded from the GEO database (GSE20878). Importantly, GSEA 243
demonstrated that up- and down-regulated genes in ob/ob livers identified in our study were 244
significantly enriched in the respective gene profiles of ob/ob and lean mice from the independent 245
GSE20878 dataset (Supplementary Fig. 1). 246
247
mRNA expression of specific genes 248
Some genes of interest were selected to determine by RT-qPCR their hepatic expression in mice 249
treated or not with the cocktail containing the 11 drugs at concentrations ranging from 10 to 106 250
ng/l. Since the gene ontology analysis pointed a specific dysregulation of genes involved in the 251
9 circadian rhythm in lean and obese mice, the expression of Bmal1, Clock, Dbp, Npas2, Per1, Per2, 252
Per3, and Cry1 was studied in all groups of mice. As shown in Fig. 2, the drug cocktail presented a 253
significant effect on gene expression, which was either decreased (Bmal1, Clock, Npas2, Cry1) or 254
increased (Dbp, Per1, Per2, Per3). A clear dose-effect response was observed in lean and/or obese 255
mice for the expression of all these genes. Moreover, drug mixture and obesity presented an additive 256
effect on circadian gene expression. Importantly, the cocktail presented a significant effect on 257
Bmal1, Dbp, Npas2, Per2, Per3, and Cry1 expression when it contained as low as 102 and 103 ng/l 258
of each drug in the mixture (Fig. 2). For these concentrations, it could be estimated that each drug 259
was administered to mice at the respective doses of 20 and 200 ng/kg/d, when considering the daily 260
intake of water and the body weight of the animals. 261
Because our gene expression profiling was performed on male mice solely, we next validated 262
our results on female mice. To this end, an independent series of lean and ob/ob female mice was 263
treated or not for 4 months with mixtures containing 104, 105 and 106 ng/l of each drug, as described 264
in the Methods section. Interestingly, the profiles of drug-induced modification of circadian liver 265
gene expression were about similar to those observed in male mice, except for Per1 (Fig. 3). It was 266
noteworthy, however, that the effect of obesity on the hepatic expression of these genes was less 267
pronounced in female mice (Fig. 3) when compared to males (Fig. 2). We also noticed that the liver 268
expression of the circadian genes was in general higher in female mice, especially in wild-type 269
animals (Supplementary Fig. 2), which was consistent with a recent study (Xu et al., 2012). 270
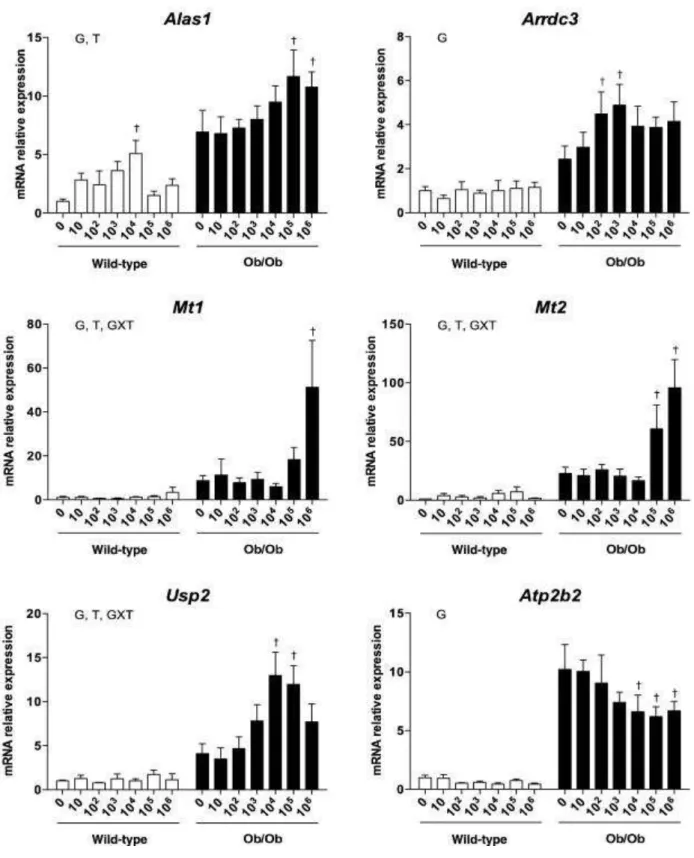
Finally, we determined the hepatic expression of several genes not directly related to circadian 271
rhythm such as Alas1, Arrdc3, Mt1, Mt2, Usp2 and Atp2b2, the expression of which was found 272
dysregulated in the microarray analysis performed in male mice treated with the highest doses of the 273
drugs (Table 2). Interestingly, a dose-effect response was in general observed for the expression of 274
these 6 genes (Fig. 4). However, in female mice, only the expression of Arrdc3 and Usp2 was found 275
to be comparable when compared to male mice (data not shown). 276
10
Discussion
278 279
This study showed for the first time that chronic oral exposure to low doses of pharmaceuticals 280
disturbed the hepatic expression of genes involved in circadian rhythm in mice. These 281
transcriptional effects were dose-dependent and particularly robust since they were found in lean 282
and obese male mice but also in female animals of both genotypes. In male mice, and to a lesser 283
extent in female mice, drug mixture and obesity presented an additive effect on the expression of 284
circadian genes such as Dbp, Per2 and Per3. Moreover, the expression of some circadian genes was 285
dysregulated when the drinking water contained the 11 drugs at concentrations as low as 102 and 103 286
ng/l. Such exposure corresponded to a daily intake of about 20 to 200 ng/kg/d. Hence, our data 287
indicated that a mixture of pharmaceutical contaminants can alter the expression of hepatic genes at 288
concentrations that can be found in drinking water. Indeed, for some drugs such as APAP, caffeine, 289
carbamazepine, ibuprofen and phenazone, several hundreds of ng/l were found in tap water in 290
previous studies (Daughton and Ternes, 1999; Mompelat et al., 2009). 291
A “whole mixture approach” was used in this study, and thus our investigations were not
292
designed to determine which drug(s) could be involved in these hepatic effects, in particular on the 293
expression of circadian genes. Nevertheless, it is noteworthy that some drugs such as prednisolone 294
(Koyanagi et al., 2006), 5-fluorouracil (Terazono et al., 2008), interferon- (Shinohara et al., 2008) 295
and caffeine (Oike et al., 2011; Sherman et al., 2011) can disturb in liver the expression of genes 296
involved in circadian rhythm. However, apart from caffeine, no information was found in the 297
literature regarding this issue for the other drugs contained in the mixture. Although caffeine could 298
have induced the genomic effects reported in our study, it is noteworthy that studies reporting 299
caffeine-induced altered hepatic expression of clock genes were performed with much higher doses 300
(from 3.5 to ca. 75 mg/kg/d) (Oike et al., 2011; Sherman et al., 2011). Thus, further investigations 301
by treating mice with each drug separately would be needed to determine which component(s) of 302
the mixture could alter the liver expression of clock genes when administered at very low doses. 303
However, it is possible that the deleterious effects of the mixture uncovered in the present study 304
might have been less significant with each individual drug (or might not have been observed), as 305
suggested by some investigations in other experimental models (Christiansen et al., 2009; 306
Kortenkamp et al., 2007). Interestingly, some of the drugs included in the cocktails belong to the 307
same pharmacological classes (mainly nonsteroidal anti-inflammatory drugs and antibiotics). 308
Therefore, it would be worth finding out whether the genomic effects detected in this study could be 309
attributed to a particular drug class. 310
11 Although the expression of hepatic genes was disturbed in mice treated for 4 months with the 311
cocktails containing 102 and 103 ng/l of each drug, these concentrations did not change the plasma 312
parameters assessed in this study, namely ALT, AST, glucose, triglycerides and total cholesterol. 313
Thus, the effects on gene expression observed in treated mice with these doses were not associated 314
with significant hepatic cytolysis and systemic alterations of lipid homeostasis. Therefore, changes 315
incircadian gene expression observed for these doses might not be functionally significant.It would 316
be interesting to determine whether a much longer exposure to these low concentrations of 317
pharmaceuticals could have harmful effects on liver biology and integrity beyond the alterations of 318
gene expression. Furthermore, some selected circadian genes (e.g. Bmal1, Per1, Per2) could be 319
useful markers for further investigations specifically designed to look for potential genomic effects 320
of individual drug (or subset of drugs) included in the mixture. 321
It is now acknowledged that disturbances of circadian rhythmicity can promote different 322
metabolic disorders and chronic diseases such as dyslipidemia, insulin resistance, obesity and 323
cardiovascular diseases (Duez and Staels, 2008; Maury et al., 2010; Prasai et al., 2008). Moreover, 324
some studies showed that liver-specific deletion of genes involved in the liver clock could disturb 325
glucose and lipid homeostasis (Lamia et al., 2008; Tao et al., 2011). In this study, however, the 326
genomic response to drug exposure was investigated only in the liver. Hence, further investigations 327
would be required to determine whether an altered expression of clock genes could also be observed 328
in other tissues such as the CNS and in tissues playing a key role in carbohydrate and lipid 329
homeostasis. Different time points of the light-dark cycle should also be studied during these 330
investigations. 331
In this study, the 4-month treatment with the cocktail containing 106 ng/l of each drug 332
significantly increased plasma ALT and total cholesterol and changed the pattern of hepatic 333
steatosis in ob/ob mice, whereas these effects were not observed in wild-type mice. For this dosage, 334
the hepatic expression of most circadian genes in ob/ob mice was the highest, or the lowest, among 335
the different groups of animals. Interestingly, the daily intake corresponding to this dose (ca. 0.2 336
mg/kg/d) was well below the pharmacological dosages for all drugs included in the mixture. Indeed, 337
the daily dosage of these drugs is comprised between a few mg/kg/d for diclofenac and 338
roxithromycin to 40 and 60 mg/kg/d for salicylic acid and APAP, respectively. Importantly, some of 339
these drugs such as APAP, diclofenac, ibuprofen and salicylate can be taken over the long-term (i.e. 340
several months) for the treatment of inflammatory diseases or chronic pain (Kuffner et al., 2006; 341
Schaffer et al., 2006), which are often observed in obese patients (Guh et al. 2009; Wright et al. 342
2010). Thus, our work could also be relevant for obese patients with multiple drug prescriptions, 343
since obesity appears to increase the risk of hepatotoxicity, at least for some drugs (Fromenty, 2013; 344
Massart et al., 2012). Further investigations will be needed to determine whether the genomics 345
12 changes observed in this study could be involved in higher plasma ALT and total cholesterol 346
observed in ob/ob mice. 347
In conclusion, our study showed for the first time that chronic exposure to trace 348
pharmaceuticals was able to disturb the hepatic expression of genes involved in circadian rhythm in 349
lean and obese mice. This effect was dose-dependent and the expression of some circadian genes 350
was already dysregulated when the drinking water contained the 11 drugs at concentrations as low 351
as 102 and 103 ng/l. Moreover, drug mixture and obesity presented an additive effect on this gene 352
expression. Because some of the 11 drugs can be found in the drinking water at such concentrations 353
(e.g. APAP, caffeine, carbamazepine, ibuprofen, phenazone) further investigations would be needed 354
to determine whether our data could be extrapolated to human populations exposed to 355
pharmaceutical contaminants, in particular in countries with high prevalence of obesity. 356 357 358 359 360 Acknowledgments 361 362
This work was supported by a grant from the Agence Nationale de la Recherche (ANR contract 363 PHARMECO 09-CESA-014-01). 364 365 366 Supplementary data 367 368
Supplemental data were provided with this manuscript. The transcriptomic dataset (GSE49195) 369
presented in this study is available in the GEO database at the following URL address: 370 http://www.ncbi.nlm.nih.gov/geo/query/acc.cgi?token=jvgblqimewcyaju&acc=GSE49195. 371 372 373 374 Conflict of interest 375 376
Sébastien Anthérieu, Dounia Menouer, Cédric Coulouarn, Karima Begriche, Viviane Trak-377
Smayra, Sophie Martinais and Marie-Anne Robin have nothing to disclose. Mathieu Porceddu 378
reports co-founding of Mitologics SAS, outside the submitted work. Bernard Fromenty reports 379
13 personal fees from Medicines for Malaria Venture and from Medicen Paris Region, and a grant from 380
Société Francophone du Diabète, outside the submitted work. 381 382 383 384 385 386 387 388
14 References
389 390
Ando, H., Kumazaki, M., Motosugi, Y., Ushijima, K., Maekawa, T., Ishikawa, E., Fujimura, 391
A.,2011. Impairment of peripheral circadian clocks precedes metabolic abnormalities in ob/ob 392
mice. Endocrinology 152, 1347-1354. 393
Aubert, J., Begriche, K., Delannoy, M., Morel, I., Pajaud, J., Ribault, C., Lepage, S., McGill, M.R., 394
Lucas-Clerc, C., Turlin, B., Robin, M.A., Jaeschke, H., Fromenty, B., 2012. Differences in early 395
acetaminophen hepatotoxicity between obese ob/ob and db/db mice. J. Pharmacol. Exp. Ther. 396
342, 676-687. 397
Begriche, K., Massart, J., Abbey-Toby, A., Igoudjil, A., Lettéron, P., Fromenty, B., 2008. -398
Aminoisobutyric acid prevents diet-induced obesity in mice with partial leptin deficiency. 399
Obesity 16: 2053-2067. 400
Christiansen, S., Scholze, M., Dalgaard, M., Vinggaard, A.M., Axelstad, M., Kortenkamp, A., Hass 401
U., 2009. Synergistic disruption of external male sex organ development by a mixture of four 402
antiandrogens. Environ. Health Perspect. 117, 1839-1846. 403
Coulouarn, C., Corlu, A., Glaise, D., Guénon, I., Thorgeirsson, S.S., Clément, B., 2012. Hepatocyte-404
stellate cell cross-talk in the liver engenders a permissive inflammatory microenvironment that 405
drives progression in hepatocellular carcinoma. Cancer Res. 72, 2533-2542. 406
Daughton, C.G., Ternes, T.A., 1999. Pharmaceuticals and personal care products in the 407
environment: agents of subtle change? Environ. Health Perspect. 107(Suppl 6), 907-938. 408
Duez, H., Staels, B., 2008. Rev-erb alpha gives a time cue to metabolism. FEBS Lett. 582, 19-25. 409
Fromenty, B., 2013. Drug-induced liver injury in obesity. J. Hepatol. 58, 824-826. 410
Fromenty, B., Vadrot, N., Massart, J., Turlin, B., Barri-Ova, N., Lettéron, P., Fautrel, A., Robin, 411
M.A., 2009. Chronic ethanol consumption lessens the gain of body weight, liver triglycerides, 412
and diabetes in obese ob/ob mice. J. Pharmacol. Exp. Ther. 331, 23-34. 413
Guh, D.P., Zhang, W., Bansback, N., Amarsi, Z., Birmingham, C.L., Anis, A.H., 2009. The 414
incidence of co-morbidities related to obesity and overweight: a systematic review and meta-415
analysis. BMC Public Health 9, 88. 416
Halling-Sorensen, B., Nielsen, S.N., Lanzky, P.F., Ingerslev, F., Holten Lützhoft, H.C., Jorgensen, 417
S.E., 1998. Occurrence, fate and effects of pharmaceutical substances in the environment: a 418
review. Chemosphere 36, 357-393. 419
Heberer, T., 2002. Occurrence, fate and removal of pharmaceuticals residues in the aquatic 420
environment: a review of recent research data. Toxicol. Lett. 131, 5-17. 421
15 Kasprzyk-Hordern, B., Dinsdale, R.M., Guwy, A.J., 2008.The occurrence of pharmaceuticals, 422
personal care products, endocrine disruptors and illicit drugs in surface water in South Wales, 423
UK. Water Res. 42, 3498-3518. 424
Kortenkamp, A., Faust, M., Scholze, M., Backhaus, T., 2007. Low-level exposure to multiple 425
chemicals: reason for human health concerns? Environ. Health Perspect. 115 (Suppl 1), 106-114. 426
Koyanagi, S., Okazawa, S., Kuramoto, Y., Ushijima, K., Shimeno, H., Soeda, S., Okamura, H., 427
Ohdo, S., 2006. Chronic treatment with prednisolone represses the circadian oscillation of clock 428
gene expression in mouse peripheral tissues. Mol. Endocrinol. 20, 573-583. 429
Kuffner, E.K., Temple, A.R., Cooper, K.M., Baggish, J.S., Parenti, D.L., 2006. Retrospective 430
analysis of transient elevations in alanine aminotransferase during long-term treatment with 431
acetaminophen in osteoarthritis clinical trials. Curr. Med. Res. Opin. 22, 2137-2148. 432
Lamia, K.A., Storch, K.F., Weitz, C.J., 2008. Physiological significance of a peripheral tissue 433
circadian clock. Proc. Natl. Acad. Sci. USA 105, 15172-15177. 434
Leung, L., Kalgutkar, A.S., Obach, R.S., 2012. Metabolic activation in drug-induced liver injury. 435
Drug Metab. Rev. 44, 18-33. 436
Lindström, P., 2007. The physiology of obese-hyperglycemic mice [ob/ob mice]. 437
ScientificWordJournal 7, 666-685. 438
Massart, J., Robin, M.A., Noury, F., Fautrel, A., Lettéron, P., Bado, A., Eliat, P.A., Fromenty, B., 439
2012. Pentoxifylline aggravates fatty liver in obese and diabetic ob/ob mice by increasing 440
intestinal glucose absorption and activating hepatic lipogenesis. Br. J. Pharmacol. 165, 1361-441
1374. 442
Maury, E., Ramsey, K.M., Bass, J., 2010. Circadian rhythms and metabolic syndrome: from 443
experimental genetics to human disease. Circ. Res. 106, 447-462. 444
Mompelat, S., Le Bot, B., Thomas, O., 2009. Occurrence and fate of pharmaceutical products and 445
by-products, from resource to drinking water. Environ. Int. 35, 803-814. 446
Oike, H., Kobori, M., Suzuki, T., Ishida, N., 2011. Caffeine lengthens circadian rhythms in mice. 447
Biochem. Biophys. Res. Commun. 410, 654-658. 448
Prasai, M.J., George, J.T., Scott, E.M., 2008. Molecular clocks, type 2 diabetes and cardiovascular 449
disease. Diab. Vasc. Dis. Res. 5, 89-95. 450
Sanderson, H., 2011. Presence and risk assessment of pharmaceuticals in surface water and drinking 451
water. Water Sci. Technol. 63, 2143-2148. 452
Schaffer, D., Florin, T., Eagle, C., Marschner, I., Singh, G., Grobler, M., Fenn, C., Schou, M., 453
Curnow, K.M., 2006. Risk of serious NSAID-related gastrointestinal events during long-term 454
exposure: a systematic review. Med. J. Aust. 185, 501-506. 455
16 Sharma, A., Bartell, S.M., Baile, C.A., Chen, B., Podolsky, R.H., McIndoe, R.A., She, J.X., 2010. 456
Hepatic gene expression profiling reveals key pathways involved in leptin-mediated weight loss 457
in ob/ob mice. PLoS One 5, e12147. 458
Sherman, H., Gutman, R., Chapnik, N., Meylan, J., le Coutre, J., Froy, O., 2011. Caffeine alters 459
circadian rhythms and expression of disease and metabolic markers. Int. J. Biochem. Cell. Biol. 460
43, 829-838. 461
Shinohara, A., Koyanagi, S., Hamdan, A.M., Matsunaga, N., Aramaki, H., Ohdo, S., 2008. Dosing 462
schedule-dependent change in the disruptive effects of interferon- on the circadian clock 463
function. Life Sci. 83, 574-580. 464
Stackelberg, P.E., Furlong, E., Meyer, M.T., Zaugg, S.D., Henderson, A.K., Reissman, D.B., 2004. 465
Persistence of pharmaceutical compounds and other organic wastewater contaminants in a 466
conventional drinking-water treatment plant. Sci. Total Environ. 329, 99-113. 467
Sulpice, L., Rayar, M., Desille, M., Turlin, B., Fautrel, A., Boucher, E., Llamas-Gutierrez, F., 468
Meunier, B., Boudjema, K., Clément, B., Coulouarn, C., 2013. Molecular profiling of stroma 469
identifies osteopontin as an independent predictor of poor prognosis in intrahepatic 470
cholangiocarcinoma. Hepatology 58, 1992-2000. 471
Tao, W., Chen, S., Shi, G., Guo, J., Xu, Y., Liu, C., 2011. SWItch/sucrose nonfermentable 472
(SWI/SNF) complex subunit BAF60a integrates hepatic circadian clock and energy metabolism. 473
Hepatology 54, 1410-1420. 474
Terazono, H., Hamdan, A., Matsunaga, N., Hayasaka, N., Kaji, H., Egawa, T., Makino, K., 475
Shigeyoshi, Y., Koyanagi, S., Ohdo, S., 2008. Modulatory effects of 5-fluorouracil on the 476
rhythmic expression of circadian clock genes: a possible mechanism of chemotherapy-induced 477
circadian rhythm disturbances. Biochem. Pharmacol. 75, 1616-1622. 478
Trak-Smayra, V., Paradis, V., Massart, J., Nasser, S., Jebara, V., Fromenty, B., 2011. Pathology of 479
the liver in obese and diabetic ob/ob and db/db mice fed a standard or high-calorie diet. Int. J. 480
Exp. Pathol. 92, 413-21. 481
Webb, S., Ternes, T., Gibert, M., Olejniczak, K., 2003. Indirect human exposure to pharmaceuticals 482
via drinking water. Toxicol. Lett. 142, 157-167. 483
Wright, L.J., Schur, E., Noonan, C., Ahumada, S., Buchwald, D., Afari, N., 2010. Chronic pain, 484
overweight, and obesity: findings from a community-based twin registry. J. Pain 11, 628-635. 485
Xu, Y.Q., Zhang, D., Jin, T., Cai, D.J., Wu, Q., Lu, Y., Liu, J., Klaassen, C.D., 2012. Diurnal 486
variation of hepatic antioxidant gene expression in mice. PLoS One 7, e44237. 487
Yang, J.S., Kim, J.T, Jeon, J., Park, H.S., Kang, G.H., Park, K.S., Lee, H.K., Kim, S., Cho, Y.M., 488
2010. Changes in hepatic gene expression upon oral administration of taurine-conjugated 489
ursodeoxycholic acid in ob/ob mice. PLoS One 5, e13858. 490
17 Ye, Z., Weinberg, H.S., 2007. Trace analysis of trimethoprim and sulfonamide, macrolide, 491
quinolone, and tetracycline antibiotics in chlorinated drinking water using liquid chromatography 492
electrospray tandem mass spectrometry. Anal. Chem. 79, 1135-1144. 493
Yu, Z., Peldszus, S., Huck, P.M., 2007. Optimizing gas chromatographic-mass spectrometric 494
analysis of selected pharmaceuticals and endocrine-disrupting substances in water using 495
factorial experimental design. J. Chromatogr. A 1148, 65-77. 496
Zuccato, E., Calamari, D., Natangelo, M., Fanelli, R., 2000. Presence of therapeutic drugs in the 497
environment. Lancet 355, 1789-1790. 498
18 Table 1.
500
Body weight gain and plasma parameters in the different groups of mice at the end of the treatment. 501
Animals Treatment Body weight gain (g) Glucose (mM) Total cholesterol (mM) Triglycerides (mM) ALAT (UI/L) ASAT (UI/L) Lean 0 11.1 ± 0.8 9.6 ± 0.9 2.49 ± 0.12 1.42 ± 0.17 86 ± 15 194 ± 50 10 ng/l 9.8 ± 2.1 9.2 ± 0.6 2.21 ± 0.09 1.00 ± 0.09 90 ± 13 147 ± 25 102 ng/l 11.4 ± 0.7 8.8 ± 0.4 2.28 ± 0.08 1.21 ± 0.16 76 ± 9 164 ± 30 103 ng/l 10.5 ± 0.4 9.4 ± 0.4 2.31 ± 0.09 1.15 ± 0.08 113 ± 26 187 ± 24 104 ng/l 11.9 ± 0.5 10.0 ± 0.4 2.43 ± 0.05 1.29 ± 0.10 71 ± 5 145 ± 23 105 ng/l 12.8 ± 0.3 10.2 ± 0.6 2.67 ± 0.08 1.34 ± 0.03 147 ± 27 189 ± 14 106 ng/l 11.3 ± 0.6 9.9 ± 0.5 2.53 ± 0.09 1.35 ± 0.18 101 ± 13 159 ± 24 ob/ob 0 30.4 ± 0.8 7.2 ± 0.7 7.88 ± 0.38 1.27 ± 0.12 708 ± 50 451 ± 24 10 ng/l 27.7 ± 1.5 10.2 ± 3.1 7.43 ± 0.65 1.12 ± 0.09 672 ± 62 674 ± 105 102 ng/l 31.7 ± 1.6 8.1 ± 0.9 7.81 ± 0.29 1.06 ± 0.02 674 ± 75 587 ± 85 103 ng/l 30.0 ± 0.6 9.5 ± 1.2 7.73 ± 0.44 1.16 ± 0.08 533 ± 58† 372 ± 42 104 ng/l 31.3 ± 0.9 8.9 ± 0.7 8.16 ± 0.32 1.19 ± 0.08 683 ± 43 748 ± 230 105 ng/l 33.3 ± 0.5 9.8 ± 1.0 8.46 ± 0.29 1.07 ± 0.03 844 ± 104 759 ± 133 106 ng/l 29.1 ± 0.9 9.4 ± 0.5 8.83 ± 0.28† 1.29 ± 0.05 936 ± 56† 702 ± 76 Two-way ANOVA analysis G,T G,T G,T,GxT G
Note: Plasma parameters were determined in the fed state. Body weight gain was calculated for each mouse over
502
the 4 months of treatment. Results are mean ± SEM for 5 to 7 mice. Statistical analysis was performed with a
two-503
way ANOVA: G, effect of genotype, T, effect of treatment, GxT, interaction between genotype and treatment.
504
Individual means were then compared with the post hoc Bonferroni test. †Significantly different from untreated
505
mice of the same genotype (P<0.05).
506 507
19
Table 2.
508
Top 10 well-annotated genes that were up or down-regulated in liver of wild-type and ob/ob mice treated with
509
the cocktail containing 106 ng/l of each drug.
510
Up-regulated in both lean and ob/ob micea
Name (Accession number) Gene ontologyb
Dbp (lean 3.70 ; ob 2.08)c D site albumin promoter binding protein (NM_016974)
Circadian rhythm. Positive regulation of transcription from RNA polymerase II promoter
Alas1 (lean 2.56 ; ob 1.52) Aminolevulinic acid synthase 1 (NM_020559)
Biosynthetic process. Heme biosynthetic process
Ypel1 (lean 1.89 ; ob 1.54) Yippee-like 1 (Drosophila) (NM_023249) Negative regulation of protein kinase B signaling cascade. Regulation of myelination
Gnat1 (lean 1.79 ; ob 1.79) Guanine nucleotide binding protein, alpha transducing 1 (NM_008140)
Adenylate cyclase-modulating G-protein coupled receptor signaling pathway. Cell proliferation
Pfkfb3 (lean 1.79 ; ob 1.59) 6-Phosphofructo-2-kinase/fructose-2,6-biphosphatase 3 (NM_133232)
Fructose 2,6-biphosphate metabolic process. Phosphorylation
Arrdc3 (lean 1.79 ; ob 1.52) Arrestin domain containing 3 (NM_001042591)
Fat pad development. Negative regulation of heat generation
Down-regulated in both lean and ob/ob mice
Name (Accession number) Gene ontology
Cry1 (lean 0.38 ; ob 0.65) Cryptochrome 1 (photolyase-like) (NM_007771)
Circadian rhythm. DNA repair
Hmgcs1 (lean 0.45 ; ob 0.61) 3-Hydroxy-3-methylglutaryl-Coenzyme A synthase 1 (AK078743)
Cholesterol biosynthetic process. Isoprenoid biosynthetic process
Trim27 (lean 0.45 ; ob 0.63) Tripartite motif-containing 27 (AK049314)
Interferon gamma secretion. Negative regulation of adaptive immune response
Cstad (lean 0.50 ; ob 0.63) CSA-conditional, T cell activation-dependent protein (NM_030137)
Mitochondrial membrane organization
Avpr1a (lean 0.54 ; ob 0.67) Arginine vasopressin receptor 1A (NM_016847)
Calcium-mediated signaling. Elevation of cytosolic calcium ion concentration
Lonrf3 (lean 0.56 ; ob 0.58) LON peptidase N-terminal domain and ring finger 3 (NM_028894)
Proteolysis
Cdca2 (lean 0.56 ; ob 0.61) Cell division cycle associated 2 (NM_175384)
Cell cycle. Cell division
Arntl (lean 0.57 ; ob 0.36) Aryl hydrocarbon receptor nuclear translocator-like (NM_007489)
Circadian regulation of gene expression. Circadian rhythm
Chka (lean 0.60 ; ob 0.56) Choline kinase alpha (NM_013490) CDP-choline pathway. Glycerophospholipid biosynthetic process
Cxadr (lean 0.62 ; ob 0.56) Coxsackie virus and adenovirus receptor (NM_009988)
Actin cytoskeleton reorganization. AV node cell to bundle of His cell communication
Up-regulated only in lean mice
Name Gene ontology
Cfd (4.35) Complement factor D (adipsin) (NM_013459)
Complement activation, alternative pathway. Innate immune response
H19 (3.85) H19 fetal liver mRNA (AK003142) Negative regulation of cell proliferation. Regulation of gene expression
Tppp3 (2.94) Tubulin polymerization-promoting protein family member 3 (NM_026481)
Microtubule bundle formation
Inhbb (2.63) Inhibin beta-B (NM_008381) Activin receptor signaling pathway. Cellular response to cholesterol
Kif23 (2.50) Kinesin family member 23 (NM_024245) Spindle midzone assembly involved in mitosis E2f7 (2.44) E2F transcription factor 7 (NM_178609) Cell cycle. Chorionic trophoblast cell differentiation Pdlim3 (2.44) PDZ and LIM domain 3 (NM_016798) Actin filament organization. Heart development Igfbp6 (2.38) Insulin-like growth factor binding protein
6 (X81584)
Regulation of cell growth
Esm1 (2.33) Endothelial cell-specific molecule 1 (NM_023612)
Biological process. Regulation of cell growth
Il1rap (2.33) Interleukin 1 receptor accessory protein (NM_008364)
Cytokine-mediated signaling pathway. Innate immune response
Down-regulated only in lean mice
Name Gene ontology
Fos (0.19)2 FBJ osteosarcoma oncogene (NM_010234)
Cellular response to cellular calcium ion. Cellular response to extracellular stimulus.
Nr4a1 (0.21) Nuclear receptor subfamily 4, group A, member 1 (NM_010444)
Apoptotic process. Cell migration involved in sprouting angiogenesis
20 response to gamma radiation
Dusp1 (0.36) Dual specificity phosphatase 1 (NM_013642)
Cell cycle. Dephosphorylation
Igh-VJ558 (0.40) Immunoglobulin heavy chain (J558 family) (XM_001474025)
Igfbp1 (0.40) Insulin-like growth factor binding protein 1 (NM_008341)
Regulation of cell growth
Fam65b (0.42) Family with sequence similarity 65, member B (NM_029679)
Biological process
Zfp36 (0.44) Zinc finger protein 36 (NM_011756) 3’-UTR-mediated mRNA stabilization. Intracellular protein kinase cascade
Fam110c (0.45) Family with sequence similarity 110, member C (NM_027828)
Positive regulation of cell migration. Positive regulation of protein kinase B signaling cascade
Slc34a2 (0.46) Solute carrier family 34 (sodium phosphate), member 2 (NM_011402)
Cellular phosphate ion homeostasis. In utero embryonic development
Up-regulated only in ob/ob mice
Name Gene ontology
Clec2d (2.86) C-type lectin domain family 2, member d (NM_053109)
Cellular defense response. Negative regulation of osteoclast differentiation
Usp2 (2.78) Ubiquitin specific peptidase (NM_198092)
Cell cycle. Muscle organ development
Mt2 (2.63) Metallothionein 2 (NM_008630) Cellular response to drug. Cellular zinc ion homeostasis Upp2 (2.56) Uridine phosphorylase 2 (NM_029692) Metabolic process. Nucleoside metabolic process
Mt1 (2.44) Metallothionein 1 (NM_013602) Cellular metal ion homeostasis. Cellular response to chromate
Krt20 (2.33) Keratin 20 (NM_023256) Apoptotic process. Cellular response to stress Rgs16 (2.27) Regulator of G-protein signaling 16
(NM_011267)
G-Protein coupled receptor signaling pathway. Negative regulation of signal transduction
Car3 (2.08) Carbonic anhydrase 3 (AK075630) One-carbon metabolic process. Response to oxidative stress Grm8 (1.92) Glutamate receptor, metabotropic 8
(NM_008174)
Adenylate cyclase inhibiting G-protein coupled glutamate receptor signaling pathway. G-protein coupled receptor signaling pathway
Cdc6 (1.85) Cell division cycle 6 homolog (S. cerevisiae) (NM_011799)
Cell cycle. Cell division
Down-regulated only in ob/ob mice
Name Gene ontology
Moxd1 (0.18) Monooxygenase, DBH-like 1 (NM_021509)
Catecholamine metabolic process. Oxidation-reduction process
Hsd3b5 (0.18) Hydroxy-delta-5-steroid dehydrogenase, 3 beta- and steroid delta-isomerase 5 (NM_008295)
Oxidation-reduction process. Steroid biosynthetic process
Man2a2 (0.40) Mannosidase 2, alpha 2 (NM_172903) Carbohydrate metabolic process. Mannose metabolic process Usp26 (0.45) Ubiquitin specific peptidase 26
(NM_031388)
Protein deubiquitination. Proteolysis
Gadd45g (0.45) Growth arrest and DNA-damage-inducible 45 gamma (NM_011817)
Activation of MAPKK activity. Apoptotic process
Atp2b2 (0.45) ATPase, Ca2+ transporting, plasma membrane 2 (NM_009723)
ATP catabolic process. Calcium ion export
Ppp1r9a (0.46) Protein phosphatase 1, regulatory (inhibitor) (NM_181595)
Actin filament organization. Calcium-mediated signaling
Kalrn (0.47) Kalirin, RhoGEF kinase (AK051053) Axonogenesis. Intracellular signal transduction Murc (0.48) Muscle-related coiled-coil protein
(NM_026509)
Cardiac myofibril assembly. Cell differentiation
Elovl3 (0.48) Elongation of very long chain fatty acids-like 3 (NM_007703)
Fatty acid biosynthetic process. Fatty acid elongation, monounsaturated fatty acid
Note:aLess than 10 genes were found to be modulated by the drug mixture in this category. bThe first 2 terms were selected by 511
using the Amigo Gene Ontology website, with “Mus musculus” and “Biological process” as filters. c
The number in parentheses 512
is the fold change given by the microarray analysis. 513
514 515 516 517
21 518
519
Legends to the figures
520 521
522 523
Figure 1. Hepatic steatosis in obese ob/ob mice treated or not with the cocktail containing 106 ng/l 524
of each drug. Liver sections were stained with H&E and pictures were taken at 200x magnification. 525
Mice presented in panels A, B and C are those numbered 1, 14 and 18 in Supplementary Table 1. 526
22 527
23 528
Figure 2. Hepatic mRNA expression of 8 circadian genes in male lean and obese mice treated or not 529
with the cocktail containing the 11 drugs at concentrations ranging from 10 to 106 ng/l. Results are 530
mean ± SEM for 5 to 7 mice. Statistical analysis was performed with a two-way ANOVA: G, effect 531
of genotype, T, effect of treatment, GxT, interaction between genotype and treatment. Individual 532
means were then compared with the post hoc Bonferroni test. †Significantly different from 533
untreated mice of the same genotype (P<0.05). 534
24 535
25 Figure 3. Hepatic mRNA expression of 8 circadian genes in female lean and obese mice treated or 536
not with the cocktail containing the 11 drugs at concentrations ranging from 104 to 106 ng/l. Results 537
are mean ± SEM for 4 to 8 mice. Statistical analysis was performed with a two-way ANOVA: G, 538
effect of genotype, T, effect of treatment, GxT, interaction between genotype and treatment. 539
Individual means were then compared with the post hoc Bonferroni test. †Significantly different 540
from untreated mice of the same genotype (P<0.05). 541
542 543
26 544
545
Figure 4. Hepatic mRNA expression of 6 non-circadian genes in male lean and obese mice treated 546
or not with the cocktail containing the 11 drugs at concentrations ranging from 10 to 106 ng/l. 547
Results are mean ± SEM for 5 to 7 mice. Statistical analysis was performed with a two-way 548
ANOVA: G, effect of genotype, T, effect of treatment, GxT, interaction between genotype and 549
treatment. Individual means were then compared with the post hoc Bonferroni test. †Significantly 550
different from untreated mice of the same genotype (P<0.05). 551