HAL Id: hal-03168559
https://hal.archives-ouvertes.fr/hal-03168559
Submitted on 13 Mar 2021
HAL is a multi-disciplinary open access
archive for the deposit and dissemination of sci-entific research documents, whether they are pub-lished or not. The documents may come from teaching and research institutions in France or abroad, or from public or private research centers.
L’archive ouverte pluridisciplinaire HAL, est destinée au dépôt et à la diffusion de documents scientifiques de niveau recherche, publiés ou non, émanant des établissements d’enseignement et de recherche français ou étrangers, des laboratoires publics ou privés.
ECR2 Economic Crisis: Resilience of Regions
Gillian Bristow, Adrian Healy, Laura Norris, Rüdiger Wink, Laura Kirchner,
Florian Koch, Daniel Speda, Grigoris Kafkalas, Christina Kakderi, Kerly
Espenberg, et al.
To cite this version:
Gillian Bristow, Adrian Healy, Laura Norris, Rüdiger Wink, Laura Kirchner, et al.. ECR2 Economic Crisis: Resilience of Regions. [Research Report] ESPON | Inspire Policy Making with Territorial Evidence; University of Cardiff. 2014. �hal-03168559�
ESPON 2013 1
ECR2
Economic Crisis:
Resilience of Regions
Applied Research 2013/124/2012
Final Report | Version 31/August/2014
ESPON ECR2 FINAL REPORT 2 This report presents the final results of an
Applied Research Project conducted within the framework of the ESPON 2013 Programme, partly financed by the European Regional Development Fund.
The partnership behind the ESPON Programme consists of the EU Commission and the Member States of the EU27, plus Iceland, Liechtenstein, Norway and Switzerland. Each partner is represented in the ESPON Monitoring Committee.
This report does not necessarily reflect the opinion of the members of the Monitoring Committee.
Information on the ESPON Programme and projects can be found on www.espon.eu The web site provides the possibility to download and examine the most recent documents produced by finalised and ongoing ESPON projects.
This basic report exists only in an electronic version.
© ESPON & Cardiff University 2014
Printing, reproduction or quotation is authorised provided the source is acknowledged and a copy is forwarded to the ESPON Coordination Unit in Luxembourg.
List of authors and principal contributors Lead Partner Cardiff University: Gillian Bristow Adrian Healy Laura Norris Project Partners Aristotle University Grigoris Kafkalas Christina Kakderi Experian Plc: Adam Swash Heather Carey Gdansk University Iwona Sagan Grzegorz Masik HTWK-Leipzig Rudiger Wink Laura Kirchner Florian Koch Daniel Speda Manchester University: Marianne Sensier Alan Harding Tartu University Kerly Espenberg Veiko Sepp Uku Varblane
ESPON ECR2 FINAL REPORT 4
Table of Contents
EXECUTIVE SUMMARY ... 5
1 INTRODUCTION ... 16
2 TERRITORIAL IMPACT OF THE ECONOMIC CRISIS ... 23
3 THE ECONOMIC RESILIENCE OF REGIONS ... 37
4 REGIONAL EXPERIENCES OF CRISIS AND RESILIENCE ... 46
5 WHAT HELPS BUILD OR SHAPE RESILIENCE? ... 72
6 THE ROLE OF TERRITORIAL POLICIES IN PROMOTING RESILIENCE: MESSAGES FOR POLICY MAKERS ... 84
EXECUTIVE SUMMARY
Introduction
The economic crisis of 2008/9 heralded the most severe economic downturn in the history of the European Union. Yet not all regions experienced economic decline and rates of recovery have varied greatly. Whilst some places experienced a swift return to pre-crisis levels of employment and economic output, for others the process has proved much more protracted, with many economies apparently entering a period of sustained stagnation. This differentiated experience raises important questions as to why some regions prove to be more able to withstand economic shocks than others, and what influences their ability to recover.
In order to address some of these questions and to better understand the territorial impacts of the economic crisis ESPON commissioned this study examining the
economic crisis and the economic resilience of regions. The overall aim of the project has been to:
“expose territorial evidence that supports policy-makers at different administrative levels in making the economic structure(s) in Europe and its countries, regions and cities more resilient to economic crises and a sudden economic downturn.”
It had the following principal objectives:
To deepen our understanding of the territorial impact of the economic crisis
across Europe
To estimate the economic resilience of European regions
To understand the role of territorial policy responses in promoting economic
resilience
The focus of this report is on the recent economic crisis of 2007-09. This acted as a major shock across the economies of the ESPON area, with severe, and often long-lasting, consequences. The scale of this event provides an opportunity for comparative assessment, the results of which can help to inform our understanding of more localised economic shocks - such as the closure of a major employer, or a more national or regional event, such as with the closure of important export markets or technological shifts that undermine whole industries.
At its simplest, resilience refers to the ability of a system to ‘bounce-back’ or return to its pre-shock position. The faster the economy returns to its pre-shock position the more resilient it is. Whilst this offers a compelling view of resilience in the short-term, it may be less instructive over the medium to longer term. In the longer run,
ESPON ECR2 FINAL REPORT 6 economic resilience is determined by the adaptive capacity of an economy, which affects its ability to maintain a long-term growth path
With the increase in popularity of the concept of resilience has come a plethora of means by which this might be measured. Indexes of resilience are increasingly popular with academics and policy-makers, seeking to demonstrate how one place is more resilient than another. Whilst these have their strengths they remain largely unproven. In fact, past indexes proved remarkably inaccurate in predicting the resilience of economies to the most recent economic crisis.
Within this report we assess the resilience of regional economies to the economic crisis through the use of two principal indicators: the number of persons employed and levels of economic output (GDP). Economic resilience is defined as the ability of a region to avoid a fall in economic activity or to regain pre-crisis (or pre-shock) peak levels of employment (or GDP). We include two categories of resilient
territories: those that resisted the crisis (RS) and those that recovered from the crisis (RC). We also include two categories of regions that were not resilient to the crisis: those that have begun their recovery, but where employment (or GDP) has not yet returned to pre-shock levels (NR1) and those that remain in decline (NR2). Here we use the simple definition of resilience – the ability of an economy to withstand or recover from an economic shock.
Territorial Impact of the Crisis
Following an almost unprecedented period of sustained economic growth across Europe, the impact of the global economic crisis was sudden and widespread. Economic output contracted across all ESPON members apart from Poland, bringing to a halt the widespread growth experienced since the 1990s. Employment losses swiftly followed the fall in economic output, with overall numbers in employment recording a fall in 2009. The path to recovery since then has been slow for most states, with emerging evidence of a long stagnation.
Whilst the ESPON economy as a whole entered into recession in 2008/09, some regions experienced an economic downturn in the years immediately preceding this. Although economic decline was being experienced in a small number of regions in 2005 and 2006, the number of regions experiencing a decline in employment levels picked up rapidly in 2007 and 2008 as the full effects of the crisis took hold, before reaching a peak in 2009. Since 2009 there has been a gradual increase in the number of regions recovering to their pre-crisis levels of employment, although the effects of the crisis remain long-lasting across large parts of the ESPON territory. Large parts of the area remain mired in economic decline. The dynamic economic situation is highlighted by the fact that since 2011 some regions in Poland that originally withstood the crisis have themselves begun to experience employment decline.
The headline effects of the crisis are common across the ESPON space, principally lower levels of trade and investment; employment losses in exposed sectors; rising levels of unemployment; falling or stagnant wages; reduced working hours and rising levels of household indebtedness and of government borrowing. However, the effects of the crisis have been spatially uneven, with some regions being affected more strongly than others. The spatial distribution of employment loss is illustrated in Map ES1, highlighting a strong peripheral geography to the most severe employment losses.
Map ES1 Employment loss during the crisis (2004-2012, NUTS 2)
Within countries there has also been an uneven distribution of the effects of the crisis. In many cases this has led to a widening of pre-existing disparities, but in some
countries disparities have narrowed over the crisis. Similarly, even those sectors most exposed to the crisis, such as construction, continued to demonstrate employment growth in some countries.
The Economic Resilience Of Regions
Across the ESPON territory four countries, Luxembourg, Germany, Switzerland and Poland, resisted the economic crisis and maintained, or increased, levels of employment in the period of the recent crisis. Only Poland also managed to maintain or increase its level of GDP (Table ES1). By 2011, eight countries had recovered to their pre-crisis peak of GDP activity, and five to their pre-crisis level of employment.
ESPON ECR2 FINAL REPORT 8 Table ES1 National patterns of resilience to the 2008 economic crisis
Employment measure GDP measure
Resisted LU, DE, CH, PL PL
Recovered NO, SE, MT, AT, BE DE, NO, SE, CH, AT, FR,
MT, SK
Not Recovered: upturn IS, UK, FR, NL, IT, FI,
LT, EE, CY, CZ, SK, HU
IS, UK, IE, LU, NL, PT, ES, IT, DK, FI, EE, LV, LT, CZ, SL, HU, RO, BU, CY
Not recovered: no upturn IE, PT, ES, DK, LV, SL,
HR, RO, BU, EL
HR, EL
Of the 280 regions considered, more than a tenth (12%) had weathered the crisis and not experienced any fall in numbers employed, whilst almost a quarter (23%) had experienced a fall in employment but, by 2011, had recovered to the pre-crisis peak. Two-thirds of regions were still to recover by 2011, divided evenly between those that had passed the trough of the downturn, and those still to register the end of
employment decline. The distribution of regional economic resilience is set out in Map ES2, which illustrates a strong geography of resilience for both employment and GDP measures, clearly influenced by national patterns. However, important pockets of recovery and non-recovery are also apparent within this overall geography.
Resilience can also be a more localized phenomena, with neighbouring areas experiencing different patterns of resilience, depending upon specific local particularities. Overall, a slightly greater proportion of NUTS 3 territories have resisted the crisis than is the case at the NUTS 2 scale, and a slightly lower proportion of those that had not yet recovered have begun an economic upturn (Table ES2).
Table ES2 Employment Resilience of NUTS 3 Territories
Resilience Number of regions Proportion (%)
Resistant (RS) 214 16.19
Recovered (RC) 314 23.75
Not recovered but in upturn 364 27.53
Not recovered and no upturn 430 32.53
Source: ESPON ECR2 (n=1,322)
The distribution of regional resilience between Member States suggests that macroeconomic conditions and national policy regimes have an influence on the sensitivity of individual regions to economic crisis. Yet, there are also examples
Map ES2 Distribution of regional economic resilience (NUTS 2, peak year to 2011)
ESPON ECR2 FINAL REPORT 10 where the experience of individual regions runs counter to national trends, or where there is strong variability within Member States. It is noticeable that those regions with significantly weaker relative resilience are located in Germany and Poland, partly reflecting the better level of national resilience recorded in those two countries (Map ES3). Stronger levels of relative regional resilience are, though, more dispersed, covering regions in Finland, Netherlands, Belgium, Norway, Portugal and Romania. These relatively resilient regions cover a mix of territorial cases, including an island region, capital city region and urban and rural economies with different sectoral economic strengths.
Map ES3 Relative Regional Resilience in the ESPON space
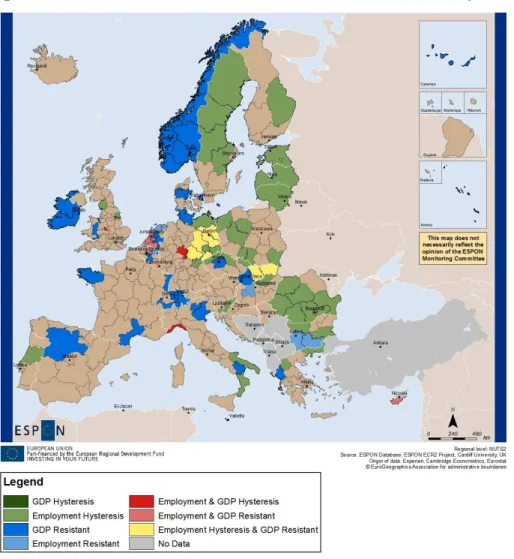
A key question for resilience studies is over what time period resilience should be considered. Evidence from past shocks demonstrates that most regions recover to pre-shock activity levels, eventually. However, in some regions an economic pre-shock can cause, or reinforce, a structural readjustment that may take many years to overcome and lead to a permanent reduction in output or employment. This is clearly evident in the last major pan-European economic crisis (Map ES4). Most strikingly, a fifth of regions (52) have never regained their peak employment levels following the shock of the early 1990s. For four regions (1%), located in Germany, Italy, Portugal and the UK, recovery to peak GDP levels has still not been achieved. This cautions against any assumption that peak levels of employment should form a natural objective following an economic shock, but
is also suggestive of the important interplay between the interaction of economic shocks and longer-term processes of structural transformation.
Map ES4 Historical resilience outcomes (economic shock of early 1990s)
What Helps Build Or Shape Resilience?
The prevailing characteristics of regions set the context for their resilience to economic shocks. These innate properties shape the capacity of a region to react to changing circumstances, often as relatively autonomous responses to economic shocks. These underpinning structures can be divided into four broad categories (Figure ES1).
Figure ES1 The foundations for resilience
Business People
Place Community
ESPON ECR2 FINAL REPORT 12 By far the greatest influence on the resilience of a region is the form and structure of the economy. This includes the initial strengths and weaknesses of regions, their industrial legacy, the size of the market and access to a larger external market. Broadly,
dependence on particular sectors, or a small number of employers, is detrimental to the resilience of the economy. A more diverse economic structure provides greater regional resistance to shocks than does a more specialised structure since risk is effectively spread across a region’s business portfolio. A key factor underlying resilience is the very strong positive relationship between higher levels of innovation performance and observed resilience outcomes. Regions that are classified as Innovation Leaders were the most likely to resist the economic crisis (23%) and to recover from the crisis (72%).
A region’s population can also influence its ability to withstand – or recover from – an economic shock. In practice, the relationship between population characteristics and resilience has proved to be complex and non-uniform. The clearest relationship is in the area of skills. Areas with more highly qualified populations tend to have more positive resilience outcomes. Flexibility in labour markets has also been an important feature shaping the ability of many regions to respond to economic crisis, such as where firms and workers agreed shorter working weeks.
Some place-based characteristics have proven more significant than others. Urban areas, and those which are more accessible, tend to be more resilient than more remote
locations. The resilience of mountainous, coastal and island regions depends on wider context rather than simply their physical characteristics. Regions that were eligible under the Competitiveness and Eligibility strand of the Structural Funds also proved to be disproportionately likely to have resisted or recovered from the crisis.
Community-based features appear to have some impact on observed levels of resilience, although the evidence for this is primarily qualitative. Whilst rarely strong enough to impact directly on the ability of an economy to withstand the effects of an economic crisis they are able to play an important role in shaping the way in which it responds and the opportunities available to communities. Strong social ties and positive levels of
community based capital (including business networks, and inter-firm social capital) can play an important role in mediating resilience outcomes. Of most significance is the finding that the quality of governance has a crucial influence on observed resilience outcomes.
Alongside important structural features that appear to influence levels of resilience the role of agency and choice also emerge as formative influences on the nature of response to crisis. Resilience is shaped by the ability of individuals, organisations, and policy-makers, to learn and to adapt. Individuals, organisations and communities have adapted to the economic crisis through making changes to their actions and behaviour. The choices they make are highly contingent on individual context and depend on the interplay of local, national and international forces; how they understand these forces to affect themselves, and the choices made by those around them and with whom they
interact. Regions with higher levels of resilience appear to have learnt from their experience of past events, whilst those with less experience on which to draw were impeded in their ability to respond.
Policy Approaches To Promote Regional Resilience
There is no single path to a resilient economy, but some common themes emerge. A key role taken by public authorities in the aftermath of an economic shock is to stabilize the situation, both through its own actions and through helping to reduce the uncertainties facing households and firms. A second dimension of public policy is to promote
economic recovery through helping firms and households to adapt to new circumstances. In the current crisis, however, many traditional policy instruments - based around public-sector expenditure - have been limited due to prevailing austerity measures. Typical policy responses to promote recovery can include:
Economic stimulus packages
Employment support
Promoting flexible working
Supporting training
Promoting entrepreneurship, competitiveness and innovation
Encouraging economic diversification
Tax and investment incentives
Easing eligibility rules and providing access to credit
Government reform and institutional change
Leadership and dialogue
Supporting community responses
The foundations of resilient economies are formed many years prior to an economic shock. This is where preparatory actions come to the fore. It is policy decisions taken in the years and even decades prior to a shock that shape the capability of the region to respond to the shock itself. Four features stand out as crucial considerations in developing a resilient economy.
1. Diversity – More diverse economies tend to be more resilient over time as they prove more able to adapt to changing circumstances.
2. Skills – Policies promoting higher-qualified and higher-skilled labour help to build economies with greater resilience capabilities.
3. Innovation – Regions with higher levels of innovation activity tend to be able to respond to economic shocks more positively than those where innovation capabilities are lower.
4. Good governance – There is a strong correlation between the quality of government present in a region and its observed capacity for resilience to economic shocks.
ESPON ECR2 FINAL REPORT 14 Resilient economies are those that are able to embrace change and this requires an
understanding of the constituent parts of the economy, associated pressure points and potential vulnerabilities. A resilience ‘healthcheck’, using an appropriate dashboard, can play an important role in preparing a resilient economy. Equally, when developing policies promoting resilience, authorities should not overlook the significance of softer policy instruments, particularly those that enable the development of a self-organising capacity amongst the community.
Regions are shapers and not merely containers of economic agents and their activity . To promote resilience, it is essential to tackle the specific challenges facing particular places. These tend to be most fully understood by sub-national policy actors. This highlights the importance of place-based actions. But, resilience is a shared responsibility. Actions that integrate national and sub-national approaches are to be preferred over those that focus exclusively on one or the other. The experience of sub-national authorities during the past crisis, and in the time leading up to it, demonstrates the limitations of local-actions. The ability to mobilise finances and resources are greater at the national level,
particularly when not all places are experiencing the economic shock to the same extent. Resilience is also strengthened where risks can be shared across territories.
Recommendations
Regional resilience is a place-based capacity shaped both by a territory’s inherited
resources and structures, as well as its people and the agency of its individuals, businesses and other organisations. To build resilient regional economies for the future we
recommend that:
1. Regional policy-makers develop a robust assessment of the potential risks and vulnerabilities to possible shocks facing their region.
2. Policy approaches that seek to develop adaptive capacities within regional economies should be preferred.
3. A long-term approach is taken, that stresses the importance of strengthening the capacity of agents to act independently, rather than necessarily seeking public-sector led solutions
4. Recognition should be given to the importance of high quality governance arrangements in promoting more resilient economies.
5. Policies promoting resilience should take into consideration place-based characteristics, recognizing local variation.
6. Policies promoting resilient regional economies will best be developed through complementary actions at the sub-national and national scale.
7. Developing a risk sharing facility as an explicit element of Cohesion Policy should be explored as a means of promoting balanced territorial development.
8. The European Commission support the development of good resilience practices. This may be through the building of capacities amongst regional actors, through the sharing of information or the development of pilot projects.
9. Attention now be given to the issue of transformation and recovery. Policies are required that encourage the transformation and adaptation of economies in these regions most affected by the recent economic downturn.
ESPON ECR2 FINAL REPORT 16
1
INTRODUCTION
1.1 Background
The economic crisis of 2008/9 heralded the most severe economic downturn in the history of the European Union. Yet not all regions experienced economic decline and rates of recovery have varied greatly. Whilst some places experienced a swift return to pre-crisis levels of employment and economic output, for others the process has proved much more protracted, with many economies apparently entering a period of sustained stagnation. It is only now, some eight years after the first signs of the impending economic crisis emerged, that we even begin to have the data to fully understand how this has affected the economies of Europe.
This differentiated experience raises important questions as to why some regions prove to be more able to withstand economic shocks than others, and what influences their ability to recover. It has also led to an interest in the concept of economic resilience, both amongst academic researchers and policy makers as well as in the popular press. This increasing interest in the resilience of economies raises its own questions. What is it that makes some economies more resilient to economic shocks than others? How might policy-makers positively influence this? And, significantly, what do we actually mean when we speak about a resilient economy?
In order to address some of these questions and to better understand the territorial impacts of the economic crisis ESPON commissioned this study examining the economic crisis and the economic resilience of regions. It had the following principal objectives:
To deepen our understanding of the territorial impact of the economic
crisis across Europe
To estimate the economic resilience of European regions
To understand the role of territorial policy responses in promoting
economic resilience
This has been undertaken through a mix of quantitative analysis and eight in-depth area studies. The quantitative analysis involved a novel approach based on identifying the actual year that each region entered into economic decline, and the year in which it recovered its pre-crisis level of economic activity. In this way the report avoids assuming that all parts of Europe entered the economic crisis at the same time.
Why did
some regions
withstand the
recent
economic
shock better
than others?
Why did
some recover
more
quickly?
This report sets out a summary of the main findings of the study. Section 1 provides an introduction to the economic crisis and the concept of resilience. Section 2 explores the territorial impact of the economic crisis. Section 3 identifies the resilience of regions across the ESPON space to the economic crisis. Section 4 provides a brief introduction to the experiences of each of the eight cases studied. Section 5 considers the factors that underpin the economic resilience of regions. Section 6 identifies the policy responses that have promoted regional resilience. Section 7 provides some broad conclusions and recommendations. For a fuller coverage of any element of this work readers can refer to the accompanying Scientific Report.
1.2 Economic shocks
Economies are never static, they are dynamic entities that in a continuous state of flux. They expand and contract in response to events, caused by the interplay of decisions taken by a complex web of individuals, firms, public agencies and other organisations connected through a complex transactional web. Occasionally, these existing transactional pathways of production and consumption are interrupted by some shock, with consequences at the individual, local, regional, national or even international level.
The focus of this report is on the recent economic crisis of 2007/08 (Box 1.1). This acted as a major shock across the economies of the ESPON area, with severe, and often long-lasting, consequences. The scale of this event provides an opportunity for comparative assessment, the results of which can help to inform our understanding of more localised economic shocks - such as the closure of a major employer, or a more national or regional event, such as with the closure of important export markets or technological shifts that undermine whole industries.
Economic shocks can also occur as a consequence of a natural event, such as an earthquake or flooding, or a man-made event such as conflict. Again, we hope that the lessons learnt from this study can help to strengthen the resilience of regions in these cases as well.
Whilst economic shocks are not particularly rare events and their likely occurrence can be broadly foreseen, the consequences of these shocks are much
less predictable1 - as witnessed by the rapid unravelling of the economic order
following defaults in the American sub-prime mortgage market. It is the consequences of an event that tends to mark it out as a ‘shock’ to the system and, certainly, to attach the word ‘crisis’. At a local level, the effects of a wider shock can often be exacerbated by localized events, such as the closure the restructuring of a major plant, which leaves the economy more vulnerable to the effects of the wider crisis. It is often this layering of local and international events that precipitates the deepest territorial effects.
ESPON ECR2 FINAL REPORT 18 Box 1.1 The financial crisis of 2007/2008
The global economic crisis is generally accepted to have been precipitated by a slow-down in the US economy, triggering substantial losses in the sub-prime mortgage market and creating a global liquidity crisis as losses were passed from bank to bank through their exposure to financial products such as derivatives and credit swap agreements. A short sharp fall in economic output followed as firms struggled to gain credit from a crisis-hit banking sector.
The headline effects of the global ‘credit crunch’ was the bankruptcy and bail-out of over-exposed banks across western economies, resulting in a second wave crisis characterized by rising levels of sovereign debt, swingeing austerity measures in affected economies and the rise of co-ordinated international support. Austerity measures, coupled with the earlier liquidity crisis, have caused firms and households to reduce consumption reinforcing the contractions in economic output first highlighted in 2008.
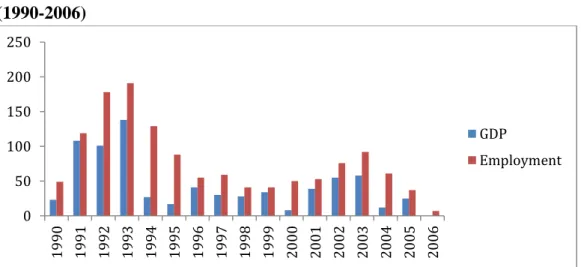
The ebb and flow of economic fortunes is evident in Figure 1.1. Between 1990 and the emerging economic crisis in 2007 there has only been one year where all regional economies in the ESPON space were experiencing growth in economic output, and no year that all regions experienced employment growth. What then constitutes a crisis (or a wide-ranging shock that merits pan-European analysis)? From the data it is apparent that there are two European-wide downturns within the period 1990-2007, prior to the most recent economic crisis. One occurs in the period 1992-93 and the other, smaller, event occurs around 2002-2003. This provides a context for the present study.
Figure 1.1 Number of regions experiencing employment or GDP decline (1990-2006)
Source: ESPON ECR2 (n=280) 0 50 100 150 200 250 1990 1991 1992 1993 1994 1995 1996 1997 1998 1999 2000 2001 2002 2003 2004 2005 2006 GDP Employment
At any one
time there
are always
some regions
experiencing
an economic
downturn.
1.3 Economic Resilience
Resilience has become one of the leading ideas of our time for dealing with uncertainty and change. It is a concept which is increasingly being utilised by authors and policy-makers keen to understand how local and regional economies deal with economic shocks and recessionary crises. At its simplest, resilience refers to the ability of a system to ‘bounce-back’ or return to its pre-shock position (Box 1.2). The faster the economy returns to its pre-shock position the more resilient it is. Whilst this offers a compelling view of resilience in the short-term, it may be less instructive over the medium to longer term.
Box 1.2 Depicting resilience
The simple model of economic resilience is illustrated below. In this model, following an economic shock at point A recovery occurs at point C1, when employment (or output) regains its pre-shock peak level (P1). The time taken to recover is given by D1 + D2; whilst the duration of the whole business cycle is given by D. H1 signifies the amount of economic output or employment lost during the economic downturn. The model does not consider notions of adaptive capacity, nor the time it takes to return to levels of pre-crisis activity levels.
Here, a second definition of resilience is appropriate. This is based on an adaptive notion of resilience, where resilience is defined as the ‘the ability of the region’s industrial technological, labour force and institutional structures to adapt to the changing competitive, technological and market pressures and opportunities that
confront its firms and workforce’2. Regional economic resilience from this
perspective is conceived as a multi-dimensional property embracing not only
Economic
resilience is
the ability
of an
economy to
withstand,
absorb or
overcome
an economic
shock
In the
longer run,
economic
resilience is
determined
by the
adaptive
capacity of
an economy,
which
affects its
ability to
maintain a
long-term
growth path
ESPON ECR2 FINAL REPORT 20 recovery from the shock and resistance (the ability of regions to resist disruptive shocks in the first place), but also re-orientation (the extent to which the region adapts its economic structure), and finally, renewal (the degree to which the region resumes the growth path that characterised its economy prior to the
shock)3. Shocks can thus have both temporary and lasting ‘hysteretic’ impacts on
system functioning4.
Whilst the notion of recovery is a powerful popular indicator for a resilient economy, it leaves a number of questions to be addressed about the intended state of recovery after a shock; the required adaptations in regional economies, or
indeed when relevant crises and transformations can be considered to be over5.
For many, regional economic resilience has a subjective component, with resilience goals the subject of social construction, particularly at the political
level6. For example, research in America has found that the perceptions of leaders
in a region about a region’s resilience may differ from measured economic
performance7.
It is worth noting that resilience to an economic shock does not necessarily imply that the economy is otherwise strong and performing well over the longer-term. It is simply a measure of how the economy responds to a particular economic shock. Resilience may thus differ from economic growth. Equally, regions that experience a very tight labour market prior to a shock may appear to be less resilient (owing to the difficulty of returning to artificially high employment rates).
Furthermore, there may be a trade-off between resilience in the short-term and over the longer-run, as an economy that appears resilient in the short-term may simply be papering over fundamental faultlines, constraining adaptation, and prove to be less resilient in the longer-term. A resilient regional economy may also be undesirable if it is characterised by unsustainable growth or behaviour, widespread inequality or excessive economic fluctuations, or social ills associated with continual upheaval and change.
1.4 Measuring resilience
With the increase in popularity of the concept of resilience has come a plethora of means by which this might be measured. Indexes of resilience are increasingly popular with academics and policy-makers, seeking to demonstrate how one place is more resilient than another. Whilst these have their strengths they remain largely unproven. In fact, past indexes proved remarkably inaccurate in predicting the resilience of economies to the most recent economic crisis. One reason for this is that every crisis is different, making it hard to know which factors are likely to promote resilience and which might constrain it. Also, the
Definitions
of resilience
can have a
subjective
component
An economy
that is
resilient in
the
short-term may
not be so in
the
longer-term.
The longer
you can
resist, the
more time
you have to
adapt
unique combination of features within individual economies makes it difficult to predict how these will interact to promote or constrain resilience outcomes.
Within this report we assess the resilience of regional economies to the economic crisis through the use of two principal indicators: the number of persons employed and levels of economic output (GDP). Neither are perfect, but overall they offer more strengths than weaknesses. Our preference is a measure of resilience based on the number of persons employed, particularly in the short-term. This reflects the commonly-held perspective that having a job is better than having no job, and acknowledges the social costs associated with employment loss. People tend to relate more readily to this as an indicator of economic strength than they do to measures of economic output, such as GDP or GVA. However, we recognise that economic output levels are, themselves, a widely-accepted measure of economic performance, and one which may give a better indication of the overall resilience of an economy over the longer-term.
One alternative measure of economic resilience could be levels of registered unemployment. This offers a strong indicator of the ability of an economy to offer employment opportunities and overcomes the criticism that high pre-crisis levels of employment may have been unsustainable. However, as we are seeking to measure the resilience of the economy we prefer the direct employment measure. A second alternative measure might be in terms of household income levels. Again, there are strong arguments in favour of this, particularly over the longer-term. In the short-term, however, there may be a trade-off in income retention and employment levels. Consequently, for the purposes of this study, we have favoured employment retention, or recovery, as the key goal.
On this basis, economic resilience is defined as the ability of a region to avoid a fall in economic activity or to regain pre-crisis (or pre-shock) peak levels of employment (or GDP). We include two categories of resilient territories: those that resisted the crisis (RS) and those that recovered from the crisis (RC). We also include two categories of regions that were not resilient to the crisis: those that have begun their recovery, but where employment (or GDP) has not yet returned to pre-shock levels (NR1) and those that remain in decline (NR2). Here we use the simple definition of resilience – the ability of an economy to withstand or recover from an economic shock. We have taken a time period of three years as our timescale in which recovery should occur.
Resilience is
not some
form of
league table
with
regional
rankings.
Rather,
there are
regions that
have proven
to be
resilient and
those that
have not.
ESPON ECR2 FINAL REPORT 22 Figure 1.2Regional Resilience Categories
Status Category Abbr. Description
Resilient Resistant RS Resisted an economic downturn
ie no fall in numbers employed
Recovered RC Recovered to pre-crisis activity
levels (within 3 years of the original downturn)
Non-Resilient
Not Recovered: Upturn NR1 Activity levels now rising but
not achieved pre-crisis levels within 3 years of the original downturn
Not Recovered: No
upturn
NR2 Activity levels continuing to
decline 3 years after the original downturn
2
TERRITORIAL IMPACT OF THE ECONOMIC CRISIS
2.1 The NICE decade comes to an end
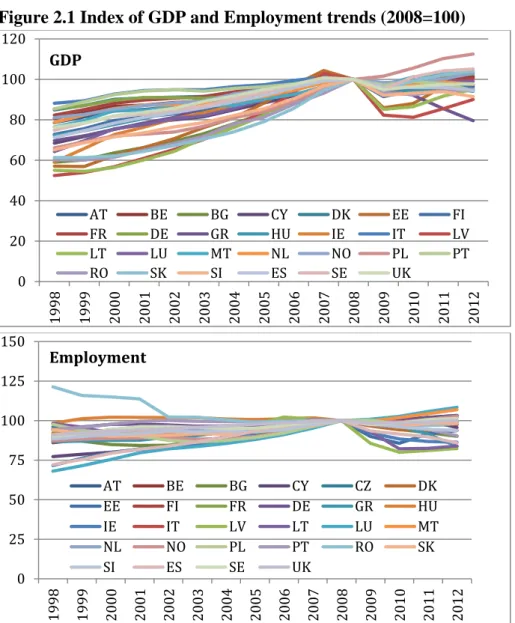
Following an almost unprecedented period of sustained economic growth across Europe, the impact of the global economic crisis was sudden and widespread. Economic output contracted across all ESPON members apart from Poland, bringing to a halt the widespread growth experienced since the 1990s (Figure 2.1). Employment losses swiftly followed the fall in economic output, with overall numbers in employment recording a fall in 2009. The path to recovery since then has been slow for most states, with emerging evidence of a long stagnation.
Figure 2.1 Index of GDP and Employment trends (2008=100)
0 20 40 60 80 100 120 1998 1999 2000 2001 2002 2003 2004 2005 2006 2007 2008 2009 2010 2011 2012 AT BE BG CY DK EE FI FR DE GR HU IE IT LV LT LU MT NL NO PL PT RO SK SI ES SE UK GDP 0 25 50 75 100 125 150 1998 1999 2000 2001 2002 2003 2004 2005 2006 2007 2008 2009 2010 2011 2012 AT BE BG CY CZ DK EE FI FR DE GR HU IE IT LV LT LU MT NL NO PL PT RO SK SI ES SE UK Employment
ESPON ECR2 FINAL REPORT 24 2.2 Early onset and later entrants
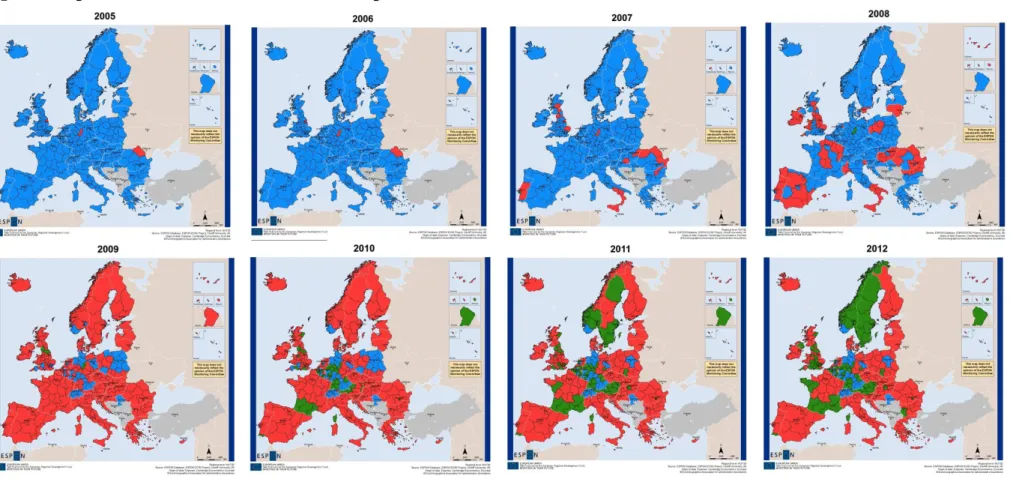
Whilst the ESPON economy as a whole entered into recession in 2008/09, some regions experienced an economic downturn in the years immediately preceding this. As Figure 2.2 illustrates, economic decline was being experienced in a small number of regions in 2005 and 2006. The number of regions experiencing a decline in employment levels picked up rapidly in 2007 and 2008 as the full effects of the crisis took hold, before reaching a peak in 2009. Since 2009 there has been a gradual increase in the number of regions recovering to their pre-crisis levels of employment, although Figure 2.2 also vividly illustrates the long-lasting effects of the crisis across large parts of the ESPON territory, and the fact some regions in Poland that withstood the crisis have more recently begun to experience employment decline.
2.3 Employment losses unevenly distributed
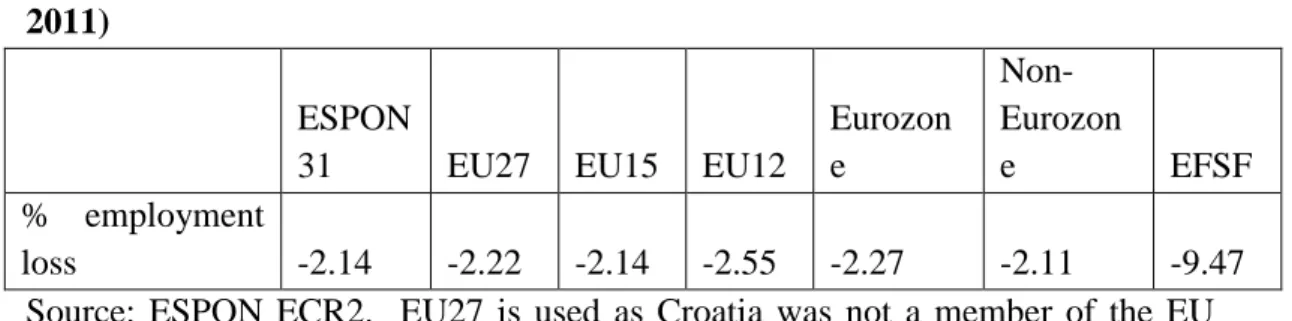
Across the ESPON area (ESPON 31) total employment fell by 2.14% by 2011, with the EU15 experiencing a similar decline (Table 2.1). The experience of the Member States that have joined the EU post 2004 is somewhat worse, with an average fall in employment of 2.22%, despite the better performance of the Polish economy. This is dwarfed though by the difficulties evident in the Member States that sought assistance from the European Financial Stability Fund, where employment levels fell by almost a tenth. Membership of the Euro currency unit (the ‘Eurozone’) has also been associated with a slightly stronger fall in employment than for non-euro States.
Table 2.1 Employment decline across territorial groupings (%, peak year to 2011)
ESPON
31 EU27 EU15 EU12
Eurozon e Non-Eurozon e EFSF % employment loss -2.14 -2.22 -2.14 -2.55 -2.27 -2.11 -9.47
Source: ESPON ECR2. EU27 is used as Croatia was not a member of the EU until 2013.
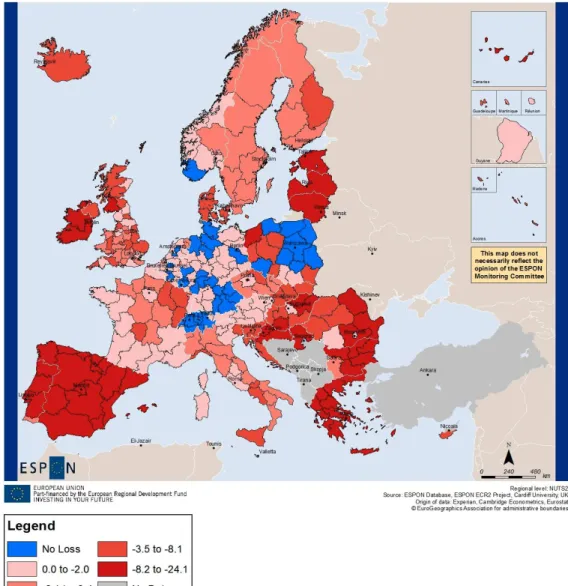
The severity of the crisis has varied within the ESPON territory, with some regions being affected more strongly than others. The spatial distribution of employment loss is illustrated in Map 2.1, highlighting a strong peripheral geography to the most severe employment losses.
The spread
of the
economic
crisis peaked
in 2009, but
recovery has
been slow
Figure 2.2 Spread of the crisis across the ESPON Space
ESPON ECR2 FINAL REPORT 26 Map 2.1 Employment loss during the crisis (2004-2012, NUTS 2)8
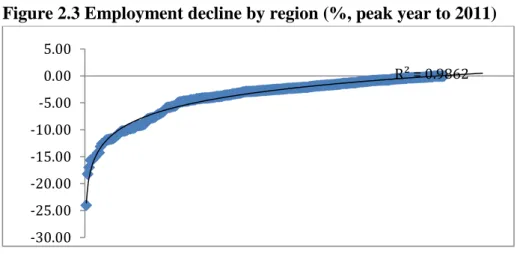
Figure 2.3 illustrates the proportionate fall in employment in each region. Whilst employment levels fell by less than 5% in most regions, a small number of regions have been affected much more adversely. The most extreme case is Latvia, which has recorded a total fall in the number of persons employed that is approaching a quarter of the numbers employed at the peak of the boom. The distribution of employment changes across regions is non-linear and takes a logarithmic form, suggesting that there is a strong reinforcement mechanism at work. This finding is strengthened by the experience of many Greek regions, where recent data suggests that employment losses continue to mount.
Employment
losses have
been
concentrated
in a small
number of
regions and
states
Figure 2.3 Employment decline by region (%, peak year to 2011)
Source: ESPON ECR2
The effects of the crisis are not necessarily evenly distributed within countries, although this can be the case. Figure 2.4 illustrates the distributional impact of the crisis within countries as indicated by the spread of employment losses between those regions most heavily affected within each country and those least affected. The median point within each country is indicated by the bar. We have excluded single region countries, including only those countries containing more than one NUTS 2 region.
Whilst countries like Austria, Belgium, Denmark, Finland and Sweden all exhibit a relatively small range in terms of the recorded employment impact of the crisis, a much wider range of experience is visible in countries such as Spain, Bulgaria and Poland. Whilst the differential between regions might be expected to be less in small two-region economies this is not always the case, as demonstrated in Slovenia.
Figure 2.4 Regional employment loss within selected ESPON states
Source: ESPON ECR2
R² = 0.9862 -30.00 -25.00 -20.00 -15.00 -10.00 -5.00 0.00 5.00 -20 -15 -10 -5 0 5 10 A us tr ia B el gi um B ul ga ria Cze ch R epub lic De nm ar k Fin la nd Fr an ce G er ma ny G re ec e Hun ga ry Ir el an d Ita ly N et he rl an ds N or w ay Po la nd Po rtuga l R oma nia Sl ova kia Sl ove ni a Sp ai n Sw ede n UK
Within
country
variation
is also
strong in
many
cases
ESPON ECR2 FINAL REPORT 28 2.4 Widening disparities and rising unemployment
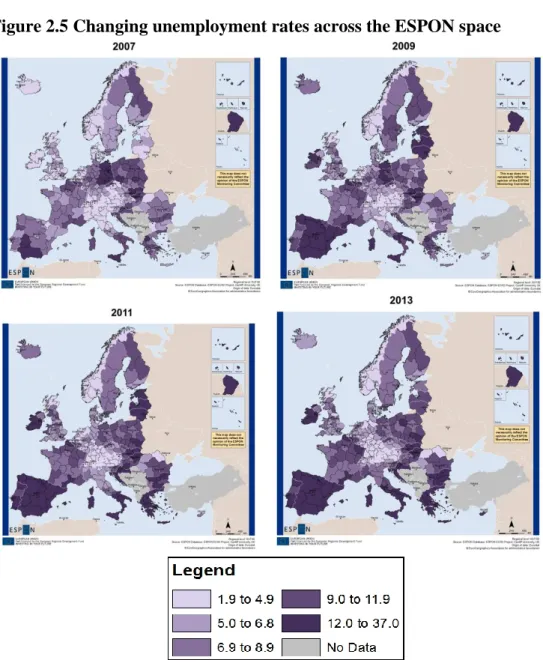
Amongst the headline effects of the crisis have rising levels of unemployment. An initial reduction in unemployment rates across the EU in 2010 proved shortlived as the developing fiscal crisis led to a further rise in recorded levels, with the median rate of registered unemployment reaching 8% in 2011. The first signs of a fall in unemployment have begun to emerge in 2013, although this is not uniform across the ESPON space. As evidenced in Figure 2.5, which illustrates the changing pattern of unemployment across the ESPON space over the course of the crisis.
Figure 2.5 Changing unemployment rates across the ESPON space
Whilst unemployment rates have generally risen, actual rates of unemployment remained low (below 4%) in 17% of regions even at the height of the crisis (Table 2.2), demonstrating once again the unevenly distributed effects of the crisis.
Table 2.2 Regional rates of unemployment (2007 and 2011, NUTS 2)
Unemployment rate (%) Number of Regions (2007) Number of Regions (2011)
0-4 75 48
5-9 158 134
10-19 53 93
20-30 1 14
Source: ESPON ECR2
Within countries, there has been a reduction in the range of unemployment disparities in a small number of countries (Austria, Germany, Finland, the Netherlands and the Czech Republic) and they have remained the same in others (Belgium, Denmark, Poland and Slovenia). However, this is outweighed by the larger number of countries where disparities have risen between 2007-11 (Table 2.3).
The highest rises have been in Norway, Switzerland and Ireland, all countries where disparities did not previously exist (and so are disproportionately represented by the calculation). Table 2.3 illustrates that the reduction in
disparities has relied on peak rates of unemployment9 falling (or remaining the
same) rather than faster rising rates of unemployment in better performing regions. Only in the Czech Republic has this latter case been evident.
Table 2.3 Change in peak regional unemployment and disparities within states (2007-11)
Lower peak unemployment
No Change Higher peak
unemployment Widening disparities
FR, EL, IE, HU, IT, ES, SE, SK, PT, UK, BU, RO, NO, HR, CH
No change BE, PL SL, DK
Narrowing disparities
AT, DE, FI NL CZ
One of the real impacts of the crisis has been the dramatically rising level of youth
unemployment, particularly, but not only, in Spain, Portugal and Greece10.
Concentrations of youth unemployment are visible across much of the EU, outside of the core heartlands of Germany, Austria and the Netherlands. Rates of youth unemployment are particularly affected by labour market opportunities, but also by labour market policies and practices, which can preferentially protect older workers at the expense of younger workers on more flexible contracts.
ESPON ECR2 FINAL REPORT 30 In a further sign of the uneven effects of the crisis, Figure 2.6 demonstrates that whilst income inequalities have worsened in many countries they have also improved in just as many. Particular adverse effects are visible in Cyprus, Estonia, Greece, Italy and Spain, where above average levels of inequality have worsened.
Figure 2.6 Evolution of income inequalities (Gini coefficient after social benefits and pensions 2012, Gini growth rate 2008-2012)
Source: Eurostat (ilc_di12)11
2.5 Fall and rise of trade, exports and inward investment
One immediate impact of the crisis was falling levels of credit availability as banks faced a crisis of liquidity and confidence. This affected private firms who were unable to access credit terms or investment finance. This, together with falling levels of confidence, led to reducing level of trade and falling volumes of inward investment. The decline in inward investment flows occurred both within the EU and from sources outside the EU. The gradually recovery of inward investment flows from within the EU from 2009 and from external locations from 2010 highlights the recovery of the global economy. However, levels of domestic demand for products in the EU remain depressed, reflecting the tight economic conditions of EU markets in the face of austerity policies and high levels of household debt in many countries.
Economic
shocks do
not always
exacerbate
inequalities
2.6 Employment losses in construction, primary industries and manufacturing industry
Although total employment in the ESPON space has fallen during the crisis (by around 2%), this is not evenly distributed across sectors (Figure 2.7). Employment in sectors which have experienced job losses during the period of the crisis peaked in 2008, which has informed our choice of dates for the following analysis. Across the ESPON space, job losses during the crisis have been concentrated in the construction sector (NACE F) and the real estate sector (NACE L), reflecting the significance of the collapse in the property ‘bubble’ at the outset of the crisis. Other sectors that were badly affected included manufacturing industries (NACE B-E) and primary industries (NACE A). The number of persons employed in ICT (NACE J), Professional, scientific and technical services (NACE M-N) and Arts, entertainment, recreation and other services (NACE R-U) increased over this period; with public sector employment sectors (NACE O- Q) also registering a slight increase.
Figure 2.7 Employment losses by sector (NACE2, 2008-11)
Source: ESPON ECR2
Experience across the ESPON space varies. Whilst industrial sectors (NACE B-E) recorded employment losses across all countries, all other sectors experienced growth in at least one country). Equally, although five sectors recorded employment gains across the ESPON space, all recorded losses in particular countries. The significance of employment falls for some sectors in particular countries is evident for both the construction sector (NACE F) and Real Estate activities (NACE L). Mean employment change for the sector is represented by the bar (Figure 2.8).
-14 -12 -10 -8 -6 -4 -2 0 2 4 6
A B-E F G-I J K L M-N O-Q R-U
Some
sectors
were much
more
affected
by the
crisis than
others
But
experience
also
differed by
country
ESPON ECR2 FINAL REPORT 32 Figure 2.8 Variations in sectoral employment change across countries (Max-Min by country, %)
Note: omits outlier of 60% increase in Real Estate (L) employment in Bulgaria. Source: ESPON ECR2
2.7 Increasing indebtness overall, but some exceptions
Across the EU, the gradual decline in household debt as a proportion of income during the economic boom came to an abrupt halt as household incomes fell and their debts rose (Figure 2.9).
Figure 2.9 Ratio of gross household debt to income (EU28)
Source: adapted from Eurostat (nasa_ki)
The aggregate figure for the EU hides some strong differences between countries (Figure 2.10). In four Member States levels of personal debt, relative to household income, have generally declined over the period of the crisis, although this is the exception. In most Member States, the debt:income ratio rose. It did so sharply, from comparatively low ratios, in the case of the Baltic Member States, before falling back. In three Member States, debt:income ratios continue to rise, whilst in a further two levels have only recently started to decline.
-60 -50 -40 -30 -20 -10 0 10 20 30
A B-E F G-I J K L M-N O-Q R-U
0.00 2.00 4.00 6.00 8.00 10.00 12.00 14.00 2003 2004 2005 2006 2007 2008 2009 2010 2011 2012
The crisis led
to a rise in
household
debt and to
levels of
government
debt
Figure 2.10 Patterns of household debt:income ratio during the crisis
Source: adapted from Eurostat (nasa_ki) -10.00 -5.00 0.00 5.00 10.00 15.00 2006 20072008 2009 20102011 2012
Latvia Lithuania Estonia
0.00 5.00 10.00 15.00 20.00 2006 2007 2008 2009 2010 2011 2012 Slovenia Austria Italy Netherlands 0.00 5.00 10.00 15.00 20.00 2006 2007 2008 2009 2010 2011 2012 Germany France
Belgium Czech Republic
0.00 5.00 10.00 15.00 20.00 25.00 30.00 2006 2007 2008 2009 2010 2011 2012
Ireland Cyprus Slovakia
Spain Finland Hungary
0.00 5.00 10.00 15.00 20.00 2006 2007 2008 2009 2010 2011 2012
Denmark Norway United Kingdom
ESPON ECR2 FINAL REPORT 34 The general trend of increasing indebtedness during the crisis, is mirrored by a trend of rising general government debt. By 2012, the ratio of Government debt to GDP had reached almost 160% in Greece. In contrast, in Estonia, also badly affected by the economic crisis, Government debt was just 10% of GDP. In two States (Sweden and Norway) there has been a noticeable decline in debt levels over the period of the crisis, whilst in other states, levels of Government debt are beginning to fall after rising during the crisis itself. Debt levels in Portugal, Greece, Ireland and Cyprus strongly increased between 2009-12.
2.8 Reduced working hours and rising levels of low work households
The crisis has been marked by a slight rise in the proportion of people living in households with very low work intensity, where adults worked less than 20% of their total work potential. Significant increases in low work intensity households were recorded in Iceland, Lithuania, Spain, Latvia and other economies badly hit by the crisis. In contrast, reductions in the proportion of the population living in low work intensity households can be seen in Germany Poland and Austria, as well as the Czech Republic and Austria. In 2012, the top five countries in terms of the proportion of their population living in low work households were: Ireland
(24.2%12), Croatia (16.2%), Spain (14.3%), Greece (14.2%), Belgium (14.1%) and
the UK (13%).
Overall, the crisis has also been marked by a slight increase in the number of hours worked (by 1% between 2005 and 2011). There is though a strong disparity in experience across the ESPON space, with the fall in the number of hours worked in 12 of the worst affected economies matched by a rise in hours in 14 economies.
2.9 Rising household incomes, but mixed messages for proportion of population at risk of poverty
Across the ESPON space average disposable household incomes have risen by around 12% between 2005 and 2012. However, examining the period between the pre-crisis peak (2008) and 2012 the rise is around 6%. During this period household disposable incomes have fallen in eight countries, with significant falls recorded in Greece, Ireland, Romania, Latvia, Spain and Hungary (Figure 2.11). In Ireland and Greece household disposable incomes were lower than was the case in 2005, the only two economies where this was so in the ESPON space. The principle increases in household disposable income was to be found in Switzerland, Norway and Sweden.
Falling levels
of work and
declining
household
incomes are
significant
problems in
some
economies
Figure 2.11 Change in total household disposable income (2008-12, %)
Source: Adapted from Eurostat (nasa_nf_tr)13
One possible consequence of the economic crisis is an increase in the proportion of
the population at risk of poverty. The ESPON TiPSE14 project suggests that this is
concentrated in southern Europe, but with important ‘hotspots’ identifiable elsewhere. Drawing on material from Eurostat, TiPSE identifies the significance of national welfare regimes as a mediator of the extent to which national populations are exposed to the risk of poverty.
2.10 Changing migration patterns
Overall there has been a reduction in levels of migration across the ESPON space, as labour markets tightened and changing economic circumstances reduced the
attractiveness of late-career migration. According to the ESPON ATTREG15
project, many of the regions most affected by the crisis continue to experience net in-migration. The net migration figures available at a regional level, are not able to distinguish local effects, such as those highlighted in some of the case studies for this work, nor the reported out-migration of young adults from Spain, Ireland and other struggling economies in search of work in the more vibrant economies of countries such as Germany and, more often, globally.
2.11 Negative perceptions of the future
One of the under-reported elements of the economic crisis is individuals’ perceptions of the economic climate they face. These perceptions can have an important influence on individual and household consumption patterns, as people make decisions on what they anticipate the duration and severity of an economic downturn may be. Qualitative data can also provide insights into the effects of the crisis on the incomes available to households.
-30 -20 -10 0 10 20 30 40 G re ec e Ir el an d R oma nia La tvia Sp ai n Hun ga ry Ita ly Po rtuga l Cr oa tia Sl ove ni a Lithua nia N et he rl an ds Po la nd Euro a re a (17… Cypr us Es ton ia Cze ch R epub lic Euro pe an Un ion … Fr an ce A us tr ia B el gi um G er ma ny B ul ga ria De nm ar k Sl ova kia Un ite d K in gd om Fin la nd Luxe mb our g Sw ede n N or w ay Sw it ze rl an d
ESPON ECR2 FINAL REPORT 36 In 2009 residents of the Baltic States were feeling least secure in their employment prospects, by 2011 this had changed to residents of Greece and Cyprus, with residents of Slovakia persisting in their feelings of insecurity (Figure 2.12).
Figure 2.12 Proportion of respondents Not At All or Not Very Confident in their ability to keep their job (%)
Source: adapted from Eurobarometer Flash EB no 286 (2010) and Flash EB no 338 (2012) Fieldwork in 2009 and 2011 respectively
In terms of the effect that the economic crisis is having on different parts of the EU, a survey undertaken in 2010 gives a very strong indication of the varying territorial impact. When asked whether the crisis was having a major impact or no impact, more than 80% of respondents in Hungary, Romania and Greece felt that it was having an important impact. In contrast, respondents in Sweden, Denmark, Germany, Austria, Finland, Netherlands and Luxembourg were most likely to feel that the crisis was having no impact on their personal situation.
Looking forwards from the 2012, most citizens of the EU believed the worst of the crisis remained ahead of them. This was particularly the case in Spain, Greece, Portugal and Cyprus, but also includes citizens of Sweden, Belgium and Luxembourg (Figure 2.13). Only in seven countries did most citizens believe that the worst is now past, and even here it was, on the whole, a fairly slim majority.
Figure 2.13 Proportion of residents who believe worst of crisis is still to come
Source: adapted from Standard Eurobarometer 78 (2012 Autumn) 0 10 20 30 40 50 60 LT LV EE SK BG ES PL EL PT RO CY HU IE IT FR MT CZ EU27 BE SI SE LU UK AT DE DK NL FI 2009 2011 0 50 100 SE SK BE CY FR RO CZ LU DE DK PL FI SI € A R EA LT EU27 ES EE NL EL PT AT N ON € A R EA HU LV IT BG IE MT UK
Expectations
and
confidence
have also
suffered
during the
crisis
3
THE ECONOMIC RESILIENCE OF REGIONS
Since the onset of the economic crisis the resilience of regions to the economic shock has been a pressing concern. In the following section we consider the extent to which economies were able to withstand the crisis, or have been able to recover to pre-crisis levels of economic activity.
3.1 Weak levels of resilience to the economic crisis across the ESPON territory Across the ESPON territory four countries, Luxembourg, Germany, Switzerland and Poland, have resisted the economic crisis and maintained, or increased, levels of employment in the period of the recent crisis. Only Poland also managed to maintain or increase its level of GDP (Table 3.1). By 2011, eight countries had recovered to their pre-crisis peak of GDP activity, and five to their pre-crisis level of employment.
Table 3.1 National patterns of resilience to the 2008 economic crisis
Employment measure GDP measure
Resisted LU, DE, CH, PL PL
Recovered NO, SE, MT, AT, BE DE, NO, SE, CH, AT,
FR, MT, SK
Not Recovered: upturn IS, UK, FR, NL, IT, FI,
LT, EE, CY, CZ, SK, HU
IS, UK, IE, LU, NL, PT, ES, IT, DK, FI, EE, LV, LT, CZ, SL, HU, RO, BU, CY
Not recovered: no upturn IE, PT, ES, DK, LV, SL,
HR, RO, BU, EL
HR, EL
Of the 280 regions considered, more than a tenth (12%) had weathered the crisis and not experienced any fall in numbers employed, whilst almost a quarter (23%) had experienced a fall in employment but, by 2011, had recovered to the pre-crisis peak. Two-thirds of regions were still to recover by 2011, divided evenly between those that had passed the trough of the downturn, and those still to register the end of employment decline. The distribution of regional economic resilience is set out in Map 3.1, which illustrates a strong geography of resilience, clearly influenced by national patterns. However, important pockets of recovery and non-recovery are also apparent within this overall geography.
Focusing on those regions that have recovered to their pre-crisis employment levels, the average duration for this is 2.6 years. Whilst this currently captures the
Two out of
three
regions
were still to
recover to
their
previous
employment
levels by
the end of
2011
ESPON ECR2 FINAL REPORT 38 most responsive economies it does provide a benchmark for resilience against which comparisons can be made. Significantly, given that almost two-thirds of economies experienced peak employment in 2008, with downturn recorded in 2009, we should expect to see their recovery in 2012 if average performance is maintained. However, for this to occur we would expect to have witnessed the beginnings of an upturn by this stage. This is not the case for all of those regions categorized as NR2 – not recovered: no upturn. Only 10 regions entered the downturn post 2009, for these we would not necessarily expect recovery by 2011.
Map 3.1 Distribution of regional economic resilience (NUTS 2, employment, peak year to 2011)
3.2 Localised patterns of resilience
Resilience can also be a more localized phenomena, with neighbouring areas experiencing different patterns of resilience, depending upon specific local particularities (Box 3.1). Overall, a slightly greater proportion of NUTS 3 territories have resisted the crisis than is the case at the NUTS 2 scale, and a
National
level effects
are strong,
but
resilience is
also a local
phenomena
slightly lower proportion of those that had not yet recovered have begun an economic upturn (Table 3.2).
Table 3.2 Employment Resilience of NUTS 3 Territories
Resilience Number of regions Proportion (%)
Resistant (RS) 214 16.19
Recovered (RC) 314 23.75
Not recovered but in upturn 364 27.53
Not recovered and no upturn 430 32.53
Source: ESPON ECR2 (n=1,322)
Although national paths predominate, clear differences emerge in some ESPON states (Map 3.2).
Map 3.2 Localised patterns of resilience (NUTS 3, employment, peak year to 2011)