Dominant Designs and the Survival of Firms Fernando F. Suarez James M. Utterback April 1991 Revised July 1992 WP # 42-91 t, i z I . Sloan WP #3340-91
© 1991 Massachusetts Institute of Technology
Sloan School of Management Massachusetts Institute of Technology
38 Memorial Drive, E56-390 Cambridge, MA 02142-1347
ACKNOWLEDGMENTS
The authors wish to thank several people for important help. Dr. Ingrid Munck at Statistics Sweden and Prof. Michael Rappa at MIT for their valuable suggestions at the early stages of this research; Prof. John B. Willett at Harvard and Prof. Lisa Lynch at MIT for their comments on the statistical methods employed; and Professors Richard Rosenbloom at Harvard and Richard Langlois at University of Connecticut for helpful comments on an earlier draft. Errors and omissions remain the
responsibility of the authors.
Fernando F. Suirez
Sloan School of Management Massachusetts Institute of Technology
Room E52-539 50 Memorial Drive Cambridge, MA 02139 Phone (617) 253-3721 * Fax (617) 253-2660 E-mail: FSuarez@Sloan.mit.edu and James M. Utterback School of Engineering
Massachusetts Institute of Technology Room E52-541
50 Memorial Drive Cambridge, MA 02139
Introduction
The question of why some firms die while others survive is one of the basic concerns of business scholars. Survival or long term viability has long been
recognized as a basic goal for a business organization (Barnard 1947, Dertouzos et al. 1989). Survival is, at least in the long term, a prerequisite for success in other terms, such as market share and profitability.
The survival of firms has traditionally been studied indirectly through economics research on industry business cycles and analysis of declining industries (see, for instance, Lieberman 1990 and Dunne, Roberts, and Samuelson 1989). Firm survival has recently been studied more systematically by researchers in strategy and
population ecology. Advocates of population ecology have argued that life chances of organizations are affected by the population density at time of founding and throughout the life period of an organization. According to this argument,
organizations founded during periods of high density have persistently higher age-specific rates of mortality than those founded during periods of low population density (Carroll and Hannan 1989, Hannan and Freeman 1988). In other words, a firm entering a crowded field has lower chance of survival than one entering a less competitive field. Population ecologists have not only studied the effect of density on the risk profile of an organization, but also on the founding rate of new
organizations. Currently, this research argues that the effect of density over birth and death of organizations varies over time (Carroll and Swaminathan,
forthcoming). In a related stream of literature, researchers in strategy have proposed that a firm's survival is linked to factors such as entry timing (Mitchell 1991) and financial strength (Willard and Cooper 1985).
We argue that the economic, population ecology, and strategy perspectives on firm survival must be complemented by a body of literature that has studied similar phenomena from the point of view of technology evolution and cycles (Utterback and Abernathy 1975, Abernathy and Utterback 1978, Utterback and SuArez 1992). The hypothesis we intend to test is that the competitive environment of an
industry, and therefore the survival of its firms, is substantially affected by the evolution of the technology on which an industry is based, and particularly by the emergence of what Utterback and Abernathy (1975) termed a "dominant design." An implication of this idea is that population density could be thought of as being a reflection of underlying technological changes that shape the form and level of competition, the attractiveness of entry, and ultimately the structure of an industry. In this paper we explore the feasibility of our claims by applying survival analysis to data from six industries, concentrating on one specific hypothesis derived from the model of technological evolution advocated here. The results suggest that the emergence of a dominant design in an industry has a strong and significant effect on firms' survival. The results also lend additional support to some of the above-mentioned hypotheses of economists, strategists and population ecologists regarding firms' survival.
What is a Dominant Design?
The point of departure for our work is the idea that dominant designs occur which shift the terms of competition in an industry.l We hypothesize that the peak of the total population curve for any industry manufacturing assembled products in the United States will occur around the year in which a dominant design emerges in that industry. A dominant design has the effect of enforcing standardization so that production economies can be sought. Effective competition can then take place on the basis of cost as well as product performance (Utterback and Abernathy, 1975). A dominant design will embody the requirements of many classes of users of a
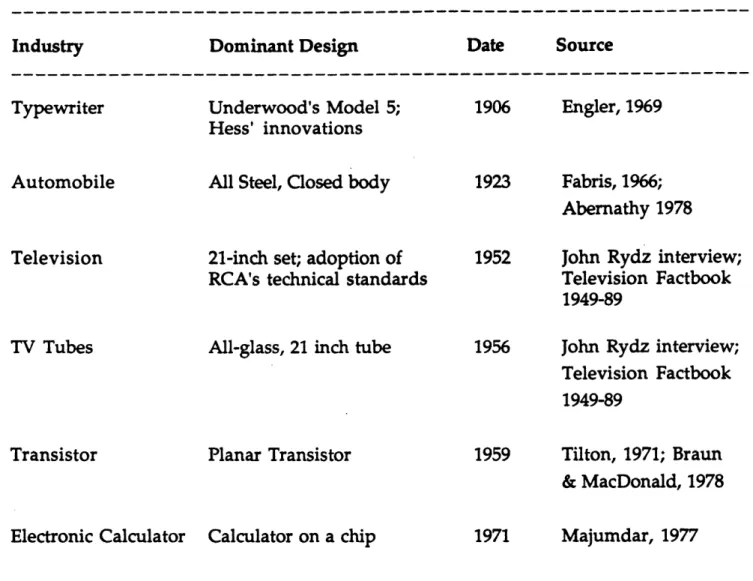
particular product, even though it may not meet the needs of a particular class to quite the same extent as would a customized design. Nor is a dominant design necessarily the one which embodies the most extreme technical performance. A dominant design will, however, represent a milestone or transition point in the life of an industry. Table 1 provides the sources from which we have identified and surmised dates of the dominant designs for each industry considered in this paper.
TABLE 1 ABOUT HERE (d. d. dates)
We think that the emergence of a dominant design is the result of a fortunate combination of technological, economic, and organizational factors. A dominant design is not always that design which has greatest "technological sweetness." The notion of dominant design is related to the notion of a"standard" which has
received a great deal of attention in the literature lately. However, a standard is seen largely as a the result of a battle among different technical alternatives (such as
different computer architectures), as opposed to the broader notion we have in mind with the dominant design concept. When standards are defined broadly, such as "that which is accepted for current use through authority, custom or general consent" (Hemenway 1975), the two concepts come closer together. In such cases, and by implication, a dominant design becomes the industry standard or, for complex assembled products with many parts, embodies a collection of related standards. The notion of dominant design as industry standard opens the door for factors other than technology to influence the adoption of a given design as
dominant, in particular:
* possession of collateral assets
* industry regulation and government intervention * strategic maneuvering at the firm level
* existence of bandwagon effects or network externalities in the industry
The evolution of technology seems related to each of the above factors in important ways. Collateral or co-specialized assets (Teece 1986) seem to have a two-way
relationship with the emergence of a dominant design. On the one hand, a firm in possession of collateral assets such as market channels, brand image, and customer switching costs will have some advantage vis a vis its competitors in terms of enforcing its product as the dominant design. The experience of IBM in the
4
personal computer industry is a case in point. On the other hand, the value of collateral assets to a firm will be greater after a dominant design is in place. That is, there are more incentives for a firm to acquire collateral assets after it knows its design has become dominant. Thus, the opposite relationship may also hold: a dominant design will tend to stimulate the creation or acquisition of collateral assets, which in turn will strengthen its dominance.
Industry regulation often has the power to enforce a standard, and thus define a dominant design. For instance, the FCC's approval of the RCA television broadcast standard worked to the advantage of RCA by establishing its design as dominant for the television industry. The role of the government in the emergence of a
dominant design need not be restricted to regulation. Government purchases of a product in the early stages of an industry, for instance, may tilt the balance in favor of the firm or firms producing it, and make this product more likely to become the dominant design of the industry. Given the importance of industry standards to the fate and prosperity of firms in an industry, government decisions that favor a given design often tend to be accompanied by a political battle among the firms involved. At the firm level, and apart from technology itself, there are also factors that can affect the emergence of a dominant design. The type of strategy followed by a firm with respect to its product vis a vis that of competitors may determine which firm's product becomes dominant. This is what Cusumano, Mylonadis, and Rosenbloom (1991) have called "strategic maneuvering." Indeed, VCRs are a crisp example of the importance of strategy. One of the reasons why the VHS system backed by JVC swept the VCR industry instead of Sony's Betamax is the different strategies
followed by these two firms. While JVC followed an "humble" strategy establishing alliances first in Japan and then in Europe and the U.S., Sony stressed reputation and deliberately avoided alliances or contracts to be an OEM supplier. According to Cusumano, Mylonadis, and Rosenbloom, it was primarily JVC's strategy, and not technological advantages, initial collateral assets, or government regulation that finally made VHS the dominant design in the industry. In fact JVC was a late-comer, and until the mid seventies it lagged technologically.
Prior to the appearance of a dominant design economies of scale will have little effect, because a large number of variants of a product will be produced by the many competing entrants in an industry with each producing at relatively small scale. Once a dominant design is created, economies of scale can come in to play with powerful effect, leading to rapid growth of those firms which most competently master the development of products based on the dominant design, to the detriment of those firms which are slower to adapt. In general, we think that
economies of scale are of primary importance after a dominant design is in place. In other words traditional microeconomic arguments hold more weight following the date of a dominant design. Our view is that traditional economic assumptions about economies of scale are much more appropriate to the period following a dominant design than to the period of experimentation and creative turbulence which precedes it.
A notable exception to the previous statement is provided by cases in which significant bandwagon effects or "network externalities" exist in the industry. Positive network externalities arise when a good is more valuable to a user the
more users adopt the same good or compatible ones (Katz and Shapiro 1985, Tirole 1988). Thus, in the presence of bandwagon effects, volume sales and economies of scale will indeed play a major role in the determination of a dominant design. Firms which are able to achieve larger scale more quickly than their competitors may have a better chance of winning the race to settle the standard.2 Moreover, the impact of strategic maneuvering at the firm level on the determination of the industry's dominant design is greatly enhanced by the existence of bandwagon effects in the industry. In the presence of bandwagon effects, strategic maneuvering is a powerful force driving the emergence of a dominant design, as the case of VCRs described above illustrates.
6 How does technology evolve so that a given design becomes the dominant one? Prior to the appearance of a dominant design many of its separate features may be tried in varied products which are either custom designed or designed for a
particular and demanding market niche. The turbulent competitive process through which many firms enter and some leave an industry may be seen as a
process of experimentation, with each product introduction viewed as a new
experiment on user preference (Klein 1977). Performance dimensions will tend to be many and highly varied and can often be incommensurate prior to the
occurrence of a dominant design. As a product evolves certain features will be incorporated, subsuming the related performance dimensions into the design. With the appearance of the dominant design the product can be described by a few related and commensurable dimensions. A dominant design then, is synthesized from more fragmented technological innovations introduced independently in prior products and tested and often modified by users of those prior products.
A few examples may help clarify this idea. Early versions of the typewriter were able to produce only capital letters. The addition of lower case letter and a shift key was at first a specialized feature. Numbers and tabulation were similarly derived. The earliest typewriters marked on a paper held inside the machine. "Visible typing", with the paper in view of the operator, similarly began as an attraction of just a few models. These features were later synthesized in the Underwood Model 5, which was to become the exemplar of the dominant typewriter design in 1906. Who today could imagine typing without seeing the text, easily shifting to capital letters, or easily entering numbers and aligning columns? These are no longer serious issues or advertised as advantages of one or another manufacturer's product. They are subsumed within the dominant design established by Underwood. Yet within recent memory the Apple II personal computer produced only 40 columns of capital letters. The ability to use 80 columns, to type in upper and lower case or to add a numeric keypad were all features to be purchased from different vendors and installed by the proud owner! Users of even large computer systems patiently embedded control characters in the text of various editing and word processing programs until the innovation of the WYSIWYG (what you see is what you get)
display at Xerox PARC, later adopted in the Macintosh, allowed users to easily change type styles and sizes in a fascinating analogy with visible typing.
Data
To test the hypothesis of concern here we will build on and expand data presented in Utterback and Sudrez 1992, to analyze the automobile, typewriter, transistor, electronic calculator, television, and picture tube industries. For each industry, a
complete list of all participating firms was made, indicating years of entry and exit for each firm. The population density of the industry year by year was computed from these data, as well as an industry rank of entry timing. For those industries where data were available, we included industry sales and annual sales growth in the dataset.
A large number of participants are present in each industry's history. For instance, a total of 121 firms entered the television industry between 1939 and the late 1980s. In the calculator industry, our least-populated example, 37 firms entered between 1962 and 1974. We note that our data sets only include American firms.3
As an example, the data for the typewriter industry are summarized in Figure l(a). These data show a pattern typical for each of the industries studied. A wave of entering firms in the early stages of the industry's growth is followed by a wave of exits (mergers and failures). The upper line in Figure 1(a) is simply the sum of entries and exits, and thus shows the total number of active firms in the typewriter industry in any given year. The curve of total number of firms in an industry at any given year (cumulative entry minus exit) is shown in Figure lb for all the industries in the sample. Figure lb shows that the basic pattern of firm participation is quite similar even for industries which begin almost a century apart.
III
FIGURE 1 ABOUT HERE
Hypotheses and Method
We believe that a firm's probability of surviving through time will be directly affected by a firm's entry timing vis a vis the evolution of technology in the
industry. In particular, we hypothesize that the probability of survival will tend to be greater for firms entering the industry before the emergence of a dominant design than for firms entering after it. The period following the dominant design will be marked by a wave of exiting firms made up of both early entrants not able to master
all aspects of the technology and those firms unlucky enough to enter following the dominant design as well. The development by incumbents of collateral assets and economies of scale (due to increased production after a dominant design) will represent significant barriers to entry for firms that venture to enter the industry after a dominant design. Moreover, strong patent positions may have been
established by earlier entering firms that are difficult for later entrants to completely circumvent. Our view in this respect is clearly consistent with the work of Burton Klein (1977), who suggests a profound connection between industry structure and technological change in his seminal work on dynamic economics.
An alternative hypothesis would be that firms entering before a dominant design is established will have lower chances for survival. While firms entering after a dominant design is established face difficulties as late entrants in overcoming entry barriers, firms entering before will face a high chance of choosing the wrong design. Why do we suppose that firms entering during a period of experimentation will do better than those which enter after a commercially successful design has emerged?4
What are the circumstances under which early entry will be easier, and what are those which might auger against our hypothesis?
In brief, we presume that during a period of experimentation none of the
competitors introducing a new product will have important collateral assets. We assume that entry can occur in a small, performance oriented niche, and therefore there will be modest or no scale barriers to entry. Simple and general production processes are expected to be readily available. The net result of these expectations is that entry will require only moderate capital investment, but will require a high degree of labor skills and flexibility. In essence the advantages of early entrants will flow from their ability to quickly introduce many new products or variants and to learn at a rapid rate from close connections and feedback from users. These ideas flow directly from Utterback and Abernathy (1975), Abernathy (1978) and Abernathy and Utterback (1978). Once a dominant design is established there are several factors which will make it difficult for a new entrant to simply imitate that design.
Collateral assets such as market knowledge, distribution networks and reputation which have been developed to some degree by earlier entrants will take on
increasing importance as the terms of competition shift. Specialized processes developed by the earlier entrants will become increasingly important sources of advantage. Barriers to entry from experience effects, or dynamic economies of scale, and ordinary scale economies will begin to come into play against new entrants. At the same time established firms challenged by the new entrants will suffer from various forms of inertia. For example, firms producing bias-ply tires were
discouraged from entering the radial tire business both by the fear of cannibalizing their own sales and by original equipment purchasers whose automotive
suspensions were tuned to the older tire design (Denouel, 1980). Similarly, Clayton Christensen (1992) argues persuasively that established firms failed to master each successive generation of Winchester disc drive technology through being too wedded to existing customer demands and not attentive enough to the emerging
demands of manufacturers of smaller computers. Henderson and Clark (1990) give a powerful example from the electronic capital goods sector in which established firms are hampered by being wedded to the wrong product technology.
For cases in which there are strong network externalities, we do not expect the above arguments to completely apply. Langlois (1992) argues that in the case of the IBM
10 personal computer, for example, the dominance of a standard increased entry in the industry, since makers of clones could enter without the investment needed to insure adequate software. For cases in which industry standards may differ from standards set based on technical qualities alone, Langlois further argues that the creation of a standard may open up the possibility of new entry by reducing
consumer uncertainty. In our own data the adoption of the RCA broadcast standard for television presents just such a case, and entry does indeed increase rapidly for a brief period after the adoption of that standard.
Non-assembled products usually violate the assumption that simple and general production processes are readily available. In cases where specialized process
knowledge is vital for entry we expect that established firms will be more successful than newcomers. This again follows directly from arguments in Utterback and Abernathy (1975) who limit the concept of dominant design to relatively complex
assembled products. Finally, one might speculate that the arguments above may not
apply to firms having immense financial power and collateral assets such as the Japanese conglomerates or IBM.
The focus of this paper is to try to determine whether entry prior to or after the emergence of a dominant design in the industry affects a firm's survival profile. Survival statistics are presented in order to test the hypothesis that pre-dominant design entry involves lower risk of failure than post-dominant design entry. For each industry, two types of analyses were performed: non-parametric estimates of survival curves for a population stratified in two groups, and a more elaborate analysis adding control variables using Cox regressions (Cox and Oakes 1984). Basic definitions about the statistics used in this paper are reported below for those readers not familiar with the techniques.
Survival analysis is a collection of techniques developed primarily in the field of biostatistics to address the problem of censored data. A given data case is censored when the event under study (exit from the industry in our case) does not occur during the period of study. In this paper, the survival time of a firm is defined as
the total number of (consecutive) years that a firm was active in an industry, i.e. the year of exit minus the year of entry. The survival function, S(t) is defined as the probability that a firm survives (t) years or longer. The survival function is given as a probability ranging between 0 and 1.0 where S(t) = P(T>t). By definition S(t) = 1
for t = 0, and S(t) = 0 for t=oo; therefore survival functions necessarily decline over
time as exits occur. The hazard function, h(t), gives the probability that a case will experience the event (exit from the industry) in a small time interval, given that it has survived until the beginning of that time interval. The hazard function
registers changes in the slope of the (log) survivor function (for a more detailed review see Singer and Willett 1991, who discuss applications to social sciences. For technical details, see Lee 1980, or Cox and Oakes 1984).
Non-Parametric Analysis of the Data
As an exploratory step, we computed nonparametric estimates of the survival distributions in our data. For each industry in our sample, the population was divided into two groups: those firms which entered before the emergence of the dominant design, and those which entered afterwards.5 For each sub-group, survival and hazard function were estimated, and the corresponding likelihood ratios for testing the homogeneity of the curves across strata were calculated. If our hypothesis regarding entry pre or post dominant design is true, we would expect the following:
The survival function of the pre-dominant design entrants sub-group will always lie above that of the post-dominant design entrants.
12 * The hazard function of the post-dominant design entrants sub-group
will lie above that of the pre-dominant design entrants, particularly during the first years of a firm's existence.
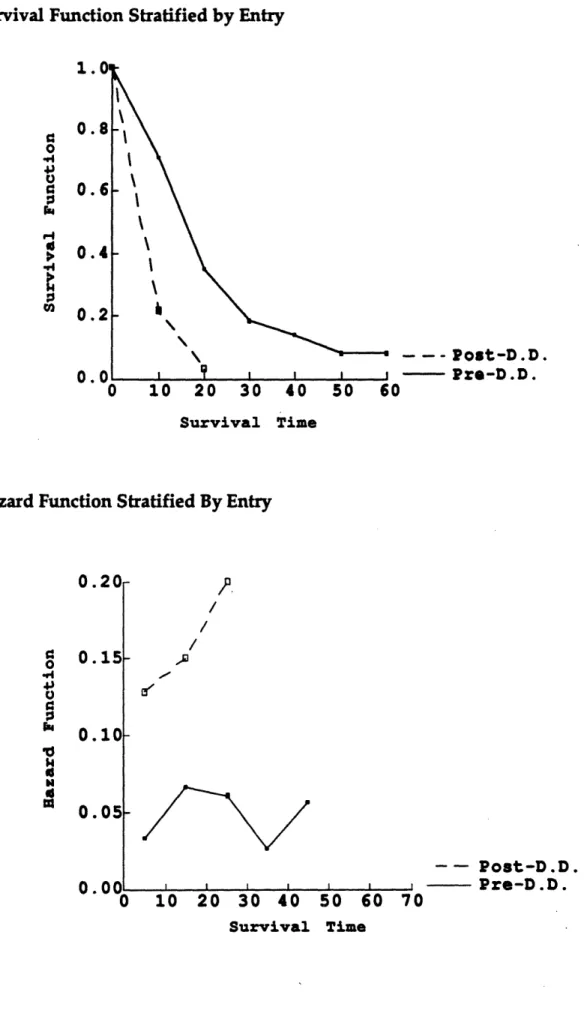
Figure 2 presents the survival and hazard curves for typewriters, as a case in point. Part (a) in Figure 2 depicts the survival function in the industry, stratified by entry timing (pre or post dominant design). Note that the two curves are markedly different and that, as expected, the survival function for post-dominant design entrants always lies below that of the pre-dominant design entrants. The difference is indeed dramatic. For instance, the probability of surviving ten years or more in the typewriter industry was around 0.70 for firms that entered before the dominant design, whereas the same probability was only 0.20 for post-dominant design
entrants.6
Part (b) in figure 2 displays the hazard functions of the two sub-populations. There is again a sharp difference between the curves. The conditional probability of failure
is always greater for firms that entered after the dominant design. For instance, the probability that a firm will die in its 10th year of existence, provided that it has survived until then, is less than 0.05 for pre-dominant design entrants. The same probability is almost three times as great (0.14) for firms that entered the industry
after the dominant design. The two hazard functions also present very different patterns. That of the pre-dominant design entrants basically fluctuates around the
0.05 level, rising at first, then decreasing, and rising again. In contrast, the conditional probability of failure for post-dominant design entrants increases steadily over time. As time goes by, it gets more and more difficult for these late entering firms to survive. The gap between the hazard functions of the two sub-populations widens over time. Indeed, at age 25, the conditional probability of failure was almost 0.20 for firms that entered after the dominant design, whereas it was slightly above 0.05 for pre-dominant design entrants.
The typewriter example conforms most closely to our hypothesis, and clearly illustrates the general pattern that we find in the rest of the industries in our sample. In all but one of these industries, the survival functions for firms that entered the industry before the dominant design lie above those of post-dominant design entrants. The differences between the curves of both sub-populations in each industry, although not as dramatic as in the typewriter case, are often significant. Table 2 shows the results of the Wilcoxon test of equality over strata for typewriters and the rest of the industries in our sample. The null hypothesis in all these tests is that the two survival functions (for pre and post dominant design entrants) are indeed the same. For the case of typewriters, we can reject the null hypothesis (P= 0.0001). Overall, in all but two of the six cases considered here the null hypothesis that the two curves come from the same population can be rejected.
TABLE 2 ABOUT HERE (Wilcoxon test)
Cox Proportional Hazard Models
The nonparametric analysis presented in the last section does not allow for the inclusion of control variables. It could be argued that the observed differences in the
curves for each sub-group are the reflection of differences in the value of variables not contemplated in the previous analysis, and that these variables have no
relationship with a firm's entry timing vis a vis the emergence of a dominant design in the industry. Also, our characterization of pre- and post-dominant design entry may be too simplistic. One would expect that the effect of entry on the
survival profile will vary depending on how long before or after the dominant design a firm enters the industry. It may be less risky to enter an industry only one year after the emergence of a dominant design than to do it a decade later.
14 In order to address these issues we performed further analyses using the technique of proportional hazards modeling presented by Cox (1972). This technique uses hazard (actually a logarithmic transformation of hazard given that raw hazards are bounded to be non-negative) as the outcome variable. For each industry in our sample, a relationship can be stated between the hazard profile and the explanatory and control variables.
First the dummy variable used in the last section (pre- or post-dominant design entry) can be replaced by two continuous variables measuring how many years before or after a dominant design a firm entered the industry (YRBEFDD and
YRAFTDD). The variable YRBEFDD registers the difference between the dominant design date and the actual entry year for those cases where a firm enters before the dominant design in the industry; it is set to zero for post-dominant design entrants. The variable YRAFTDD registers the difference between actual entry year and the dominant design date for those firms entering after the dominant design date; it is set to zero for pre-dominant design entry.7 Next, data on four additional variables
can be used to control for alternative hypotheses regarding firms' survival which have been proposed by researchers in strategy, economics, and population ecology (these were mentioned in the introduction). Gathering data on control variables was not an easy task in some of the industries, as it often involved going back
several decades. In general, the older the industry the more difficult it was to obtain reliable data for the analysis. For each industry we tried to obtain data on the
following variables below. We were able to obtain complete data sets for the
television and automobile industry; for the other industries, data on industry sales and sales growth proved too difficult to gather or too unreliable to be used in the analysis.
· Industry sales at the year of entry by a firm (sales in M 1982 dollars), INDSLENT. · Industry sales growth rate (annual) at the year of a firm's exit from the industry,
· Population density (number of firms in the industry) at the year of a firm's entry, EDENSITY.
· Industry rank of entry timing (we used a natural logarithmic transformation), LNENRANK.
A general model can be written as:
In h(t) = B(t) + Bi YRBEFDD + + B2 YRAFTDD + B3 INDSLENT + B4 ISLGWEX +
+ B5 EDENSITY + B6 LNENRANK
The variable EDENSITY tests the effect of the density dependence argument introduced by population ecologists (Hannan and Freeman 1988; Carroll and
Hannan, 1989). One would generally expect a higher hazard profile (a "riskier life") for firms entering the industry during periods of high population density (Carroll and Swaminathan, forthcoming). Extensions of the original density dependence argument also allow for a reduction in the hazard profile as density increases (see, for instance, Barnett 1990). The latter case is said to exist when "mutualism" is present, i.e. when the existence of more organizations in the population improves the organizations' survival profile. As our sample deals with firms that directly compete for market share, we expect competition rather than mutualism in our analysis.
The variable INDSLENT captures the effect of market size at a firm's entry on the hazard profile of that firm, an idea also related to the postulates of population ecologists and related research. One would expect a lower hazard profile for firms
that enter the industry in years where the market is larger. Indeed, Barnett and Amburgey (1990) found that industry sales reduced failure rates in the telephone
industry. The variable ISLGWEX captures the effect of business cycles in the hazard profile of firms. One would expect a firm's probability of failure to be higher the
16 weaker the industry growth rate is during the last year of a firm's existence. Finally, LNENRANK captures the effect of entry timing on the performance of firms, along the lines of previous studies in strategy such as those by Mitchell (1989, 1991) and Lambkin (1988). Note that the entry timing effect is different from that of pre- and post-dominant design entry.
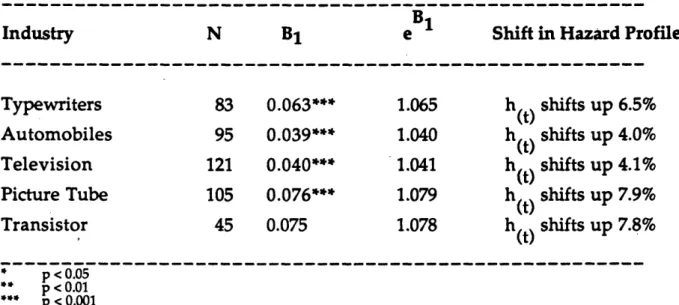
Table 3 below presents the result of fitting a simple model of log-hazard with YRBEFDD and YRAFTDD as the only predictors. This analysis is already an
improvement over the nonparametric analysis of the previous section, given that YRBEFDD and YRAFTDD are continuous variables measuring the effect on the log-hazard profile of an additional year of early (or late) entry by a firm respect to the dominant design date for the industry. The parameters of YRBEFDD and
YRAFTDD are highly significant in all cases and as expected, they are always more significant than the dummy predictor of pre- or post-dominant design entry (this is not reported in the table). The antilogarithms of these coefficients represent
numerical multipliers of risk per unit difference in the predictor (Singer and Willett 1991). Table 3 shows that entry prior to the dominant design consistently reduces a firm's risk of failure. For each year earlier than a firm enters respect to the
dominant design date (a higher value for YRBEFDD), its hazard profile is shifted down 6 to 15 percentage points depending on the industry considered. Entry after the dominant design (a value greater than zero for YRAFrDD) has a more ambigous effect in terms of shifting the hazard profile. Post-dominant design entry increases risk of failure in one industry, has almost no effect on two industries, and actually decreases risk in the picture tube industry.
TABLE 3 ABOUT HERE (Simple Cox Regression - Four Industries)
In most cases, the strong and significant effects of YRBEFDD and YRAFrDD do not vanish when we add control variables. Table 5 is a summary table reporting the be. -:fitting models in each industry after adding the control variables. Only in the
television industry the best-fitting model is one that does not include the variables YRBEFDD and YRAFTDD.8 With only a few exceptions the signs of the coefficients, and their implications with respect to shifts in the hazard profile, are the expected ones. In terms of the mechanics of the analysis, for each industry a taxonomy of models was tested, and the significance of a given variable in a model was calculated by dropping the variable in question from a model that included it, and performing a "decrement to chi-square" test between the two models. Appendices 1 and 2 report the results of all fitted models in each industry. The automobile case is discussed below as an example.
TABLE 4 ABOUT HERE (Summary of Cox Regressions )
In order to illustrate the interpretation of the coefficients in a Cox model, consider Table 5 below which shows a taxonomy of models fitted for the case of the
automobile industry. The table shows that the significance of YRBEFDD and YRAFrDD, or the sign of their effect on hazard is not affected by the addition of more covariates. The best-fitting model is model seven, which includes all
variables.9 For the best-fitting model, the antilogarithms of parameter estimates are shown in parentheses.
TABLE 5 ABOUT HERE (Cox Regression - Auto)
Note that all parameters in the automobile case present the expected sign. The hazard profile of a firm is shifted upward (i.e. a firm has a higher conditional
probability of failure) by increments in YRAFTDD and EDENSITY. For instance, for each increment in population density at any given year, the hazard profile of a firm entering the industry that year goes up by 4.3 percent. Note, incidentally, that the
18 unexpected negative sign for the coefficient of YRAFIDD from the simple model (Table 3) changes to a positive coefficient when we add the controls. Entry after the dominant design now increases the hazard profile, as we expected. The hazard profile is shifted downward by higher values of YRBEFDD, INDSLENT and ISLGWEX. The earlier the entry vis a vis the dominant design, the bigger the
market early in the life of a firm, or the stronger the industry growth rate at a firm's final year, the lower the conditional probability of failure of such a firm.
Research Agenda
The analysis presented above opens a broad agenda for future research. First, the concept of a dominant design dearly needs to be specified more rigorously. We think we have moved a step forward here by considering the emergence of a dominant design as a combination of technological, economic, and organizational factors.
There is also further work to do in terms of finding some sensible metrics to narrow down the search for a dominant design date. This is probably the most challenging task ahead. Some authors have used tautological measures to determine a
dominant design, such as market share (Anderson and Tushman, 1990). A better measure, for instance, might be a notable increase in licensing activity during
several years by a given firm or by a group of firms with products based on the same core technology. Licensing data, i.e. whether a particular product or process starts to capture a large share of the industry's licensing activity at some time may represent a good way to shed light on the occurrence of a dominant design. We expect that this would be particularly true in cases in which there are strong network
externalities. More generally we need to discover a way of keeping track of the different features of divfferent models of competing products to see if these begin to stabalize just prior to the synthesis of a dominant design. Sanderson and Uzumeri (1990) have provided one possibly fruitful approach based on analysis of product literature and specifications.
Our sample has been limited. More industries, especially contemporary ones, are needed if our hypotheses are to be more generally tested. We also need to study counter-examples to our model. In the VCR industry, for instance, the
post-dominant-design period seems to have been associated with an increase in the entry of firms into the industry. By studying cases like this, perhaps we could isolate the factors or characteristics of an industry to create a model more likely to be valid. Finally, the present analysis could also be expanded by adding more firm-specific control variables.l0
Building upon Teece (1986), we suggested that the dominant design concept be related to issues such as collateral assets, network externalities, industry regulation, and firms' strategic maneuvering. The importance of relating the concepts of dominant design and standards was also stressed. There are still many issues that need to be addressed in future research. The specific effect of each of the mentioned factors on the emergence of a dominant design needs to be sorted out, as well as the
conditions for each of them to play a greater or lesser role.
Conclusions
This paper has shed light on relationships between technology, firm strategy, industry structure, and the competitiveness of firms in an industry. The results show that the dominant design-technological evolution model proposed by
Utterback and Abernathy (1975) has clear implications for the fate of firms entering an industry. This model can complement postulates of other streams of thought such as those of population ecology, strategy, and economics, and together these theories can better explain the survival characteristics of firms. Work on strategic management has often neglected technological change. These results show that by explicitly including technology as a dynamic and strategic variable we can enhance our understanding of firms' survival potential and success.
III
20 Footnotes:
1 As Teece 1986 and others have noted, the dominant design model is better suited to mass markets where consumer tastes are relatively homogeneous. Also, our claims only extend to assembly manufacturing industries. As Utterback (1992) has argued elsewhere, the hypotheses stated here are of less relevance to the case of non-assembled products such as rayon or glass, in which innovation in the production process is an earlier and more central theme.
2 Note, though, that a firm can achieve the same result by giving away most of the production of its product design to third parties rather than producing it only in-house. This instance of strategic maneuvering was present in the VCR industry.
3 Several of the data on entry and exit dates have been taken from others' oriinal work: typewriters from Engler (1969), automobiles from Fabris (1966), transistors from Tilton (1971), and casculators from Majumdar (1977). The authors gathered data on television sets and picture tubes from archival sources.
4 The authors thank the anonymous referee who raised this question. 5 Our data set at this point is composed of the following variables for each industry:
Firm Name of the firm
Entry Year of entry to the industry Exit Year of exit from the industry
Time Number of years that the firm operated in the industry (one in cases where entry and exit are in the same year) Censor 0 when case is right-censored, 1 otherwise (see below). Pre_Post 0 if firm entered the industry before the dominant design,
1 if it entered after the dominant design
6We think that the liability of newness argument may hold better in pr-dominant design periods, given that entry in
these periods is in general "less risky" than post-dominant design entry. Thus, firms entering an industry before the dominant design will have the hardest time during their first years of existence (typically, they have limited financial resources) but, if they manage to survive the first years, their chances of surviving become somewhat greater. The picture may be different after the dominant design has been established, for incumbents have created significant barriers to entry. Firms that venture to enter in this post-dominant design phase will probably make sure in advance that they have enough resources to try to compensate for the incumbents advantages (that is, there is some type of selection bias in terms of the kind of firms that enter in this phase). Thus, these post-dominant design entrants may have a "safer" life during their first years in the industry, because they came well endowed. As their resources are depleted during their first years in the industry and as the advantages of predominant design incumbents prove difficult to overcome, their probability of failure begin to rise. This reasoning may explain the apparent divergence in our work and that related to the liability of newness, but we need to explore this further in the future.
7
We thank an anonymous reviewer who suggested we use two variables measuring the 'distance' from dominant design. Originally, we had created a single variable, YRFROMDD, taking negative or positive values depending whether a firm entered before or after the dominant design. Having two variables (YRBEFDD and YRAFDD) allow us to relax the restriction that the effect of entry on hazard is the same for both pre- and post-dominant design entrants. 8 We believe this may be partly caused be the fact that our early data for the television industry are not as reliable as those for other industries, as data for the first few years of the industry were unavailable.
9 Note that we have included entry density in the best-fitting model even though this variable is not significant because several of our variables are correlated.
1 0
For examples of other papers that have considered the effect of multiple covariates on survival, see Willard and Cooper (1985) or Mitchell (1991). Note that both these studies have only considered one industry. In fact, Willard and Cooper considered only the 19 largest firms in their study of color'TV (and also used more traditional statistical techniques than those we employ here). -None of these studies tested the hypotheses derived from the dominant design
Abernathy, William J. The Productivity Dilemma, John Hopkins University Press, Baltimore, MD, 1978.
Abernathy, William J., and James M. Utterback. 'Patterns of Innovation in
Technology,'Technology Review, 80, N97, 40-47, 1978.
Afuah, Allan and James M. Utterback. 'The Emergence of a New Supercomputer
Architecture,'Technological Forecasting and Social Science, 40, 315-328, 1991.
Anderson, Philip and Michael Tushman. 'Technological Discontinuities and Dominant Designs: A Cyclical Model of Technological Change,' Administrative
Science Quarterly, 1990, December.
Astley, Graham. 'The Two Ecologies: Population and Community Perspectives on Organizational Evolution,' Administrative Science Quarterly, 30, 224-241, 1985. Barnett, William. 'The Organizational Ecology of a Technological System,'
Administrative Science Quarterly, 35, 31-60, 1990.
Barnett, William and Terry Amburgey, 'Do Larger Organizations Generate Stronger Competition?,' in Jitendra Singh (ed.) Organizational Evolution: New Directions, Newbury Park, Sage Publications, 1990.
Braun, E. and S. MacDonald. Revolution in Miniature: The History and Impact of
Semiconductor Electronics, Cambridge University Press, Cambridge, England, 1978.
Cainarca, Gian Carlo, Massimo Colombo and Sergio Mariotti. 'An Evolutionary Pattern of Innovation Diffusion. The Case of Flexible Automation,' Research
Policy, 18, 59-86, 1989.
Carroll, Glenn R., and Michael Hannan.. 'Density Delay in the Evolution of Organizational Populations: A Model and Five Empirical Tests,' Administrative
Science Quarterly, 34, 411-430, 1989.
Carroll, Glenn R (ed.). Ecological Models of Organizations, Ballinger Publishing Company, 1988.
Christensen, Clayton T., The Innovator's Challenge: Understanding the Influence of
Market Environment on Processes of Technology Development in the Rigid Disk Drive Industry, unpublished doctoral dissertation, Harvard University Graduate
School of Business Administration, 1992.
Clark, Kim B. 'The Interaction of Design Hierarchies and Market Concepts in Technological Evolution,' Research Policy, 14, 235-251, 1985.
Cox, D. and D. Oakes. Analysis of Survival Data, Chapman & Hall, New York, 1984. Cox, D. R. 'Regression Models and Life Tables,' Journal of the Royal Statistical
Society, 34, 187-202, 1972.
Cox, D. R. and E. J. Snell. Analysis of Binary Data, Chapman and Hall, New York, 1989 (2nd ed.).
Cusumano, Michael, Yiorgos Mylonadis and Richard Rosenbloom. 'Strategic Maneuvering and Mass-Market Dynamics: The Triumph of VHS Over Beta,'
Working Paper No. 40-91, International Center for the Management of Technology, MIT, 1991.
Denouel, Daniel L., The Diffusion of Innovations: an Institution Approach,
unpublished doctoral dissertation, Harvard University Graduate School of Business Administration, 1980.
Department of Commerce. Historical Statistics of the United States: Colonial Times
to 1970,
Dertouzos, M., R. Lester, R. Solow and The MIT Commission on Industrial Productivity. Made in America, The MIT Press, 1989.
Dosi, Giovanni. 'Technological Paradigms and Technological Trajectories: A Suggested Interpretation of the Determinants and Direction of Technical Change,'
Research Policy, 11, 147-162, 1982.
Dunne, T., M. J. Roberts, and L. Samuelson. 'The Growth and Failure of U.S. Manufacturing Plants,' Quarterly Journal of Economics, 104, 671-698, 1989.
Electronic Industries Association. Electronic Industries Yearbook, several issues, Electronic Industries Association. Electronic Industries Data Book, 1990.
Engler, N. The Typewriter Industry: The Impact of a Significant Technological
Innovation, Ph.D. Thesis, University of California, Los Angeles, 1969.
Fabris, R. Product Innovation in the Automobile Industry, Ph.D. Thesis, University of Michigan, 1966.
Geroski, P. A. and R. Pomroy. 'Innovation and the Evolution of Market Structure,'
The Journal of Industrial Economics, 38, 299-315, 1990.
Hannan, Michael and John Freeman. 'The Population Ecology of Organizations,'
Organizations, 7-32, 1988.
Hemenway, David. Industrywide Voluntary Product Standards, Ballinger Publishing Company, Cambridge, MA, 1975.
Henderson, Rebecca and Kim B. Clark. 'Architectural Innovation: The
Reconfiguration of Existing Product Technologies and the Failure of Established Firms,' Administrative Science Quarterly, 35, 9-30, 1990.
Kalbfleisch, J. and R. Prentice. The Statistical Analysis of Failure Time Data, John Wiley and Sons, New York, 1980.
Katz, M. and C. Shapiro. 'Network Externalities, Competition, and Compatibility,'
American Economic Review, 75, 424-440, 1985.
Katz, M. and C. Shapiro. 'Technology Adoption in the Presence of Network Externalities,' Journal of Political Economy, 94, 822-841, 1986.
Kelly, Dawn and Terry L. Amburgey. 'Organizational Inertia and Momentum: A Dynamic Model of Strategic Change,' Academy of Management Journal, 34:2, 591-612,1991.
Kessides, Joannis N., et al. 'Towards a Testable Model of Entry: A Study of the US Manufacturing Industries,' Economica, 57, 219-238, 1990.
Klein, Burton. Dynamic Economics, Harvard University Press, Cambridge, MA, 1977.
Kuhn, Thomas. The Structure of Scientific Revolutions, University of Chicago Press, 1970.
Lambkin, M. 'Order of Entry and Performance in New Markets,' Strategic
Management Journal, 9, 127-140, 1988.
Langlois, Richard N, "Comments on 'Innovation , Competition and Industry Structure,"' Research Policy, Vol. 21, No. 6, December 1992.
Lee, Elisa. Statistical Methods for Survival Data Analysis, Lifetime Learning Publications, 1980.
Lieberman, Marvin B. 'Exit from Declining Industries: Shakeout or Stakeout'?,
Mitchell, Will. 'Whether and When? Probability an d Timing of Incumbents' Entry into Emerging Industrial Subfields,' Administrative Science Quarterly, 34, 208-230, 1989.
Mitchell, Will. 'Dual Clocks: Entry Order Influences on Incumbent and Newcomer Market Share and Survival when Specialized Assets Retain their Value,' Strategic
Management Journal, 12, 85-100, 1991.
Montgomery, Cynthia A. and Birger Wernerfelt. 'Sources of Superior Performance: Market Share versus Industry Effects in the U.S. Brewing Industry,' Management
Science, 37:8, 954-959, 1991.
Nelson, Ralph L. Concentration in Manufacturing Industries of the United States:
A Midcentury Report, Yale University Press, New Haven, 1963.
Nelson, Richard and Sidney Winter. An Evolutionary Theory of Economic Change, The Belknap Press of Harvard University Press, Cambridge, MA, 1982.
Nutter, Warren G. and Henry A. Einhorn. Enterprise Monopoly in the United
States: 1899-1958, Columbia University Press, New York, 1969.
Ohmae, Kenichi. Triad Power, The Free Press, New York, 1985.
Sanderson, Susan W. and Vic Uzumeri, "Strategies for New Product Development and Renewal: Design-based Incremenrtalisn," Rensselaer Polytechnic Institute, Center for Science and Technology Policy, Working Paper, May 1990.
Singer, Judith and John Willett. 'Modeling the Days of Our Lives: Reviewing Applications of Survival Analysis in Psychological Research,' Psychological
Bulletin, forthcoming,
Singh, Jitendra and Charles Lumsden. 'Theory and Research in Organizational Ecology,' Annual Review of Sociology, 16, 161-195, 1990.
Smith and Alexander. Fumbling the Future, William Marrow and Co., New York, 1988.
Teece, David. 'Profiting from Technological Innovation,' Research Policy, 15, N%, 1986.
Tilton, J.E. International Difussion of Technology: The Case of Semiconductors, The Brookins Institution, 1971.
Tirole, Jean. The Theory of Industrial Organization, MIT Press, 1988.
U.S. Department of Commerce. Statistical Abstract of the U.S., several issues, Utterback, James M. and William Abernathy. 'A Dynamic Model of Process and Product Innovation,' Omega, 33, 639-656, 1975.
Utterback, James M. and Fernando F. SuArez. 'Innovation, Competition, and Industry Structure,' Research Policy, forthcoming, 1992.
Utterback, James M., The Dynamics of Innovation in Industry, Boston, MA: Harvard Business School Press, forthcoming, 1992.
Willard, Gary and Arnold Cooper. 'Survivors of Industry Shake-outs: The Case of the U.S. Color Television Set Industry,' Strategic Management Journal, 6, 299-318,
Table 1. A List of Dominant Designs By Industry
Industry Dominant Design Date Source Typewriter Underwood's Model 5; 1906 Engler, 1969
Hess' innovations Automobile
Television
TV Tubes
Transistor
All Steel, Closed body
21-inch set; adoption of RCA's technical standards
All-glass, 21 inch tube
Planar Transistor 1923 1952 1956 1959 Fabris, 1966; Abernathy 1978 John Rydz interview; Television Factbook 1949-89
John Rydz interview; Television Factbook 1949-89
Tilton, 1971; Braun & MacDonald, 1978 Calculator on a chip 1971
Industry Chi2 D.F. P-Value Decision at 0.05 level
Typewriters 26.849 1 0.0001 Reject Null Hypothesis Automobile 4.295 1 0.0382 Reject Null Hypothesis Television 15.976 1 0.0001 Reject Null Hypothesis Picture Tube 0.0161 1 0.8989 Can't Reject
Transistor 0.093 1 0.7601 Can't Reject
Calculators 4.9334 1 0.0263 Reject Null Hypothesis
Pre-DD Post-DD
Table 3. Cox Proportional Hazards Regression - Five Industries
Model: ln h(t) = B + B1 YRFROMDD
Industry N B1 e Shift in Hazard Profile
Typewriters 83 0.063*** 1.065 h shifts up 6.5% (t)
Automobiles 95 0.039*** 1.040 h(t) shifts up 4.0% Television 121 0.040*** 1.041 h) hifts up 4.1%
(t) s
Picture Tube 105 0.076*** 1.079 h(t) shifts up 7.9%
Transistor 45 0.075 1.078 h shifts up 7.8%
h(t) s
* p < 0.05
p < 0.01
· ** D< 0.001
Note: the analysis could not be performed for the calculator industry, as all but a few firms entered the industry before the dominant design.
Model YRFROMDD INDSLENT ISLGWEX EDENSITY LNENRANK -2LogL ____________________________________________________________ 599.95 -0.0001* -0.0177** 0.019** 0.297 -0.0001** -0.0001** (0.999) -0.0185*** -0.0197*** (0.980) 593.62 591.11 591.40 598.27 583.47 573.93 0.019** (1.019) VIII 0.0000 -0.0156* 0.026*** 588.34 B.
In model VII, the best-fitting model, antilogarithms of parameter estimates ( e are shown in parentheses. p < 0.05 *** p< 0.01 p < 0.001 I 0.039*** 11 0.086*** mI 0.049*** 0.026*** IV V VI 0.021*** 0.104*** VII 0.107*** (1.113)
III
Table 5. Cox Proportional Hazards Regression for the Typewriter Industry
Model YRFROMDD EDENSITY LNENRANK -2LogL
I 0.0632*** 528.66 (1.0636) II 0.0463*** 543.93
m
0.0617*** 0.0305 528.62 IV 0.0672* -0.0533 528.64 V 0.0797* 0.0146 -0.3174 528.34 B.In model I, the best-fitting model, antilogarithms of parameter estimates ( e are shown in parentheses. p < 0.05
** < 0.01 *** p < 0.001
1891 1908 1925 Years lo 1942 TOTAL EXIT ENTRY
(b) Number of Firms Participating in Six Industries in the U.S.
50 45 a 0 $4 0
I
40 35 30 25 20 15 5 0 1874 Figure 1. 90 80 70 60 U.i
Z Iz
50 40 30 20 10 0 1874 1893 1912 1931 1950 1969 1988 Years X-XI-II^III--..Figure 2. Typewriter Industry
(a) Survival Function Stratified by Entry
Survival
--- Post-D.D. -- Pre-D.D.
Time
0
(b) Hazard Function Stratified By Entry
A Io A 9od .4 Ia. N ttl V.& 0.15 0.10 0 0 05 00 U. / '_-0 10 -- Post-D .D. I , I I I , Pre-D.D. 20 30 40 Survival 50 60 70 Time 1. 0 .94 4i U C: 0 FM a 01 ,111 tI V) 0. 0. 0. 0. 0. II A
Model YRFROMDD INDSLENT ISLGWEX EDENSITY LNENRANK -2LogL I 0.040*** 892.10 II 0.014 0.0001* 885.78 III 0.035* 0.009* 886.24 IV -0.005 0.5358*** 882.63 V 0.0002*** -0.0164** 878.80 VI -0.0148* 0.5307*** 876.18 (0.985) (1.700) VII 0.0001 -0.0165** 0.3401* 872.86 VIII -0.044 0.0001 -0.0160** -0.0085 0.6874* 871.11
In model VI, the best-fitting model, antilogarithms of parameter estimates (e are shown in parentheses. p < 0.05
· < 0.01 p < 0.001