HAL Id: hal-00296968
https://hal.archives-ouvertes.fr/hal-00296968
Submitted on 26 Sep 2006
HAL is a multi-disciplinary open access
archive for the deposit and dissemination of
sci-entific research documents, whether they are
pub-lished or not. The documents may come from
teaching and research institutions in France or
abroad, or from public or private research centers.
L’archive ouverte pluridisciplinaire HAL, est
destinée au dépôt et à la diffusion de documents
scientifiques de niveau recherche, publiés ou non,
émanant des établissements d’enseignement et de
recherche français ou étrangers, des laboratoires
publics ou privés.
Investigation of parameter uncertainty and
identifiability of the hydrological model WaSiM-ETH
G. Wriedt, M. Rode
To cite this version:
G. Wriedt, M. Rode. Investigation of parameter uncertainty and identifiability of the hydrological
model WaSiM-ETH. Advances in Geosciences, European Geosciences Union, 2006, 9, pp.145-150.
�hal-00296968�
© Author(s) 2006. This work is licensed
under a Creative Commons License.
Geosciences
Investigation of parameter uncertainty and identifiability of the
hydrological model WaSiM-ETH
G. Wriedt and M. Rode
UFZ Centre for Environmental Research Leipzig-Halle GmbH, Br¨uckstrasse 3a, 39114 Magdeburg, Germany Received: 23 January 2006 – Revised: 22 May 2006 – Accepted: 3 July 2006 – Published: 26 September 2006
Abstract. The identification of optimum model parameters
may be influenced by temporal or event-specific changes of optimum parameter ranges and the length and information content of calibration data. These effects were studied for the hydrological model WaSiM-ETH in a 170 km2 catchment. Based on a Monte-Carlo simulation including seven model parameters, we investigated temporal and state dependent changes of parameter identifiability using the DYNIA algo-rithm. The effect of data length was studied using a modified DYNIA approach based on a growing window algorithm. The DYNIA analysis revealed temporal changes of identi-fiability for the snow melt runoff parameter cmelt, which is only identifiable during winter runoff, and for the drainage density parameter drd. The drd parameter was closely re-lated to observed discharge (or catchment moisture), when re-ordering the time series by discharge. Such dependencies probably result from processes not included in model equa-tions. The growing window analysis shows that more than one year of data did not result in improved identification of model parameters cmelt and drd. Using the re-ordered data series, good identifiability of cmelt was bound to high dis-charges, while identifiability of drd changed with the addi-tion of further values in descending or ascending order. The methodology revealed structural problems with regard to the parameter drd, which are not yet completely understood and require further investigation.
1 Introduction
A general argument for the use of process oriented mod-els is the assumption, that a process-oriented model main-tains system dynamics even beyond the range of calibration data. Not all information about a specific system can be ob-Correspondence to: G. Wriedt
(gunter.wriedt@jrc.it)
tained from observation, therefore model parameters need to be calibrated to adapt a model to a specific system un-der consiun-deration. Experience in rainfall-runoff modelling has shown that one calibrated parameter set may not yield equally good approximations to all events or for different parts of the observed hydrograph. Single events are often calibrated individually and event-specific parameter sets are obtained. For long-term simulations, the optimum parameter sets may not only be different for separate periods, they may also change in time concurrently with changes in boundary conditions and process characteristics. The event-based or subset-specific changes of optimum model parameters may result from uncertainty of input data or observation data and equifinality (Beven and Binley, 1992) of the system. How-ever, these parameter changes may also result from system-atic changes of system behaviour, revealing inadequate pro-cess representations in the model. In this case, systematic re-lations of parameter optima and state variables should exist. To approach this problem, it needs to be shown that parame-ter optima change in time and that they change systematically corresponding to state indicators.
The success of parameter calibration also depends on the information content of the given data set. Snow melt parame-ters for example can only be calibrated, if snow melt periods are included in the data set. Low flow conditions may not be suitable to calibrate parameters controlling fast runoff pro-cesses. Therefore data sets should carefully be chosen for model calibration to include suitable information. Yapo et al. (1996) have shown that a time series of eight years was sufficient for calibrating a conceptual hydrological model in Arizona. The required length of the calibration data series also reflects local climatic variability and may also depend on the conceptual model itself. Up to now, no systematic stud-ies are available focussing on the question, how much data is needed and which parts of the data set contain the necessary information to calibrate single processes or parameters.
146 G. Wriedt and M. Rode: Parameter uncertainty and identifiability of the hydrological model WaSiM-ETH
Table 1. Parameters included in the Monte-Carlo simulation.
Parameter Description Range
kd Recession constant for direct runoff 1–150 [h]
ki Recession constant for interflow 1–150 [h]
drd “Drainage density”, controls interflow volume 1–30 [m−1]
kb Recession constant base flow 0.01–0.9 [m]
q0 Scaling factor for base flow 0.001–0.02 [mm/h]
krec Factor controlling decrease of hydraulic conductivity with soil depth 0.1–1.0 [–]
cmelt Fraction of snow melt directly contributing to surface runoff 0.1–1.0 [–]
The DYNIA methodology (DYNamic Identifiability Anal-ysis; Wagener et al., 2003) reveals temporal changes of the parameter probability distribution function and parameter uncertainty. The methodology is based on a Monte-Carlo Simulation evaluated by a moving window algorithm and can therefore be used to identify problems of model structure. This algorithm is a good starting point to study the questions aforementioned. Reorganization of the time series data by state variables may reveal state dependencies of parameter optima. A growing window could be used to study the effect of increasing the amount of data on parameter identifiability. The DYNIA methodology has been applied to simple, con-ceptual models and no studies have been published focussing on process-oriented, distributed models so far.
The objectives of this study are to investigate optimum pa-rameter changes and data requirements for model calibration. We apply a modified DYNIA algorithm to investigate tempo-ral and state dependent changes of parameter uncertainty and identifiability of the distributed hydrological model WaSiM-ETH and to study the effect of increasing time series length on the calibration result.
2 Material and methods
2.1 Study area and model setup
The Weiße Elster river basin extends over 5200 km2 in the border triangle of the states Saxony, Saxony-Anhalt and Thuringia in Germany. The simulations have been carried out for the uppermost subcatchment, related to the gaug-ing station Adorf. The Adorf-subcatchment is located in the Erzgebirge mountains and covers an area of 171 km2. Daily precipitation data from two rainfall stations and discharges from the Adorf gauge were available for the period from 1991 till 1999.
The hydrological model WaSiM-ETH (Schulla, 1997; Schulla and Jasper, 2001) was applied for rainfall-runoff sim-ulation, using the Richards-approach for soil water balance and the conceptual approach for base flow generation. A Monte-Carlo simulation was carried out using a set of seven model parameters. The selected model parameters are
catch-ment specific and control soil percolation (krec), direct runoff from snow melt (cmelt), direct runoff (kd), baseflow (kb, q0) and interflow generation (ki, drd). The parameters were con-sidered to be uniformly distributed within the feasible param-eter range. A list of paramparam-eters and the associated paramparam-eter range is given in Table 1. Until now, 1300 realizations have been completed. The simulations were carried out on a daily time step for the period 11/1991–10/1999, including a warm-up period of one year.
2.2 The DYNIA algorithm and modifications
The DYNIA algorithm was developed by Wagener et al. (2003) as an extension of the regionalized sensitivity anal-ysis (Spear and Hornberger, 1980; Hornberger and Spear, 1981). The basic idea is to calculate the probability distri-bution for individual model parameters for each model time step within a specified time frame (moving window). The re-sults are visualized in a 2D plot of parameter values vs. time, where the parameter probability density is shaded in a gray scale. Only the best 10% of simulations, according to an appropriate support measure (here: sum of absolute errors, SAE), are included in the analysis. Confidence ranges and information content, expressed as a function of confidence range and parameter range, are calculated as additional in-formation. Small confidence ranges (in relation to parame-ter range) would express a high identifiability (or low uncer-tainty) of the individual parameters. The algorithm facilitates analysis of temporal changes of parameter confidence inter-vals as well as of the probability density function of model parameters.
Temporal changes of optimum parameter values can possi-bly be referred to changing identifiability or process relations not considered by the model. Direct relations to observed or simulated state variables can be visualized by using a data series re-ordered according to the state variable under con-sideration, instead of using the time series. In this paper we used observed discharge for re-ordering the time series. Dis-charge in this case can be considered a surrogate variable for the water storage in the system. The DYNIA analysis was carried out with a window size of 101 days (50 days preced-ing and followpreced-ing the current time).
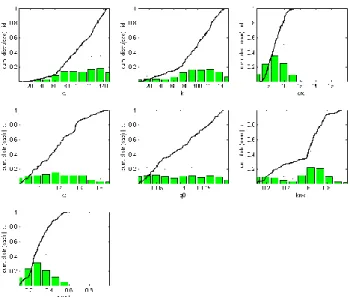
Fig. 1. Identifiability plot for seven parameters of the WaSiM-ETH model based on SAE, giving the probability distribution of param-eter values and the cumulative probability density function of the parameter values.
To assess the impact of time series length and the loca-tion of informative data, we also applied a modificaloca-tion of the DYNIA approach based on a growing window instead of a moving window. The parameter probability distribution at step i is calculated for the complete data set from the first to the ith data point. With each step, additional data are in-cluded incrementally.
3 Results
3.1 General analysis of parameter identifiability
The overall identifiability analysis (Table 1) gives an overview of the probability distribution function (pdf) and the cumulative pdf (cdf) of individual model parameters for the best performing 10% of each parameter set, based on the complete observation data set. The best identifiability is given for the parameters drd, krec and cmelt. The pdf for the parameters kd and ki is less well defined, indicating higher degree of uncertainty and less identifiability. No clear iden-tifiability is given for kb and q0.
3.2 DYNIA-Analysis of individual model parameters The parameter cmelt is a typical example for a parameter that can only be identified in certain periods. Parts with narrow confidence ranges, and high probabilities in the pa-rameter range 0.2–0.3, alternate with parts of higher con-fidence ranges and lower identifiability (Fig. 2). This be-haviour is obvious from process understanding, as snow melt takes place under winter conditions only and has no effect
Fig. 2. DYNIA plot for parameter cmelt (window size 101 days). Dashed lines in the upper figure indicate 95% confidence limits; grey shading indicates parameter probability, see legend.
Fig. 3. DYNIA plot for parameter drd (window size 101 days).
in summer and autumn months. In contrast to the gener-ally low cmelt values during winter, the spring snowmelt of 1994 is associated with unusual high cmelt values of 0.7 to 1, which may be attributed to specific weather conditions (e.g. frozen soil below snow reducing infiltration of melt water) not adequately captured by the relatively simple degree-day approach for snow melt.
The drainage density parameter also shows quasi-regular variations in the time series, but the relation is less clear than for the snow melt runoff parameter (Fig. 3). Re-ordering the time series by observed discharge reveals a new pattern. In the low discharge range, the drd parameter is highly identifi-able with values below 5. Increasing the discharge, the con-fidence range shifts to higher parameter values, indicating a relationship (not yet understood) between the parameter drd and catchment wetness (Fig. 4). At the same time, the uncer-tainty of the estimated optimum parameter range increases, expressed by a growing confidence interval finally ranging
148 G. Wriedt and M. Rode: Parameter uncertainty and identifiability of the hydrological model WaSiM-ETH
Fig. 4. DYNIA plot for parameter drd reordered by observed dis-charge (window size 101 days).
Fig. 5. Growing window identifiability analysis of the parameter
cmelt.
from 7 to 30.
The parameters ki, kb, q0 and krec can be considered con-stant with respect to the window size of 101 days. kb and krec are well defined by constant and clear high probabil-ity region, ki, kd and q0 show higher uncertainty and less identifiability, indicated by broad confidence intervals and no clear high probability region. Though confidence ranges partly show variations, the probability density distributions do not change over time. The same is true for ki and kd. 3.3 Growing window analysis of specific model parameters Using the original time series for the growing window anal-ysis of cmelt, the size and location of the confidence interval, the parameter pdf and the information content remain more
Fig. 6. Growing window identifiability analysis of the parameter
cmelt reordered by observed discharge (descending).
or less constant after the first winter event (Fig. 5) and ad-ditional data do not improve parameter identification. Ap-plying the algorithm to a data series re-ordered by ascending discharge, shows that the confidence range is much broader and only poor improvement is achieved by adding additional data. Using a data series ordered by descending discharge reveals a good identifiability for the first 500 data points (Fig. 6). Beyond this point, we observe a broader confidence interval and less information content, but identifiability re-mains constant while adding further data. These findings show that high discharge values yield the most information for identification of cmelt. In this case, it is clear that high discharge periods coincide with winter runoff and snow melt processes.
Using the original time series for the growing window analysis of the drd parameter, again one year was enough to establish a constant parameter estimation (Fig. 7) and ad-ditional data do not improve the results.
Using a data series ordered by descending discharge re-veals a pattern similar to the DYNIA analysis. If only high discharges are included in the analysis, drd shows a broad confidence range and the parameter range shifts to lower val-ues as more data are added (Fig. 8). The final parameter range reached after five years is similar to that obtained by using the original data series. Using data ordered by ascend-ing discharge will also finally coincide with the parameter range obtained for the original time series (Fig. 10). In this case, however, the parameter range shifts from smaller to higher values. Note that reversing the order of data does not result in a reverse of the results of the analysis, as we ap-ply a growing window, where the length of the data series increases.
The other parameters do not show clear relations to the or-dering of the data series and the parameter ranges remained
Fig. 7. Growing window identifiability analysis of the parameter
drd.
constant after one or two years of simulation. The uncer-tainty of the remaining parameters was comparable to the DYNIA analysis.
4 Discussion and outlook
The DYNIA analysis revealed different types of parameter behaviour. An intermittent identifiability was found for the cmelt parameter, which was only identifiable during snow melt periods. A relationship was found for the parameter drd with respect to observed discharge, which can be considered as a surrogate for catchment wetness. Currently, we have no insight in the process relations behind this observation. It might be possible, that the interflow generation, controlled by drd, may be a nonlinear process related to catchment wet-ness, soil moisture and/or antecedent rainfall. The observed discharge is an indirect measure of these factors. It is also possible, that the interflow process becomes less important for higher discharges and therefore drd becomes less identi-fiable. In this case, however, we would expect an increase of uncertainty only. The obvious shift of the parameter range to higher values for drd from 1–5 to 7–30 seems to be a good ar-gument to assume a systematic behaviour. High uncertainty or low identifiability was found for the remaining parame-ters, which can be considered constant within the limitations of this analysis. However, as processes act on different time scales, the large size of the window reveals only seasonal changes. Faster process interactions can not be resolved. The recession constants of direct runoff and interflow, for exam-ple, influence processes on a time scale of hours and days. Therefore they may reveal different patterns when analysed with higher temporal resolution of the moving window.
The results from the growing window analysis show that one or two years of simulation data contain sufficient
in-Fig. 8. Growing window identifiability analysis of the parameter
drd re-ordered by observed discharge (descending).
Fig. 9. Growing window identifiability analysis of the parameter
drd reordered by observed discharge (ascending).
formation to identify the model parameters cmelt and drd. Adding further data did not result in reducing the uncertainty or shifting further the optimum parameter range. Due to the low identifiability of the remaining parameters, no clear re-lations of the length of the data set were found.
The DYNIA algorithm and its modifications have proven to be useful tools for the assessment of identifiability of model parameters and problems of process representations implemented in the model. A first analysis revealed a state dependency of the drainage density parameter drd, which re-quires further analysis. Future analysis of the data set will consider additional state variables, e.g. temperature, soil moisture and other. Also, the window size will be varied to study more closely parameters related to fast and slow pro-cesses. We also intend to increase the number of Monte-Carlo simulations for the analysis.
150 G. Wriedt and M. Rode: Parameter uncertainty and identifiability of the hydrological model WaSiM-ETH
Edited by: R. Barthel, J. G¨otzinger, G. Hartmann, J. Jagelke, V. Rojanschi, and J. Wolf
Reviewed by: anonymous referees
References
Beven, K. and Binley, A. M.: The future of distributed models: model calibration and uncertainmty production. Hydrol. Pro-cesses 6, 279–298, 1992.
Hornberger, G. M. and Spear, R. C.: An approach to preliminary analysis of environmental systems, J. Environ. Manag., 12, 7– 18, 1981.
Schulla, J. and Jasper, K.: Model Description WaSiM-ETH. Internal report, IAC, ETH Z¨urich, 166 pp, 2001.
Shulla, J.: Hydrologische Modellierung von Flussgebieten zur Ab-sch¨atzung der Folgen von Klima¨anderungen, Diss., ETH Z¨urich, CH, 161 pp, 1997.
Spear, R. C. and Hornberger, G. M.: Eutrophication in Peel Inlet, II, identification of critical uncertainties via generalised sensitivity analysis, Water Res., 14, 43–49, 1980.
Wagener, T., McIntyre, N., Lees, M. J., Wheater, H. S., and Gupta, H. V.: Towards reduced uncertainty in conceptual rainfall-runoff modelling: Dynamic identifiability analysis, Hydrol. Processes, 17, 455–476, 2003.
Yapo, P. O., Gupta, H. V., and Sorooshian, S.: Automatic calibration of conceptual rainfall-runoff models: sensitivity to calibration data, J. Hydrol., 181, 23–48, 1996.