Direct democracy and resource allocation:
Experimental evidence from Afghanistan
The MIT Faculty has made this article openly available. Please share how this access benefits you. Your story matters.
Citation Beath, Andrew et al. "Direct democracy and resource allocation: Experimental evidence from Afghanistan." Journal of Development Economics 124 (January 2017): 199-213 © 2016 Elsevier B.V. As Published http://dx.doi.org/10.1016/j.jdeveco.2016.10.001
Publisher Elsevier BV
Version Original manuscript
Citable link https://hdl.handle.net/1721.1/127650
Terms of Use Creative Commons Attribution-NonCommercial-NoDerivs License
Direct Democracy and Resource Allocation:
Experimental Evidence from Afghanistan
1Andrew Beath
∗Fotini Christia
†Ruben Enikolopov
‡September 30, 2016
Direct democracy is designed to better align policy outcomes with citizen preferences. To test this proposition, we randomized whether 250 villages across Afghanistan selected projects by secret-ballot referenda or by consultation meetings. We find that referenda reduce the influence of local elites over both project type and location. Consistent with previous experimental results, we also find that referenda improve villagers’ perceptions of the local economy and of the quality of local governance. However, we find no systematic evidence that selecting projects via referenda increases the average impact of such projects.
I.
Introduction
Decentralization efforts in some developing countries have been undermined by the diversion of public resources by local elites (Bardhan 2002, Bardhan and Mookherjee 2006). Direct democracy, which promises to better align project resource allocation outcomes with public preferences, is one tool that has been used to address this problem (Matsusaka 2004, 2005). However, while recent evidence (Olken 2010) shows that direct democracy can improve the legitimacy of allocation processes per se, it also casts doubt on whether direct democracy can substantively affect allocation outcomes. Uncertainty thereby exists as to whether direct democracy is an effective tool to reduce elite capture over the allocation of public resources.
1 The authors would like to thank Claudio Ferraz, Phil Keefer, Ben Olken, Ekaterina Zhuravskaya, and seminar
participants at Columbia University, NES, MIT, European Economic Association Congress, NBER Political Economy Meeting, IIES, and Paris School of Economics for helpful comments. The authors are indebted to Kirill Borusyak, Hamid Gharibzada, Chad Hazlett, Vera Mironova, and Maiwand Siddiqi for excellent research assistance and gratefully acknowledge the generous cooperation and assistance provided by Tariq Ismati and Abdul Rahman Ayubi, formerly of the National Solidarity Programme; Wais Barmak and Ehsan Zia, former Ministers of Rural Rehabilitation and Development; staff of AfghanAid, C.H.A., InterCooperation, IRC, NPO/RRRAA, Oxfam UK, and People-in-Need; and Philippe Dongier, Susanne Holste, Qazi Azmat Isa, Zishan Karim, Norman Piccioni, and Mio Takada of the World Bank. The study was financially supported by FAO, the World Bank, and the National Solidarity Programme. Ruben Enikolopov acknowledges financial support from the Ministry of Education and Science of the Russian Federation, grant No. 14.U04.31.0002 and Deutsche Bank Membership at IAS. Fotini Christia acknowledges support from ARO MURI award No. W911NF-12-1-0509. The findings, interpretations, and conclusions expressed in this paper are entirely those of the authors and should not be attributed in any manner to the World Bank, to its affiliated organizations, or to members of its Board of Executive Directors, or the countries they represent. The World Bank does not guarantee the accuracy of the data included in this publication and accepts no responsibility for any consequence of their use.
∗ World Bank ([email protected]).
† Department of Political Science, Massachusetts Institute of Technology ([email protected]).
This study draws on a field experiment conducted across 250 villages in Afghanistan to identify whether directly democratic procedures can limit elite influence, even in an environment where direct democracy conflicts with customary norms of local decision-making. In the experiment, half of the villages were randomly assigned to select local development projects by secret-ballot referenda, with the remainder assigned to select projects at public meetings convened by elected village development councils. The referendum procedure allocated funding to projects that received the most votes from villagers, while the meeting procedure allocated funding based on decisions made by development councils following the meeting. Both procedures employed an identical agenda-setting method, with the development council compiling the list of proposed projects after consultations with villagers.
In order to isolate the effect of direct democracy on allocation outcomes generally and on the ability of elites to realize their preferences specifically, we compare allocation outcomes with the ex-ante preferences of (non-elite) male villagers and with those of male elites. We find that male villagers’ preferences are a significant determinant of allocation outcomes in both referenda and consultation meetings. However, the preferences of male elites matter only in consultation meetings. Projects selected by referenda are also located farther away from the houses of village headmen. The preferences of female elites, who are traditionally excluded from village-level decision-making, do not affect allocation outcomes regardless of the decision-making rules. Overall, our results indicate that direct democracy limits elite influence over resource allocation.
Theoretically, the welfare effects of reducing elite influence over resource allocation are ambiguous. Differences between elite and public preferences may reflect not only different interests but also informational advantages of elites (Labonne and Chase 2009; Rao and Ibanez 2005; Owen and van Domelen 1998). It is thus feasible that direct democracy may reduce general welfare even while limiting elite influence. However, evidence provided by subjective measures of welfare appears to discount this possibility by showing that referenda improve villagers’ assessments of their situation. This effect on subjective perceptions appears to be caused both by the process itself and by the reduction in elite influence. Specifically, referenda improve villagers’ perceptions of the local economy and of the quality of local governance, even when project type is controlled for, with villagers’ perceptions also improved, when selected projects are less aligned with elite preferences. Objective measures of welfare, however, don’t align with subjective effects. In particular, referenda have no systematic effect on the speed of project implementation, the impact of projects on development outcomes, or on household income or consumption.
Research on direct democracy has examined effects on the size of government (Matsusaka 1995; Funk and Gathmann, 2011), political participation and redistributive spending (Hinnerich and Pettersson-Lidbom, 2010), discriminatory local policies (Hainmueller and Hangartner, 2015), and happiness (Frey and Stutzer, 2005). Using experimental variations similar to those employed in this study, Olken (2010) finds a strong positive effect of the use of direct democracy in Indonesia on
villagers’ satisfaction, but no effect on the choice of the general project itself, other than a relocation effect of women’s projects towards poorer areas. Our study contributes to the literature on the effects of political decision rules, in general, and direct democracy in particular. We extend the analysis of Olken (2010) by increasing the sample size and examining the effect not only on resource allocation and subjective assessments of project quality, but also on the speed of project implementation, on project effectiveness, and on household welfare. Our results reinforce the finding of Olken (2010) that direct democracy can improve subjective outcomes, but differ from Olken (2010) in demonstrating that referenda can reduce the influence of elites over allocation outcomes.
This paper is divided into six sections: Section II describes the setting of the experiment; Section III describes the design of the experiment, sample, and data collection; Section IV presents the methodology and results of the empirical analysis; Section V discusses the results; and Section VI concludes.
II. Background Information
The field experiment described in this paper was undertaken in coordination with the National Solidarity Program (NSP), a nationwide community-driven development program executed by the Government of Afghanistan. The following sections provide further details on NSP (II.1) and the structures for local governance and decision-making in rural Afghanistan (II.2).
II.1. National Solidarity Program
NSP was devised in 2002 by the Government of Afghanistan to deliver services and infrastructure to the rural population and build representative institutions for village governance. NSP has been implemented in over 35,000 communities across all of Afghanistan’s 34 provinces and has financed 90,000 development projects at a cost of $2.3 billion, making it the largest development program in the country. The program is structured around two interventions: (i) the creation of an elected Community Development Council (hereafter, development council); and (ii) the disbursement of block grants to the development council for implementation of village projects. The program is executed by the Afghan Ministry of Rural Rehabilitation and Development, facilitated by contracted NGOs, and funded by bilateral and multilateral donors.
In order to encourage more representative institutions for village governance, NSP mandates the creation of a gender-balanced development council through a secret-ballot, universal suffrage election. Once development councils are formed, NSP disburses block grants valued at $200 per household – up to a village maximum of $60,000 – to fund local development projects,2 with villages
required to contribute at least 10 percent of project costs, which they largely do in the form of labor. The development council selects projects in consultation with the village community. Selected projects are ordinarily focused on the construction or rehabilitation of local small-scale infrastructure (e.g., drinking water facilities, irrigation canals, roads and bridges, or electrical generators) and human capital development (e.g., training and literacy courses).
The development council is mandated to consist of an equal number of male and female members, with the total size being proportional to the number of families residing in the village. The average size of development councils in the sample is 16 people. There is a moderate degree of overlap between development councils and customary leaders. Villagers identified approximately 40 percent of development council members, and 70 percent of development council heads, as belonging to the pre-existing elite (Beath et al. 2016).
NSP implementation in a single village generally takes around three years. Following the creation of development councils, an average of twelve months elapses before project implementation starts, as development councils and villagers select and design projects (the stage of the process examined in this paper), receive funds, and, if necessary, procure contractors for project construction. Once construction commences, it takes up to nine months for projects to become operational, although the timeline varies significantly based on project type.
NSP does provide repeat block grants to participating villages, although the contingencies of donor funding to the program mean that there is no set schedule by which such grants occur. The process for conducting follow-up elections for the development council is also uncertain. Per NSP rules, villages are supposed to hold reelections for development council positions every four years, although as follow-up elections are not facilitated, it is unclear whether these occur. Given this, and the general uncertainty which accompanies planned future development activity in Afghanistan, villagers potentially perceive NSP as a one-shot event, which limits the scope for log-rolling among local actors.
II.2. Local Governance and Public Decision-Making in Rural Afghanistan
The lack of state consolidation in Afghanistan and the country’s recent history of violent conflict have resulted in a weak central government (Barfield 1984). Rural communities have thus developed sophisticated – albeit informal – customary local governance structures and practices to administer justice, set community rules, and provide local public goods (Shahrani 1998; Pain and Kantor 2010). Despite the attempted reorganization and politicization of local governance by various regimes over the past decades (Nojumi, Mazurana, and Stites 2004; Rahmani 2006), customary local governance structures and practices are generally considered to remain active in local public decision-making (Brick 2008; Kakar 2005).
The foundation of governance in rural Afghanistan is the local jirga or shura, a participatory council that has traditionally managed local public goods and adjudicated disputes (Nojumi, Mazurana and Stites 2004). Council members tend to be elders of families in the village (Rahmani 2006) and convene when there is an issue to resolve (Boesen 2004). In addition to councils, villages ordinarily have a headman (termed a malik, arbab, or qariyadar) - usually a large landowner - who serves as a liaison between the village and the sub-national government (Kakar 2005). The local religious authority, the mullah, is responsible for conducting rites and mediating disputes involving family or moral issues (Rahmani 2006). The accountability of these institutions varies with the degree to which villagers are economically dependent on local elites (Pain and Kantor 2010).
A salient feature of the jirga and shura is the practice of decision-making by consensus. The consensus-based principle is considered to increase acceptance of decisions, but can be compromised by the pronounced social inequality that exists in parts of rural Afghanistan (Boesen 2004), with decisions effectively made by a narrow group of prominent tribal elders (Kakar 2005). Due to the principle of purdah, which stipulates that women should be generally hidden from public view (Azarbaijani-Moghaddam, 2009), women do not participate in the shura or jirga and are excluded from local decision-making.
III. Experimental Design
This section discusses the randomization of allocation procedures in the 250 treatment villages in the evaluation (III.1), while also detailing the sample (III.2), and the phasing of the experiment and data collection (III.3).
III.1. Allocation Procedures
Following the election of the development council, villages select and prioritize projects to be funded by the NSP block grant. Villages in the sample were randomly assigned to one of two such procedures:3
Referendum: All adult village residents - both men and women - are eligible to vote, by secret ballot, for the project that they most prefer out of a list of proposed projects. At least 50 percent of eligible voters in the village must vote in order for the referendum to be valid. Projects with the most votes are selected for implementation, with the number of selected projects determined by the size of the block grant. Selected projects are prioritized according to the number of votes received, so the sequence of implementation reflects the project’s relative popularity.4
3 A detailed guide on the procedures is available at: http://nsp-ie.org/toolsanddata/sti/sti2e.doc
4 In less than 8 percent of villages, the prioritized project was not the one receiving the most votes. Our results are
Consultation Meeting: The development council convenes and moderates a meeting, open to all villagers - men and women - to discuss and select projects for funding. There is no specific requirement on how many villagers must attend in order for the meeting to be valid. Informal points-of-procedure (e.g., a show-of-hands) may be employed during the meeting, but no formal vote takes place. Based on the outcome of the discussion, but at its ultimate discretion, the development council selects and prioritizes projects for funding.5
Under both allocation procedures, the list of proposed projects is prepared using an identical agenda-setting procedure, whereby the development council compiles the list after consultation with the villagers. After the list of proposed projects is compiled, villagers cannot change the agenda irrespective of the method of project selection.6 Importantly, the allocation procedure was
announced before the list of proposed projects was prepared. III.2. Sample and Randomization
The randomization of allocation procedures occurred in 250 villages assigned to receive NSP, which formed the treatment group for the randomized impact evaluation of NSP.7 The 250 villages are
evenly split across ten districts in northern, northeastern, eastern, central, and western Afghanistan (see Figure A1 in the Online Appendix).8 Despite the necessary exclusion of southern areas from the
sample due to security concerns, the 10 districts are broadly representative of Afghanistan’s ethno-linguistic diversity, with five predominantly Tajik districts, four predominantly Pashtun districts, one predominantly Hazara district, and two districts with significant populations of Uzbek and Turkmen minorities.
Data from the 2007–08 National Risk and Vulnerability Assessment (NRVA) allow for a comparison of the 250 sample villages with a randomly selected sample of the population of rural Afghanistan. Although there are no significant differences in the age of respondents or in their income (see Table A1 in the Online Appendix), sample villages are slightly more likely to be engaged in production activities related to agriculture and have slightly worse access to medical services and better access to electricity.These differences are likely to be driven by the fact that villages located close to provincial centers were more likely to receive NSP in the first phase of the program, whereas the sample is drawn from those villages mobilized by the second phase of NSP.
5 This procedure is similar to the customary practice in rural Afghanistan of calling a jirga or shura to decide on important
community matters.
6 Although the nature of the consultation meeting would have allowed villagers to suggest a change in the list of
proposed projects, there is no indication in the monitoring data that this happened. However, as the method of project selection was known when the lists of proposed projects were prepared, village leaders may have strategically chosen proposed projects (see discussion below).
7 The effects of the NSP program on women’s rights and on violence are analyzed in Beath, Christia, and Enikolopov
(2013, 2016). In this paper, however, we focus on the comparison of allocation procedures within villages that have received NSP, rather than on the comparison with the villages that have not received the program.
In addition to allocation procedures, the NSP impact evaluation also randomized the method of development council election (Beath et al. 2016).9 To ensure random and independent assignment
across both election and allocation dimensions, villages were divided in quadruples using an optimal greedy matching algorithm (King et al., 2007). Specifically, 25 treatment villages in each district were paired to minimize differences in background characteristics10 within each pair (leaving one village
unpaired) and then matched in pairs of pairs to form quadruples.11 Unpaired villages across districts
were also grouped into two quadruples (leaving two villages unmatched). Each village within the quadruple (and the two unmatched villages) was then randomly assigned to one of four combinations of allocation procedures and development council election procedures. This assignment procedure ensures that each village in the sample had an equal probability of being assigned to either procedure.
[TABLE 1 HERE]
The randomization resulted in a well-balanced set of villages between the two allocation procedures. Table 1 presents a comparison between the two groups of villages across various pre-intervention characteristics. The differences between the two groups never exceed 13 percent of the standard deviation. A comparison of means indicates that for only one of eighteen indicators is the difference significant at the 10 percent level, with a p-value of 0.096.
III.3. Phasing of Intervention and Data Collection
The baseline survey was administered in September 2007, prior to the assignment of allocation procedures. Development council elections occurred between October 2007 and May 2008 and the resource allocation process took place between November 2007 and August 2008.12 Both
development council elections and the resource allocation process were monitored, providing additional data on the respective processes. The midline survey was administered between June and October 2009 following the start of project implementation. The endline survey administered between May and October 2011, at which time 99 percent of NSP-funded projects in the sample villagers were fully completed. Data on the location of NSP and non-NSP projects was collected between June and November 2011.
9 Since there are no clear theoretical predictions on how the method of development council election should affect elite
influence, we do not separate between villages with different methods of elections in our analysis. We check that there are no significant differences in the identified effects between villages with different methods of council elections.
10 These characteristics include village size (based on data collected by Afghanistan’s Central Statistics Office) and a set
of geographic variables (distance to river, distance to major road, altitude, and average slope).
11 Pairs of pairs were formed by performing the same matching procedure treating each pair as a single village with
background characteristics that equal the average of the respective characteristics for the two villages in a pair.
III.4. Resource Allocation Process
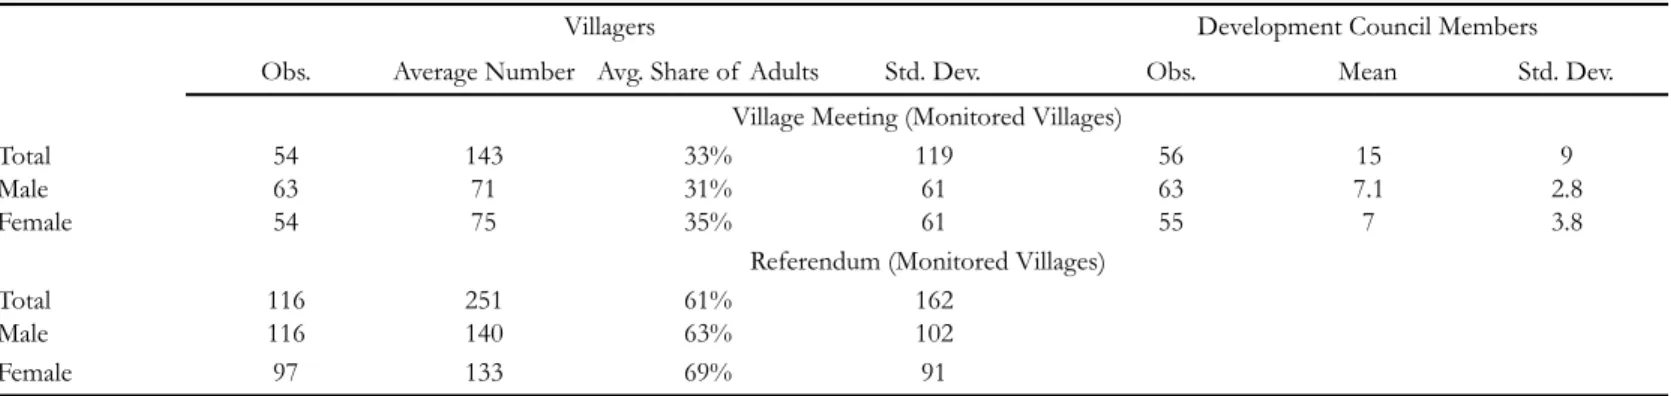
To assess compliance with the prescribed allocation procedures (see Section III.1), we monitored the implementation of procedures in 127 randomly selected villages (63 villages assigned to meetings and 64 villages assigned to referenda).13 Data was generated both by monitors’ observations and by
1,238 interviews of male villagers conducted following their participation in the allocation process. For villages that held referenda, we obtained data on voting outcomes for all villages, including for villages that were not monitored.
[TABLE 2 HERE]
On average, 12 development council members and 143 villagers attended village meetings, which is about one-third of the average adult population of the sample villages (see Table 2). Monitoring data indicates that council members dominated meeting discussions, with approximately half of the council members expressing their opinion compared to only eight male villagers and one-of-twenty female villagers in attendance.
Participation in referenda was substantially higher, with an average of 251 villagers voting, which constitutes slightly more than 60 percent of the average adult population. The requirement that turnout reach 50 percent of the population was satisfied in all villages. Referenda were administered with a generally high degree of professionalism: 99 percent of monitored polling stations had lists of eligible voters, 97 percent of stations checked names off a registration list, and voters’ privacy was considered to be assured in 83 percent of villages. In every monitored referendum village, those projects that received the most votes were selected. A monitor considered the vote-counting process to be flawed only in one village. In 98 percent of monitored referenda, allocation results were announced immediately following the counting of votes.
Results of post-selection interviews indicate that the process enjoyed a high degree of legitimacy. Although 40 percent of respondents in both groups reported that some important projects had not been considered, almost all respondents expressed their general satisfaction with the allocation procedure. 99 percent of respondents in referendum villages and 93 percent in meeting villages believed that the allocation results would determine which projects would be implemented.
IV. Data
We identify the effects of direct democracy on four sets of outcomes of interest: (i) degree of alignment between resource allocation outcomes and elite and non-elite preferences; (ii) location of projects relative to the houses of members of the village elite; (iii) subjective measures of economic
13 Visits of monitors were unannounced and monitors were explicitly instructed not to interfere in the allocation process
or try to affect the outcome in any way, so as to provide an unbiased picture of the implementation of allocation procedures in the sample.
welfare and of the quality of local governance; and (iv) project implementation and performance. The following sections provide further information on the sources of data on ex-ante project preferences (IV.1); allocation process (IV.2); allocation outcomes (IV.3); project location (IV.4); subjective measures of welfare (IV.5); and project implementation and performance (IV.6).
IV.1. Ex-Ante Project Preferences
Data on ex-ante preferences is drawn from the baseline survey. In each village, the survey was administered to ten randomly selected male heads-of household and a focus group of male village leaders. The male focus group was comprised of between six and nine of the most important male leaders in the village, who were ordinarily members of the male village shura / jirga.14
In each of the survey instruments, respondents were asked to indicate – from a list of fifteen potential project types – the type of project that they believed should be selected if the village was provided with a $60,000 grant.15 Using this data, we construct village-level dummy variables
indicating the type of project most frequently preferred by each group of respondents.16 This
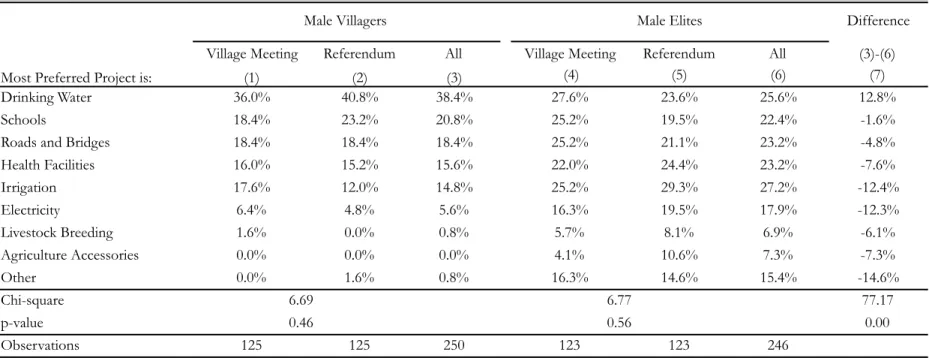
provides village-level measures of the preferences of ordinary male villagers and male elites. [TABLE 3 HERE]
Table 3 reports the proportion of villages in which a particular type of project was preferred by the majority of respondents in each respective group.17 The results indicate that there are no significant
differences in the distribution of project preferences in villages assigned to the two different allocation procedures. In particular, a chi-square test does not reject the hypothesis that they are drawn from the same distribution.
There is a noticeable difference, however, in the preferences of male villagers and those of male elites. A chi-square test rejects the hypothesis (at the 0.1 percent level) that the distributions of preferences of these two groups are the same. Drinking water projects are most preferred project among male villagers by a large margin, followed by schools and roads and bridges. The most preferred project for male elites is irrigation, followed by drinking water projects, health facilities,
14 Where the village had a functional village council, enumerators were instructed to request the participation of all of the
regular members of the body in the focus group. If no village council existed in the sample village, enumerators were instructed to convene a meeting of the village headman and other residents of the village that were identified as local power-holders by the villagers.
15 Respondents in the focus groups were asked to identify one project from a list of 15 possible projects, while individual
respondents were asked to select and prioritize three projects from the same group of 15. To ensure comparability, we focus on the project that was named as the most important in the individual surveys.
16 In the event of two or more projects having the same number of respondents preferring them and these numbers
exceeding the number of respondents preferring other projects, the respective projects were all marked as the most preferred. Answers to the question about project preferences for male elites were not available for four villages (two referendum and two village meeting villages).
17 The results are similar if we look at individual-level preferences – that is, the share of respondents in the respective
and roads and bridges. The magnitude of these differences is substantial: irrigation projects are almost twice as popular among male elites as they are among male villagers; the difference for electricity projects is almost threefold. These differences in preferences reflect the higher likelihood of elites owning land requiring irrigation or appliances that use electricity.
[FIGURE 1 HERE]
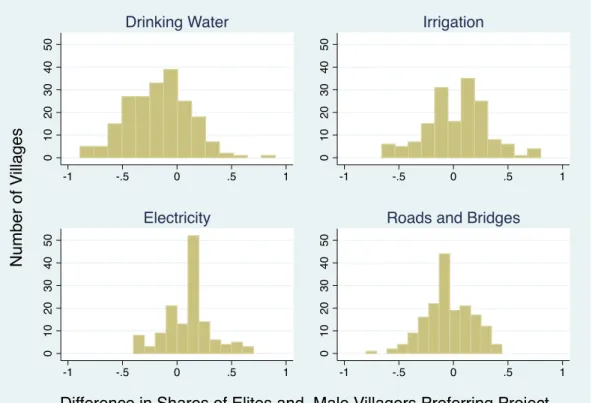
The preferences of male villagers and male elites diverge not just in aggregate, but also within villages. Only in 45 percent of villages was the same project preferred by male villagers and male elites. There is also high variance in the shares of male villagers and male elites that prefer different projects. Figure 1 shows that the distribution of these differences is widely spread for the four types of projects that were most frequently implemented.18 Thus, in most villages, there was substantial
divergence in preferences of male villagers and male elites, both in the modal preferred project and the share of respondents from the group that supported the project.
In addition to preferences of male villagers and male elites, the baseline survey ascertained the preferences of members of a focus group of prominent women in the village.19 However, the
baseline survey was not administered to a random sample of female villagers due to financial and logistical constraints, so we do not have information on the preferences of (non-elite) female villagers. Due to this limitation and because women traditionally play a limited role in the village-level decision making process (see Section II.2 above), we focus on the comparison between male villagers and male elites in the benchmark specification and analyze female preferences separately. IV.2. Resource Allocation Outcomes
Data on allocation outcomes indicates whether a particular project was (i) proposed; (ii) selected; and (iii) prioritized. Data was provided by NGOs overseeing the allocation process for 235 out of the 250 villages in the sample.20 The data covers 1,204 proposed, 641 selected, and 229 prioritized
projects. Table 4 tabulates outcomes by procedure. The median numbers of proposed, selected and prioritized projects in the sample were five, three, and one respectively and there were no statistically significant differences in these numbers between villages assigned to different procedures.
[TABLE 4 HERE]
18 This figure excludes projects that did not have a single respondent (either a male villager or a member of the male
elite) supporting them. Taking such projects into account adds a large mass of projects at zero in the distribution of differences in preferences (see Figure A2 in the Online Appendix).
19 Members of the female focus group were mostly the relatives (wives, daughters etc.) of male power holders in the
village, with half of the respondents indicating that a member of their family is a member of the village shura / jirga. This information was not available for two villages (one referendum and one village meeting village).
20 The 15 villages for which the data was not received included 7 villages that did not comply with the assignment of
NSP treatment (which was driven primarily by the confusion between villages with similarly sounding names) and villages where the NGO had not gathered the necessary information. In both cases attrition is not correlated with the assigned allocation procedure.
The most frequently proposed selected and prioritized projects were: roads and bridges; irrigation; drinking water; and electricity. Schools and health facilities, despite being preferred by relatively large numbers of both male villagers and male elites, were very rarely proposed due to a requirement that such project types be coordinated with the respective government ministries.21
Road and bridge projects - which had the smallest divergence of preferences between male villagers and male elites (see Table 3) - were the most likely to be proposed and selected, but were the least likely of the four main project types to be prioritized. Drinking water projects, which were more popular among male villagers than among male elites, were the second most likely to be prioritized and selected. Electricity projects, which were more popular among male elites than among male villagers, were the least popular at the proposal and selection stage, but were the most likely to be prioritized.
Although the allocation procedure had no statistically significant effect on the type of projects proposed or selected, electricity projects were much more likely to be prioritized in referendum villages. While this result indicates prima facie that allocation outcomes produced by referenda are relatively more closely aligned with male elite preferences, the effect of referenda on prioritization of electricity projects is significant only in villages where electricity projects were not ex-ante preferred by either elites or male villagers. Accordingly, the result is orthogonal to the effect of the alignment of selection outcomes with ex-ante preferences, which is the focus of our analysis.22
[TABLE 5 HERE]
The high variance between villages in preference differentials (see Section IV.1) implies that aggregate differences in preferences and allocation outcomes reported in Table 4 are not necessarily informative about differences in preferences and allocation outcomes within villages. To address this, Table 5 lists the share of proposed, selected, and prioritized projects in each village that were ex-ante preferred by male villagers and/or by male elites. While the share of proposed, selected, and prioritized projects preferred by male villagers is similar across both meeting and referendum villages, the share of proposed, selected, and prioritized projects preferred by male elites is consistently lower in villages that held a referendum. The difference between the two procedures for prioritized projects – 39 percent to 23 percent – is statistically significant. These results indicate that
21 In the analysis that follows we exclude irrelevant projects (using the same approach as Chattopadhyay and Duflo
2004) by grouping the 15 possible project types into five categories: (i) roads and bridges; (ii) irrigation; (iii) drinking water; (iv) electricity; and (v) other (which include men's courses, health courses, schools, health facilities, seeds, agricultural equipment, livestock, microfinance programs, communal toilet facilities, and community centers). The four types of projects not included in the “other” category are the four most popular types of selected projects. If there were more than one project of the same type in a village, they were combined into a single project. The differences in preferences between male villagers and male elites persist if we group projects in these five categories (see Table A3 in the Online Appendix).
22 There are no good theoretical reasons for referenda to favor a specific type of project, so this difference might reflect
changes in preferences that occurred over the several months between the time we measured ex-ante preferences and the time the allocation of resources took place.
male elite preferences exercise less influence over allocation outcomes in referendum villages. Section V.I below provides a formal test of this hypothesis using differences in the proportions of the different groups that preferred a particular type of project.
Information on project budgets is also available from NSP administrative data. Across the 250 villages in the sample, budget data is available for 509 projects in 244 villages. The average budget of a project was $15,129 with a standard deviation of $13,696. There were no significant differences in the budgets of projects in villages that held village meetings as compared to those that held referenda.
IV.3. Project Location
In addition to the type of project, decisions on project location can be contentious. The placement of a well for drinking water outside the house of the village headman, for instance, would disadvantage villagers living in other parts of the village. In order to estimate the effect of referenda on the location of projects vis-à-vis the residence of local elites, GPS coordinates of development projects in sample villages were collected during the endline survey that was administered after the completion of development projects in 2011.
Data on the location of projects and the houses of village headmen were collected in only 175 out of the 250 sample villages, since some monitors failed to collect coordinates due to security concerns and other issues. Attrition is not correlated with the assigned procedure, however, with data available for 91 meeting villages and 84 referendum villages. Out of 541 projects for which GPS coordinates were collected, 339 were funded by NSP. The average distance between projects and the house of the village headman was 545 meters for NSP projects and 445 meters for non-NSP projects.23
IV.4. Subjective Measures of Welfare
Information on villagers’ perceptions of local economic and governance outcomes comes from the midline and endline surveys (see Section III.3). The midline and endline surveys were designed to be administered to the ten randomly selected households surveyed at baseline, with separate questionnaires for male household heads and a senior woman in the household. The midline survey was administered to 2,367 male and 2,141 female respondents and the endline survey was administered to 2,130 male and 1,858 female respondents.24
23 Of the 175 villages for which project coordinates are available, 98 villages had the same village headman when the data
was collected as during project selection. There is no difference in the share of village headmen who have retained their position in meeting villages as compared to referendum villages.
24 Because of the deterioration in security conditions, we were not able to conduct surveys of male heads of household in
11 villages at midline and in 32 villages at endline. For female heads of household the surveys were not conducted in 33 villages at midline and in 59 villages at endline. Differences in levels of attrition between villages with different project selection method are not statistically significant. Enumerators administering the male household questionnaire were
To measure villagers’ perceptions of local economic and governance outcomes, we use four perception-based binary indicators from male and female household surveys: (i) respondent disagrees with a recent decision or action of the village leadership; (ii) respondent is satisfied with the work of village leaders; (iii) respondent perceives that the household is better off than it was last year; and (iv) respondent attributes positive economic changes to actions of the village leadership (available only for the midline survey). These measures are aggregated into a summary measure based on an equally weighted average of z-scores.25
The information on satisfaction at midline was collected at a time when 90 percent of NSP-funded projects had begun implementation and 20 percent of projects had already been completed. At this point, villagers had an opportunity to observe the characteristics of the project (such as location, construction method, and construction quality), even if they were not benefiting from it at the time. Accordingly, the measures are likely to measure satisfaction with allocation outcomes, rather than the allocation procedure per se. Satisfaction at endline is likely to reflect the longer-term effects of the selection method, as the information was collected at a time when all projects had been completed, and more than 80 percent were operational for over a year.
IV.5. Project Implementation and Performance
Using NSP administrative records on the start and end dates of 478 projects implemented across the sample villages, we construct two measures of the speed of project implementation. The first measure reports the number of days from January 1, 2008 until the start of the project. The second measure reports the number of days from January 1, 2008 until the end of the project. Both measures are winsorized at the 95th percentile. Project start dates range from April 2008 to February 2011 and completion dates range from July 2008 to September 2011.
Project impact is assessed with measures of project effectiveness and general economic welfare collected by the midline and endline surveys. Project effectiveness is assessed by eight outcomes associated with drinking water, electricity, irrigation, and road and bridge projects: (i) number of seasons in past year during which primary source of drinking water was perceived to be contaminated (drinking water); (ii) incidence of diarrhea among children in the past two weeks instructed to locate and interview the same households and, whenever possible, the same villagers who participated in the baseline survey. Enumerators were able to successfully locate such respondents in 65 percent of households in which male respondents were interviewed during the baseline survey. The main reason why enumerators were not able to interview baseline respondents was that the person was away from home on the day the survey team visited the village, as it was harvest season. Differences between villages with different project selection procedures are not statistically significant for individual-level attrition. We also check that the effect on attrition of such characteristics of respondents as age, income, assets, size of household, education, and ethnicity are similar in villages with different project selection rules.
25 The first indicator is taken with a negative sign, so higher values are associated with better outcomes for all indicators.
For observations in which one or two out of the four indicators are missing, we calculate the average based on non-missing indicators. For observations with more than two indicators non-missing, the summary measure is non-missing. There are no significant differences in the number of missing observations across the two groups of villages.
(drinking water); (iii) hours of electricity available in past month (drinking water); (iv) yield of most recent harvest (irrigation); (v) revenue from most recent harvest (irrigation); (vi) cost of transporting of 50 kilograms of wheat to the district center or nearest market place (roads and bridges); (vii) duration of most recent trip to the district center or nearest market place (roads and bridges); and (viii) number of trips made to the district center in the past month (roads and bridges). General economic welfare is assessed by two household-level outcomes: (ix) annual household income; and (x) annual household expenditure.26
V. Results
The following sections report the effects of variation in project allocation procedures on: resource allocation outcomes (V.1); allocation outcomes with respect to female preferences (V.2); project location (V.3); perceptions of villagers (V.4); and project implementation and performance (V.4). V.1. Effect of Male Villager and Male Elite Preferences on Resource Allocation Outcomes
We seek to test the hypothesis that the resource allocation procedure affects the relationship between villagers’ preferences and resource allocation outcomes. This hypothesis is similar to Chattopadhyay and Duflo (2004), which estimates the effect of mandated women’s representation on men’s and women’s preferences over the provision of local public goods. Accordingly, the specification that we use to test this hypothesis is similar. In particular, we estimate the following regression:
Y!" = ! ∗ ∆!ℎ!"#!"+ ! ∗ ∆!ℎ!"#!"∗ !!+ ! ∗ !ℎ!"# !"#$!"+ ! ∗ !ℎ!"# !"#$!" ∗ !!+ ! ∗ !" !"#$#"!"+ ! ∗ !" !"#$#"!"∗ !!+ !!+ !!+ !!"
(1)
where !!" is a resource allocation outcome, such as the budget of project p in village v or a dummy variable indicating whether project p was proposed, selected or prioritized in village v; ∆!ℎ!"#!" is the difference between the share of male elites in village v that prefer project p and the share of male villagers in village v who prefer the same project; !! is a dummy variable which equals one if village ! selected projects using referendum and zero otherwise; !ℎ!"# !"#$!" is the share of male villagers in village v who preferred project p. !" !"#$#"!" is a dummy variable that equals one if project p in village v was not preferred by any respondents (either male villagers or male elites); !! and !! are project type and quadruple fixed effects, respectively.27 Standard errors are clustered at the village level.
26 Variables (iv)-(vii) were winsorized at the 95th percentile and logged.
27 We follow Bruhn and McKenzie (2009) in including quadruple fixed effects to account for quadruple-wise matching at
In this specification, ∆!ℎ!"#!" is a measure of the strength of differences in preferences between male elites and male villagers, whereas !ℎ!"# !"#$!" is a measures of the strength of preferences of male villagers.28 If male elites indeed have disproportionate influence on resource allocation
outcomes and this influence is reduced in referendum villages, we expect coefficients !! to be positive and coefficients !! to be negative. By including ∆!ℎ!"#!" and !ℎ!"# !"#$!" in the same regression, we account for the fact that differences in preferences between male elites and male villagers may have different implications for resource allocation outcomes depending on the strength of male villager preferences. We include !" !"#$#"!" in the specification to account for the large number of projects that are not preferred by any male villagers or any male elites (see Figure A2 in the Online Appendix). This term accounts for non-linearity in the relationship between the vote share for projects and allocation outcomes.29
[TABLE 6 HERE]
Results of the estimation of equation (1) indicate that male elites exercised a disproportionate influence over which projects are prioritized by village meetings and the amount of money spent on projects (see columns 3 and 4 in Table 6). However, the influence of male elite preferences on which projects are prioritized is much weaker in referendum villages, with the difference between the effects under the two procedures being statistically significant at the 5 percent level. The sign of the coefficients for the effect on the type of projects that are proposed and selected is consistent with the results for prioritization, but are not statistically significant at conventional levels.
To examine the effects of referenda conditional on the agenda, we estimate the effect of preferences on whether proposed projects are selected and prioritized. Results in columns 6 and 7 of Table 6 indicate that, after the proposal stage, elites exert influence over which projects are prioritized by meetings and have no effect on allocation outcomes produced by referenda, with the difference in the effects being statistically significant at the 5 percent level.
The results further show that, irrespective of the allocation procedure, the strength of male villager preferences does not affect which projects are proposed, but has a strong influence on which projects are selected and prioritized and on the money spent on projects. Male village preferences also have a strong effect on whether proposed projects are selected and prioritized.30
28 The number of people mentioned as elite members is around 15, whereas the size of the villages is approximately
1,000.
29 Intuitively, the difference between projects that receive no support at all and those that receive at least one vote out of
ten is likely to be more important than the difference between projects that receive one and two votes out of ten. The results are similar if instead of projects that were not preferred by any male villagers or any male elites, we control for projects that were not preferred by any male elites or projects not preferred by any male villagers separately (see Table A4 in the Online Appendix).
30 Note that the negative sign of the coefficient ! reflects the fact that the measure of the share of male villagers in
V.2. Effect of Female Preferences on Resource Allocation Outcomes
Preferences of female respondents, who represent the female elite (see Section II.2 above), were significantly different from the preferences of male villagers. Female elites expressed much stronger preferences for drinking water projects and expressed weaker preferences for irrigation and road and bridge projects (see Table A4 in the Online Appendix).
[TABLE 7 HERE]
To estimate how referenda affect the influence of female elites, we estimate an equation similar to (1) but substitute the preferences of female elites for those of male elites. The results, presented in Table 7, indicate that differences in preferences between female elites and male villagers do not have a significant effect on the outcomes of resource allocation regardless of the selection method.31
V.3. Effect on Project Location
To examine the effect of referenda on the location of implemented projects, we estimate the following OLS regression:
ln 1 + !"#$%&'( !"
= ! + !!∙ !"#"$"%&'(!∙ !"#$ !"#$%#&!∙ !"#!"+ !!
∙ !"#"$"%&'(!∙ !"#$ !"#$%#&! ∙ !"! !"#!"+ !!∙ !"#"$"%&'(! ∙ !"##$%$&' !"#$%#&!∙ !"#!"+ !!∙ !"#"$"%&'(!
∙ !"##$%$&' !"#$%#&!∙ !"! !"#!" + !!∙ !"#$ !"#$%#&!∙ !"!!" + !!∙ !"#$ !"#$%#&!+ !!∙ !"#!"+ !!+ !!"
(3)
where ln 1 + !"#$%&'( !" is the natural logarithm of the distance (in meters) between project i and the house of the village head in village v; !"#$ !"#$%#&! indicates that the same person held the position of village headman during NSP project selection and during the collection of the GPS coordinates; !"#!" indicates whether project i was funded by NSP; !"##$%$&' !"#$%#&!= 1 − !"#$ !"#$%#&!; !"!#$%!" = 1 − !"#!"; and !! is a quadruple fixed effect. To ensure that results are robust to controlling for village size, we also include the median distance between houses across the ten randomly selected households from the baseline survey. Non-NSP projects are included in
a negative sign). Thus, to test whether the effect of the share of male villagers on the choice of project is different in referendum villages, it is necessary to test the equality of the coefficients, ! and !. The difference between these coefficients is not statistically significant in any of the specifications. Thus, the results indicate that the strength of male villager preferences had the same influence on outcomes regardless of the selection procedure.
31 The results are virtually the same if we also control for the difference in preferences between male elites and male
villagers – that is, add the terms ∆!ℎ!"#!" and ∆!ℎ!"#!"∗ !! from equation (1). There is also no significant effect of
the regression to account for the endogeneity of the location of the headmen’s houses.32 Thus, !
! identifies the effect of allocation procedures conditioning on the location of other development projects in the village.
We use two alternative approaches to account for possible correlation of residuals. First, we cluster standard errors at the village level to account for the fact that the treatment status is determined at the village level. Second, since the location of different projects is likely to be interdependent both within villages and between neighboring villages, we account for the possibility of spatial correlation of residuals. In particular, spatial correlation among projects is assumed to be declining linearly up to a distance cutoff and to be zero after that cutoff (Conley 1999; Hsiang 2010). We use the cutoff of 15 kilometers, but also check that results are robust to cutoffs of 10 and 20 kilometers.
[TABLE 8 HERE]
The results presented in columns (1) and (2) of Table 8 indicate that NSP projects selected by referenda were located farther away from houses of the village headmen, compared to NSP projects selected by meetings. The difference is statistically significant at the 10 percent level for clustered standard errors and at 5 percent for spatially correlated errors. There is no such effect for non-NSP projects or in villages where the village headman assumed his position after NSP projects were selected.
To test the robustness of these results, we exclude those projects for which the intensity of benefits provided is not necessarily associated with location. Specifically, we exclude electricity projects (the measure records the location of the generators and thus does not reflect which households receive electricity) and transportation projects such as roads and bridges (which benefit not only the households located near the repaired road or bridge, but all the households along the road). The results in columns (3) - (8) of Table 8 indicate that the magnitude of the estimate of the effect of referenda slightly increases if these projects are excluded and that the statistical significance of the estimate increases specifically after the exclusion of electricity projects.
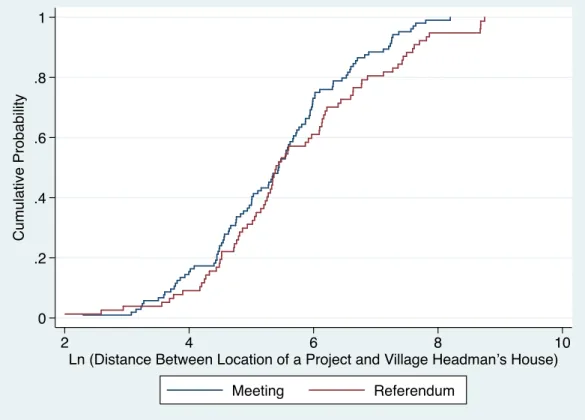
[FIGURE 2 HERE]
To check that the effect is not driven by outliers, Figure 2 provides a comparison of the conditional density functions of the distance between projects locations and the houses of village headmen for the sub-sample of villages in which the current headman held the position during project selection.
32 For instance, if the headmen tend to live near the center of the village and development projects are also more likely
to be located near the center, a correlation would exist between headmen’s homes and the location of projects, but would not be indicative of elite capture.
The distance for referendum villages nearly first order stochastically dominates the distance for meeting villages.33
V.4. Effect on Subjective Measures of Welfare
To examine the effect of referenda on how villagers perceive the local economic situation and the quality of local governance, we estimate the following OLS regression:
!!"!" = ! + ! ∙ !"#"$"%&'(
!+ !!+ !!" (4)
where !!"!" is the summary measure of perceptions for respondent i in village v; !"#"$"%&'(! is a dummy variable that equals one if village v was assigned to allocate resources by referendum and zero otherwise, and !! is a quadruple fixed effect. Standard errors are clustered at the village level. We estimate the regression for the full sample of respondents, as well as for male and female household respondents separately.34
[TABLE 9 HERE]
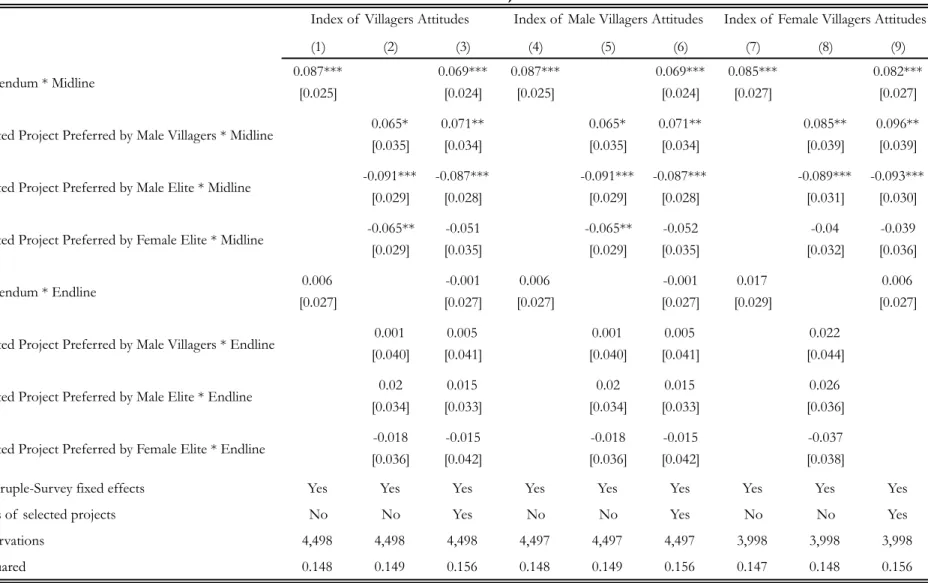
Column (1) in Table 9 presents the aggregate results, which indicate that villagers’ perceptions at midline were significantly more positive in villages that held a referendum, but that the differences disappear by endline. Results in columns (4) and (7) show that the effect holds for both male and female respondents. Thus, the results suggest that there is a positive but short-term effect of referenda on villagers’ perceptions.
To further explore whether elite influence over resource allocation affects villagers perceptions of the local economy and of the quality of local governance, we estimate the following OLS regression:
!!"!" = ! + !"#$ !" !
!!!
×!!"+ !!+ !!" (5)
where !"#$!" indicates whether any of the selected projects was preferred by group g in village v. As in the previous specification, we use a quadruple fixed effect and allow for clustering of standard errors at the village level.
Column (2) of Table 9 shows that elite influence over project selection is associated with significantly worse perceptions of local governance and the local economy at midline. Again, these differences disappear by endline. Perceptions at midline are significantly more positive where selected projects were preferred by male villagers and are significantly more negative if the selected projects were preferred by either the male or female elites. The results in columns (5) and (8) show
33 Figures A3 and A4 in the Online Appendix show that there is no such pattern if the sample consists of non-NSP
projects or of NSP projects in villages where the headman changed after project selection.
34 Analogous results for each of the individual indicators used in the construction of the summary index are reported in
that the direction of the effect is the same for both male and female respondents, but that it is statistically significant only for male respondents. While the results indicate that elite influence over project selection negatively affects villagers’ perceptions, such results – by virtue of the endogeneity of the alignment between the type of selected project and of preferences – do not necessarily reflect the causal effect of elite influence on villagers’ perceptions.
To determine whether the positive effect of referenda on villagers’ perceptions is driven by actual outcomes or by the process itself, we estimate the following regression:
!!"!" = ! + ! ∙ !"#"$"%&'(
!+ !"#$!" !
!!!
×!!"+ !!+ !! + !!" (6) where all the variables are the same as above and !! is a project type fixed effect. Thus, the specification estimates the effect of the allocation procedure on villagers’ perceptions, controlling for preference alignment and the type of selected projects.
Results presented in column (3) of Table 9 indicate that the effect of referenda on villagers’ perceptions at midline slightly decreases in magnitude, but remains statistically significant. The results in columns (6) and (9) show that the effect holds for male as well as for female respondents. Thus, the results suggest that the effect of referenda on perceptions is driven mainly by the process, rather than by differences produced by referenda in allocation outcomes. As in the previous case, the results are merely suggestive given the endogeneity of the alignment between preferences and allocations.
V.5. Effect on Project Implementation and Performance
To examine the effect of referenda on the speed of project implementation, we estimate the following OLS regression:
!!" = ! + ! ∙ !"#!+ !!+ !!+ !!" (7)
where !!" is a measure of how quickly project p in village v was started or completed (as per NSP administrative data); !"#! is a dummy variable that equals one if village v was assigned to allocate resources by referendum and zero otherwise; !! is a project type fixed effect; and !! is a quadruple fixed effect. Standard errors are clustered at the village level. In some specifications we also include as control variables the number of projects implemented in village v and the logarithm of the budget of project p in village v.
The results in Table 10 indicate that projects selected and prioritized through referenda start and finish slightly earlier than those selected by meetings, but that the difference is not statistically significant.
To assess the effect of referenda on measures of project performance, we examine how it affects villagers’ access to basic services and infrastructure and objective measures of household welfare, such as income and consumption. We estimate the following OLS regression:
!!"# = ! + !!∙ (!"#!×!!) + !!∙ (!"#!×!!) + γ ∙ !!+ !!∙ !!+ !!∙ !! + !!"# (8) where !!"# is a household-level outcome provided at midline (t = 1) or endline (t = 2) by respondent
i in village v; !"#! is a dummy variable that equals one if village v was assigned to allocate resources by referendum and zero otherwise; !! is the dummy for time t, and !! is a quadruple fixed effect. Standard errors are clustered at the village level.
The results presented in Table 11 indicate that referenda increase harvest revenue (row 5) and reduce transportation costs (row 6) at midline, potentially suggesting that the procedure is more effective for irrigation and transportation projects. However, neither of these effects is present at endline. Rather, at endline, referenda have a statistically significant negative effect on harvest yields (row 4), while reducing the number of seasons that villagers went without clean drinking water (row 1).
[TABLE 11 HERE]
The endline effects offer indicative evidence that referenda improve the effectiveness of drinking water projects, while decreasing the effectiveness of irrigation projects. Since drinking water projects are relatively preferred by male villagers while irrigation projects are relatively preferred by male elites, such results also suggest that referenda improve the effectiveness of projects preferred by villagers while diminishing the effectiveness of projects preferred by elites. However, as the choice of project type – and thereby the impact on the outcomes associated with such projects – is endogenous to the method of selection, the results on project impact should be interpreted with caution.
The results in rows 9 and 10 indicate that the method of project selection has no effect, at midline or endline, on levels of household income or consumption. There is thus no evidence to indicate that referenda have any effect on objective measures of household welfare. Overall and based on the effects observed on general economic outcomes, the conclusion remains that there is no evidence to indicate that referenda have any effect on objective measures of household welfare.
VI. Discussion of Results
In theory, direct democracy moves allocation outcomes closer to the position of the median voter (Romer and Rosenthal, 1979). In so doing, direct democracy can resolve principal-agent problems that induce divergence between public preferences and the policy outcomes of representative democracies (Kau and Rubin, 1979; Kalt and Zupan, 1984; Peltzman, 1984). However, where divergence between policy and public preferences arises not because of differences in interests but
due to information asymmetries over the potential benefits of different policy choices (Maskin and Tirole, 2004), direct democracy may negatively impact welfare outcomes. The welfare effects of direct democracy are further complicated by the extent to which the allocation procedures allow the “unbundling” of different issues and prevents logrolling (Matsusaka, 1995), which has ambiguous welfare effects (Buchanan and Tullock, 1962).
Given the extent to which local authority is concentrated in traditional elites, resource allocation exercises in rural Afghanistan are likely to be seriously afflicted by principal-agent problems. Although development council members are democratically elected, their reelection concerns are weak given ambiguity over when follow-up elections will occur. Conversely, information asymmetries over the potential benefits of different project options are unlikely to be significant given the local nature of projects, the ability of villagers to discuss proposed projects before selection, and the absence of distortions caused by special interest groups or mass media. Although logrolling allows elites in traditional representative systems to deviate from median voter preferences, the role of such practices in this context is likely to be limited since the allocation procedure is broadly conceived as a one-shot event due to uncertainties concerning the timeline of future projects.
The results of the study indicate that, in this context, allocation procedures affect the relative ability of elites to influence allocation outcomes. Specifically, allocation decisions made through consultative procedures grant more influence to elites over the type and location of projects, relative to directly democratic procedures. The results further indicate that elite influence over allocation decisions lowers general satisfaction with the local leadership and worsens perceptions of the local economy and the quality of local governance.35 Taken together, these results suggest that, in this
context, direct democracy mitigates elite capture of resources arising from principal-agent problems, rather than affecting benign forms of elite control that account for asymmetric information and which might increase public welfare.
The finding that consultative procedures grant elites greater influence over allocation decisions appears to result in part from the dominance by development council members in meetings. According to monitoring data collected during consultation meetings, development council members had more influence than other attendees in the selection of projects in 98 percent of meetings, and in 35 percent of meetings, council members fully determined the choice over the final
35 Referenda increase villagers’ satisfaction, even after controlling for the type of selected project. At the same time,
satisfaction is affected by selection outcomes per se, with lower levels of satisfaction in instances where selected projects were preferred by elites and higher levels in cases where selected projects were preferred by villagers. The results thus suggest that direct democracy increases satisfaction both as a result of the process itself as well as by better aligning allocation outcomes with public preferences.