HAL Id: hal-02329642
https://hal.archives-ouvertes.fr/hal-02329642
Submitted on 17 Nov 2020
HAL is a multi-disciplinary open access
archive for the deposit and dissemination of sci-entific research documents, whether they are pub-lished or not. The documents may come from teaching and research institutions in France or abroad, or from public or private research centers.
L’archive ouverte pluridisciplinaire HAL, est destinée au dépôt et à la diffusion de documents scientifiques de niveau recherche, publiés ou non, émanant des établissements d’enseignement et de recherche français ou étrangers, des laboratoires publics ou privés.
Formation of the frontal thrust zone of accretionary
wedges
Jonathan Weiss, Garrett Ito, Benjamin Brooks, Jean-Arthur Olive, Gregory
Moore, James Foster
To cite this version:
Jonathan Weiss, Garrett Ito, Benjamin Brooks, Jean-Arthur Olive, Gregory Moore, et al.. Formation of the frontal thrust zone of accretionary wedges. Earth and Planetary Science Letters, Elsevier, 2018, 495, pp.87-100. �10.1016/j.epsl.2018.05.010�. �hal-02329642�
Formation of the frontal thrust zone of accretionary wedges
1 2
Jonathan R. Weiss1,2, Garrett Ito1, Benjamin A. Brooks3, Jean-Arthur Olive4, Gregory F. Moore2,
3
and James H. Foster5
4 5
1. COMET, School of Earth and Environment, University of Leeds, Leeds, United Kingdom 6
2. Department of Geology and Geophysics, University of Hawai‘i, Honolulu, HI, USA. 7
3. U.S. Geological Survey Earthquake Science Center, Menlo Park, California, USA. 8
4. Laboratoire de Géologie, Ecole Normale Supérieure / CNRS UMR 8538, PSL Research 9
University, Paris, France. 10
5. Hawai‘i Institute of Geophysics and Planetology, University of Hawai‘i Honolulu, HI, USA. 11
12
* Corresponding author. 13
E-mail address: [email protected] 14
15
Abstract
16
The combination of recent megathrust earthquakes that have ruptured the frontal portions of 17
accretionary prisms and historical evidence for large wedge-front, fold-and-thrust belt events has 18
sparked interest in the development of wedge-front fault systems. Here we explore the formation 19
of these faults using two-dimensional finite-difference models of spontaneous thrust fault 20
formation and wedge accretion. A reference model with uniform material strength parameters 21
predicts wedge-front thrusts to nucleate near the surface of the sedimentary layer and propagate 22
down towards the basal décollement. The formation of a new frontal thrust is preceded by incipient 23
faulting over a zone several kilometers wide forward of the wedge toe, resembling the protothrust 24
zone (PTZ) imaged in seismic reflection data from the front of submarine accretionary prisms. 25
Similar behavior, with a new frontal thrust forming from top to bottom, occurs if the fraction (l) 26
of pore-fluid pressure relative to the total (dynamic) pressure is uniform and < 0.8 throughout the 27
sediment section, or if l increases with depth and is < 0.7 at the base of the décollement. For
28
greater values of l, models predict more frontal thrusts to form from the bottom to top. These
29
results are reasonably well explained by a simple elastic stress analysis. Models that simulate 30
cohesive brittle strength that is negligible in the shallow sediments and increases with depth also 31
predict new thrust faults to form from top to bottom. Models in which viscous flow at shallow 32
depths represents creep of sediments predict bottom-up thrust nucleation when viscous stresses 33
due to plate convergence remain lower than the brittle yield stress in the top ~15–50% of the 34
sediment section. Top-down nucleation is otherwise favored when viscous stresses exceed the 35
brittle yield strength throughout most of the sediments. Our study illuminates key controls on the 36
mechanical and temporal links between the PTZ, the forward propagation of slip along the 37
underlying décollement, and the formation of a new frontal thrust. 38
39
Keywords
accretionary prism; fold-and-thrust belt; protothrust zone; thrust fault formation, numerical 41
modeling; wedge-front deformation 42
43
1. Introduction
44
In the aftermath of recent large earthquakes associated with low-angle megathrust faults that 45
underlie accretionary wedges, our understanding of how and where wedges rupture has begun to 46
change. Previously, the frictional properties of the shallow up-dip portions of megathrusts were 47
thought to be more likely to facilitate aseismic rather than coseismic slip (Scholz, 1998). The 2010 48
Mw 7.8 Mentawai, 2011 Mw 9.0 Tohoku-Oki, and the 1999 Mw 7.6 Chi-Chi earthquakes (Fujiwara
49
et al., 2011; Hill et al., 2012; Yue et al., 2005), however, are just a few examples of recent events 50
characterized by coseismic slip that advanced to the wedge toe and, in the case of the Japan and 51
Sumatra earthquakes, resulted in devastating tsunamis. These events demonstrate the need to better 52
understand the mechanics of the wedge toe including the formation of the décollement and steeply 53
dipping thrust faults that facilitate surface uplift (e.g. Hubbard et al., 2015). 54
55
Our knowledge of wedge-front structures comes primarily from seismic reflection and well-log 56
data, and in the case of fold-and-thrust belts, outcropping faults, folds, and geomorphic indicators. 57
Such observations are often interpreted with geometric and kinematic models (e.g. fault 58
propagation folding, trishear) that assume thrusts initiate near the tip of the basal décollement, 59
propagate upward towards the surface, and are linked to a décollement at depth (e.g. Allmendinger 60
and Shaw, 2000; Hughes and Shaw, 2015; Suppe and Medwedeff, 1990). In contrast, an 61
observation that has received relatively limited attention is the faulting associated with incipient 62
deformation forward of the main frontal thrusts. High-resolution seismic reflection data outboard 63
of accretionary prisms including Cascadia, Nankai, and New Zealand, for example, image a 64
“protothrust zone” (PTZ), characterized by numerous cross-cutting faults midway through the 65
sediment section that often offset the seafloor but do not clearly intersect the décollement (e.g. 66
Barnes et al., 2018; Karig, 1986; MacKay, 1995) (Fig. 1). 67
68
This paper investigates the mechanics and formation of the wedge-front thrust fault system using 69
a combination of a simple stress analysis and finite-difference models of spontaneous fault 70
nucleation and growth. Our results show that in the simplest case of a sediment layer with 71
homogeneous material strength parameters, new wedge front faults initiate at shallow depths and 72
then propagate down to the décollement. We then vary material properties to further map out the 73
range of conditions needed to produce top-down versus bottom-up fault propagation. One group 74
of models explores different uniform fractions (l) of pore-fluid pressure relative to the total 75
pressure, another group includes a more realistic increase in l with depth, another considers an 76
increasing cohesive brittle strength with depth. Finally, we explore models in which viscous creep 77
is possible at shallow depths in the crust, and the strain rate-dependent strength increases with 78
depth. We conclude with a discussion of the implications for natural systems. 79
2. Numerical Approach
81
We model the formation and evolution of orogenic wedges using SiStER (Simple Stokes solver 82
with Exotic Rheologies, Olive et al., 2016), a two-dimensional MATLAB ®-based code that uses 83
finite differences on a fully staggered mesh with the particle-in-cell method (Gerya, 2010) to solve 84
for conservation of mass and momentum in an incompressible visco-elastic-plastic continuum. At 85
each time step, Picard iterations are used to solve the non-linear terms in the governing equations 86
based on updated estimates of the strain rate-dependent rheology, computed on the finite difference 87
grid. This process is repeated until the L2-norm of the strain rate field residual is £10-3, or a
88
maximum of 75 iterations are performed. Between time steps (50% of the Courant condition), 89
Lagrangian tracer particles passively track material properties and stresses as they are advected in 90
the Eulerian velocity field using fourth-order Runge-Kutta. Material properties are passed between 91
nodes/cells and particles using bilinear interpolation (Gerya, 2010). Cells have dimensions of 125 92
m × 125 m for all model runs unless otherwise noted in Table S1, which lists all important model 93
parameters. 94
95
The Maxwell model is used for the visco-elastic deformation, but the stress is limited by the 96
plastic strength, which leads to the formation of localized shear bands that represent faults. Plastic 97
strength is defined by the Drucker-Prager form of the Mohr-Coulomb failure criterion in which 98
brittle strength (as the second invariant of the 2-D deviatoric stress tensor) increases with total 99
pressure P, friction angle f, and cohesion C,
100
𝜎"" = 𝑃𝑠𝑖𝑛𝜙 + 𝐶𝑐𝑜𝑠𝜙. (1)
101
Brittle failure is computed on the mesh nodes rather than particles. Brittle strength reduction occurs 102
as accumulated plastic strain ep increases from 0 to 0.05 (e.g. Lohrmann et al., 2003) by decreasing
103
C linearly from C0 = 20 MPa at ep = 0.0 to Cmin = 0.01 MPa at ecrit = 0.05. In addition, fault healing
104
is simulated by reducing ep over a time scale (t ≈ 63 kyr) that is small compared to the duration
105
individual faults are active. Shear bands typically localize to widths of 2-4 grid cells. Thus, with 106
125 m grids, the critical plastic strain required for full fault weakening roughly corresponds to 10-107
20 m of slip. 108
109
A traction free upper surface on the sediments is simulated by covering the crustal layer with a 110
“sticky air” layer of low viscosity (ha=1017 Pa s) and near-zero density. Topography of the
111
sediment-air interface is tracked through time using a chain of markers that are advected passively 112
by the velocity field. A crude representation of erosion and mass wasting using linear topographic 113
diffusion (e.g. Simpson, 2011) with a low diffusivity coefficient of k = 5×10⁻⁹ m2 s-1 preserves
114
much of the faulted topography while adequately smoothing unrealistically sharp or overhanging 115
features. 116
117
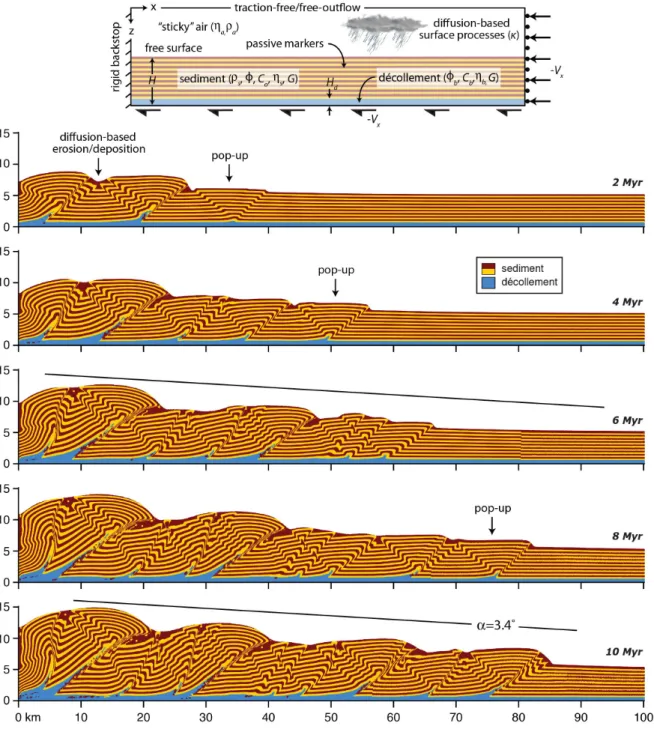
A contracting wedge configuration (Figs. 2a, S1) is created with the right side of the model box 118
being free-slip and having an imposed leftward velocity of Vx = −10 mm yr1. The impenetrable
bottom boundary is also imposed to move leftward at Vx = −10 mm yr-1. The left side “backstop”
120
is rigid and impenetrable, and the top (of the sticky air) is free-slip and open. 121
122
3. Reference model with uniform material properties and no pore-fluid pressure: top-down
123
thrust formation
124 125
3.1 Numerical model predictions 126
In the reference model (Figs. 2, 3), the Eulerian mesh is 80 km long and 17 km high. The 127
deformable sediment layer has a friction angle of f = 30°, a starting cohesion of C0 = 20 MPa, a
128
density of rs = 2700 kg m-3, a viscosity of hs = 1025 Pa s, and a shear modulus of G = 2 x 10⁹ Pa.
129
This layer has an initially uniform thickness of H = 4.5 km, and overlies a basal décollement having 130
an initial thickness of Hd = 0.5 km. The décollement has the same material properties as the
131
overlying crust except C0 = 0.01 MPa and the friction angle is lower (fb = 15°).
132 133
The evolution of the numerical wedge begins with the development of two prominent shear 134
bands (i.e., thrust faults) near the left-hand-side of the model domain that form a v-shaped 135
conjugate pair, intersecting at the basal décollement (Fig. S1). Shortly thereafter, the forward-136
verging (dipping to the left) thrust dominates, behind which topography develops and the wedge 137
forms. Growing topography increases horizontal compression in the incoming crustal layer and 138
eventually new fault formation occurs ahead of the frontal thrust leading to wedge widening. The 139
cycle of wedge thickening, with slip on the frontal and internal thrusts, and wedge widening, with 140
sequential formation of new frontal thrusts repeats. In this manner, the wedge grows and preserves 141
an average slope consistent with critical taper theory (Davis et al., 1983), as shown in prior 142
numerical (e.g. Simpson, 2011; Stockmal et al., 2007) and laboratory modeling studies (e.g. 143
Gutscher et al., 1998; Koyi, 1995) (Figs. 2a, S1). 144
145
Insight to where and how new frontal thrusts form is revealed by the pattern of plastic strain as 146
well as the differential stress (i.e., difference between the least s1 and most compressive s3 stress,
147
where compressive stress is negative) normalized by the local brittle strength, 148
𝐹 = (01203)
[2(01603)789:6;<=>7:] (2)
149
where the term in the denominator is the Drucker-Prager failure criterion. Note also that cohesion 150
C in Eq. (2) can locally decrease where plastic strain accumulates and can be ≤ C0. The actively
151
straining shear bands beneath the wedge are by definition at failure (F = 1). Prior to the formation 152
of a new frontal thrust, a ~10-km-wide region in which F > ~0.95 forms near the sediment surface 153
outboard of the active wedge front (Fig. 2b). As time proceeds, this high-F region enlarges and a 154
series of incipient thrusts form at conjugate angles within this shallow region (Fig. 2c). While this 155
is occurring, slip on the décollement has propagated forward well beyond the main frontal thrust 156
(t = 2.167 Myr; Fig. 2c), indicating that the material above it is moving toward the backstop slower 157
than the convergence rate (see also Morgan, 2015). Hence this material is shortening horizontally, 158
contraction, a new frontal thrust emerges from the PTZ at or near the surface and progressively 160
lengthens down-dip toward the décollement (Fig. 2d). When the new thrust fault meets the 161
décollement, slip on the décollement ceases beyond the intersection location (t = 2.214 Myr; Fig. 162
2e). Varying the basal friction does not change the basic behavior of the new frontal thrust 163
propagating from top to bottom. 164
165
3.2 Ideal elastic stress models 166
To understand the cause of the top-down propagation we analyze the state of stress in the 167
incoming sediment layer. Far forward of the deformation front, including near the right side of the 168
model domain, the state of stress is nearly lithostatic (Figs. 3a, 3b, S2). However, within a distance 169
L (~25 km) ahead of the frontal thrust, the stresses are perturbed by the wedge. Inclined contours 170
of horizontal normal stress sxx indicate that sxx becomes increasingly compressive both downward
171
and towards the wedge; roughly horizontal contours of sxz indicate a downward increase (in
172
absolute value) from zero at the surface to the frictional strength of the décollement at depth. 173
174
The prominent characteristics of this stress pattern can be understood with a simple model of 175
force balance on a purely elastic body of rectangular cross-section having height H and width L. 176
The top of the rectangle is stress free; the right boundary has a horizontal normal traction equal to 177
the lithostatic pressure; the bottom has a uniform, right lateral shear traction tb = rgHtanfb (g is
178
gravitational acceleration); the left side has a rightward horizontal normal traction in excess of 179
lithostatic that, when integrated along the side, balances the net leftward force due to the basal 180
shear (Figs. 3d, S2a). The solution is found using the Airy stress function (also used by Goff and 181
Wiltschko, 1992, see Supplement for derivation), 182
𝜎@@ = −BDC𝑥 − 𝜌𝑔𝑧, 𝜎JJ = −𝜌𝑔𝑧, 𝜎@J = BDC𝑧. (3)
183
Here, z is depth (>0 downward), and the horizontal coordinate x = 0 is on the right boundary at a 184
distance L forward of the wedge toe and increases to the left (i.e., x = L at the wedge toe). 185
186
The distance L forward of the wedge over which stresses are significantly perturbed from the 187
background lithostatic state can be estimated by approximating sxx beneath the surface intersection
188
of the frontal thrust as being at critical failure (Dahlen, 1990). Given that the active frontal thrust 189
is fully weakened, the differential stress profile is approximated by the Mohr-Coulomb failure 190
limit without cohesion 191 01203 ; = − K 01603 ; L 𝑠𝑖𝑛𝜙. (4) 192
If the least compressive stress is approximately vertical, s1 » szz, and if the most compressive
193
stress is approximately horizontal, s3 » sxx, then
194
𝜎@@ ≈ − KN6789:
N2789:L 𝜌𝑔𝑧. (5)
195
Integrating Eq. (5) over depth gives the net force of the wedge pushing the block to the right. 196
Balancing this with the leftward shear traction along the base, integrated across the distance L 197
yields 198
𝐿 = KN6789:N2789:L KPQD;B R C L = K N6789: N2789:L K D ;ST9(:C)L. (6) 199
To verify this prediction, we estimate L in the SiStER models as the distance beyond the frontal 200
thrust over which the model shear stress at a given depth is approximately constant. The SiStER 201
values of L for different décollement friction angles fb are well-explained by Eq. (6) (Figs. 4,
202
S3). 203
204
Thus, the elastic stress solutions in Eq. (2) are applied over the domain of x = 0 to L (again x = 205
L is at the hypothetical wedge frontal thrust) (Figs. 3c, d). The solutions qualitatively match the 206
general stress pattern predicted by SiStER, specifically the nearly horizontal invariance of |sxz| and
207
its increase with depth toward the décollement where the shear stress is imposed on the layer, as 208
well as the approximately linear increase in |sxx| with depth and toward the deformation front. To
209
illuminate the cause of the top-down, frontal thrust propagation, the stresses given by Eq. (3) are 210
used to compute the differential stress (s1-s3) as a function of x and z for comparison with the
211
corresponding brittle failure envelopes. Depth profiles at various locations of x show that (s1-s3)
212
exceeds the brittle strength near the surface first, and the thickness of the failure zone increases 213
right-to-left toward the hypothetical wedge front (Fig. 3f). This behavior resembles that of the 214
SiStER models (Fig. 3e). 215
216
The simple elastic and reference numerical models predict top-down faulting for two main 217
reasons: (1) the depth-dependent failure law leads to decreasing brittle strength with proximity to 218
the surface and (2) the differential stress decreases more gradually toward the surface. The 219
theoretical tendency for top-down fault propagation was one of numerous aspects discussed in 220
prior analytical studies (e.g. Eisenstadt and Depaor, 1987; Goff and Wiltschko, 1992), and is often 221
apparent in numerical and analogue modeling studies (e.g. Bernard et al., 2007; Del Castello and 222
Cooke, 2007; Dotare et al., 2016; Morgan, 2015). This result contrasts with the notion that new 223
frontal thrusts often nucleate from the décollement tip and propagate upwards (e.g. Allmendinger 224
and Shaw, 2000; Chester and Chester, 1990; Tavani et al., 2015) and thus motivates further 225
exploration. 226
227
4. Effects of pore-fluid pressure
228
4.1 Constant pore-fluid pressure 229
What qualities are needed to produce top-down, versus bottom-up fault propagation? We first 230
explore the importance of brittle-strength reduction due to pore-fluid pressure (Dahlen, 1984; Ruh, 231
2017). We do this in the numerical models by assuming pore pressure is a constant fraction l of
232
the total pressure (i.e. l = pf/P) in the Drucker-Prager brittle failure law
233
𝜎"" = 𝑃(1 − 𝜆)𝑠𝑖𝑛𝜙 + 𝐶𝑐𝑜𝑠𝜙. (7)
234
For all models we apply the same l value to both the sediment layer and décollement, but C=Cmin
235
(0.01 MPa) in the décollement. We note that while we simulate the effects of pore fluid on the 236
frictional strength the material, we do not incorporate the density contrast between the fluid and 237
solid when solving the momentum equation. 238
239
4.2 Numerical model predictions 240
Numerical simulations predict that the behavior of new frontal thrusts can change due to l. With
241
l < ~0.8 the new frontal thrusts grow much like those from the reference case (l = 0): from top to
242
bottom. Recall that for l = 0, the failure ratio F forward of the frontal thrust is highest in a zone
243
near the surface, and it is in this zone that the new frontal thrust initiates before propagating 244
downward (Fig. 2). With increasing l the depth extent of the zone of high F increases. For
245
example, with l= 0.5, a zone of high F forms approximately midway through the sediment layer
246
but as the zone broadens, failure still initiates in the upper half of the layer and the frontal thrusts 247
propagate top-to-bottom (Fig. S6, Anim. S4-S8). When l = ~0.8, however, a different behavior
248
emerges. Stresses forward of the frontal thrust first become largest in a localized zone near the 249
décollement. With continued convergence, the zone of high F expands up and forwards (Fig. 5). 250
The associated PTZ is characterized by incipient shear bands forming near both the surface and 251
the base of the sediment section. One of these shear bands becomes the new, dominant frontal 252
thrust fault, sometimes forming nearly simultaneously across the whole layer but often propagating 253
from the décollement upwards (Fig. 5, Anim. S8). 254
255
4.3 Elastic stress models 256
We now consider the effects of pore-fluid pressure on our simple model of elastic stresses. The 257
solutions are still given by Eq. (3), but, pore-fluid pressure also reduces the basal shear stress 258
according to 259
𝜏X = 𝜌𝑔ℎ(1 − 𝜆)𝑡𝑎𝑛𝜙X. (8)
260
The second adjustment is to L, the domain of x over which this basal traction acts and the elastic 261
solutions are computed. To compute L, the approximate failure stress near the active thrust (Eq. 4) 262 becomes 263 \(0]120]3) ; \ ≈ − K (01603) ; + 𝑝_L 𝑠𝑖𝑛𝜙 (9) 264
where 𝜎`N = 𝜎N + 𝑝_ and 𝜎`a= 𝜎a+ 𝑝_ are the least and most compressive effective principal 265
stresses based on Terzaghi’s principle (Skempton, 1960). With Eq. (8), Eq. (5) becomes 266
𝜎@@ ≈ − KN6789:(N2;b)N2789: L 𝜌𝑔𝑧, (10)
267
and Eq. (6) becomes 268 𝐿 = KN6789:(N2;b)N2789: L KPQD;B R C L = K N6789:(N2;b) N2789: L K D ;ST9(:C)(N2b)L. (11) 269
Thus, although increasing pore pressure reduces the horizontal compressive force near the frontal 270
thrust (Eq. 9), the effects are largest at the base, which controls tb and so L increases with
271
increasing l (Fig. 4). 272
The elastic stress solutions Eq. (3) are again used to predict the differential stresses and failure 274
envelopes, but this time with tb and L given by Eqs. (8) and (11). The resulting depth profiles
275
qualitatively reproduce the behavior of the SiStER models that increasing l diminishes the
276
difference between the failure and differential stress curves (Fig. 6). For low l, when the failure
277
strength still increases with depth much more quickly than the differential stress, both models 278
predict failure to initiate near the surface. For higher l’s, the two curves approach each other, and
279
in the SiStER model they become approximately parallel at l = 0.8. At this value of l, the SiStER
280
model initiates brittle failure over a greater thickness of the sediment layer, including near the 281
décollement (Figs. 5, 6). Compared to the SiStER model, the elastic model under-predicts the 282
downward increase in differential stress and predicts the curves to be parallel only when l = 1
283
(instead of 0.8). We conclude that top-down thrust propagation should dominate for low-to-284
moderately high pore-fluid pressure ratios (l < 0.8), whereas faults can initiate over the full range
285
of depths, including near the décollement only at very high ratios (l ≥ 0.8)
286 287
4.4 Depth-dependent pore-fluid pressure 288
Recent work suggests that more typically, pore-fluid pressure ratios increase with overburden 289
pressure (i.e. depth) (e.g. Moore and Saffer, 2001; Zhang, 2013). Often the gradient in pore-290
pressure is nearly hydrostatic near the surface and increases towards the lithostatic gradient at 291
depth, leading to an effective brittle strength that increases non-linearly and tends to flatten out 292
with depth in the crust (Suppe, 2014). Recently, Ruh (2017) used numerical models of wedges to 293
characterize how changes in l influence the overall wedge geometry. They found that steady
294
increases in l can cause a décollement to form spontaneously (i.e., the décollement needs not be
295
imposed as in our models) and the suggestion is that new frontal thrust faults may also initiate at 296
depth although this topic is not explicitly described. 297
298
We take an approach similar to Ruh (2017) and simulate depth-varying l. Here, the
pore-299
pressure gradient is hydrostatic (l = rw/rs =0.37; see Table S1) at shallow depths, and then shifts
300
to a lithostatic gradient, continuing to the base of the sediment section (Fig. 7) (Suppe, 2014). We 301
ran 6 models in which the pore-fluid pressure ratio reaches different values (l3.5) at a depth of 3.5
302
km, which corresponds to the initial base of the décollement. The friction angle of the décollement 303
was decreased with increasing l3.5 to preserve the ratio of the effective friction of the décollement
304
relative to the mean effective friction in of the initial sediment layer (Table S1). The maximum 305
cohesion was set to C0 = 5 MPa, which is much lower than in previous models. This is in response
306
to models with depth-varying l in which individual thrust faults developed unrealistically large
307
offsets for greater values of C0 for the higher values of l3.5.
308 309
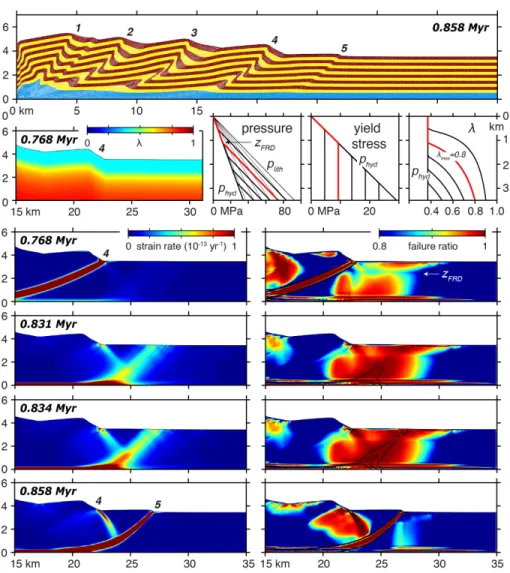
Figure 7 shows the results of a model with l3.5 = 0.8. In this case, pore-fluid pressure deviates
310
from hydrostatic values at a “fluid retention depth” (e.g. Suppe, 2014) of zFRD ~1.1 km beneath the
311
surface. The PTZ is characterized by the gradual formation of two zones of high failure ratio F; 312
one zone expands upward from the décollement and the other expands downward from the surface. 313
The two zones coalesce near z= zFRD (t = 0.768; Fig. 7, Anim. S10). This behavior contrasts with
314
the previously discussed model of constant l = 0.8 in which the zone of failure initially nucleates
315
only above the décollement. In the l3.5 = 0.8 model, incipient frontal thrust faults consistently form
316
at the base of the sediment section (t = 0.831 Myr) before rapidly propagating up-dip (t = 0.834 317
Myr) and intersecting the surface (t = 0.858 Myr). Models with l3.5 ≤ 0.7 also exhibit the same
318
high-F zone coalescence but the new frontal thrusts form near the surface and propagate down-dip 319
towards the décollement (Anims. S8-9). We also note that higher values of l3.5 produce increasing
320
dominance of forward-verging thrusts, a behavior that was first documented by Ruh (2017). 321
322
5. Additional depth-dependent material properties
323
5.1 Depth-dependent cohesion 324
Closely associated with depth-dependent pore-fluid pressure is a decrease in pore-fluid volume 325
with depth (e.g., Yue and Suppe, 2014). One likely effect of depth-varying porosity is on the bulk 326
cohesive strength associated with brittle deformation. We explore this effect by including a depth-327
dependence on the initial cohesion (prior to any strain-weakening) according to 328 𝐶c = 𝐶dT@e1 − exp f− KPQ(J2JPQJ g) h L i jk. (12) 329
Here zs is the depth of the sediment surface and z0 is the characteristic depth over which cohesion
330
remains low (Fig. 8). The form of Eq. (12) is motivated by the aim to have a smoothly varying 331
function that has cohesion being near zero at the surface, remaining low over the characteristic 332
depth, and increasing below this depth, approaching Cmax = 20 MPa at the base of the sediment
333
layer. We ran four models with depth scales of z0 = 0.5, 1, 1.5, and 2 km (Figs. 8, S9).
334 335
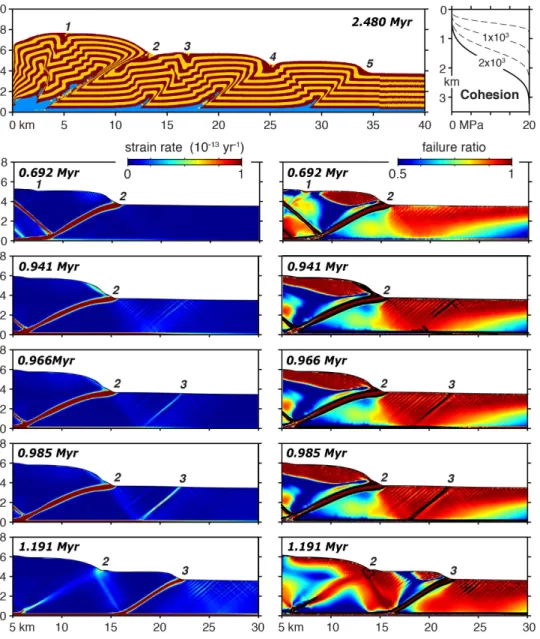
Figure 8 shows the resulting numerical predictions for z0 = 2 km: cohesion is ≤ 2 MPa (10% of
336
Cmax) in the upper ~1/3 of the sediment layer and is ³ 18 MPa (90% of Cmax) in the bottom third of
337
the layer. The model predicts that the shallow, low-cohesion layer remains near failure over large 338
distances behind, as well as in front of the frontal thrust (Fig. 8, 0.692 Myr). In front of the wedge, 339
F is always high near the surface, which contrasts the reference case where zones of high F form 340
for a more limited time just prior to the nucleation of a new frontal thrust. With continued 341
contraction, the high-F zone grows down toward the décollement, and numerous, primarily 342
forward-verging thrusts nucleate within this near-surface zone (Fig. 8; 0.941 Myr). This behavior 343
contrasts with the reference model where only a few cross-cutting shear bands form near the 344
surface. Soon thereafter a single, dominant fore- or back-thrust propagates downward to the 345
décollement (Fig. 8; 0.966-0.985 Myr). Thus, although the shallow layer with low cohesion 346
deforms diffusely most of the time, new frontal thrusts always nucleate from within this layer and 347
propagate downward to the décollement. The models with thinner low-cohesion layers behave the 348
same way, except that the zone of diffuse deformation and closely spaced shear bands becomes 349
thinner with decreasing z0 (Fig. S9).
350 351
5.2 Depth-dependent viscosity: shallow viscous creep in the upper crust 352
To this point our models have focused on simulating elastic and brittle deformation. However, 353
time-dependent creep or ductile deformation is known to be an important mechanism in the upper 354
crust for accommodating compaction, folding, and shearing, often related to faulting and 355
fracturing. Rate-dependent processes include pressure-solution creep (e.g. Croizet et al., 2013; 356
Gratier et al., 2013) and brittle creep (e.g. Atkinson, 1984; Chester et al., 2007). Here we explore 357
the effects of strain-rate-dependent deformation by approximating the non-brittle deformation as 358
a viscous rather than a primarily elasto-plastic process. Pressure solution creep results in viscous 359
behavior that depends on effective stress, temperature, and porosity among other factors. Here we 360
assume a simple linear stress dependence, neglect temperature effects, and assume porosity (i.e. 361
effective viscosity) varies only with depth. Our objective is to define the regimes of frontal thrust 362
evolution for different depth variations in strain-rate dependent stress. 363
364
As our models do not simulate volumetric strain, we approximate a strain-rate dependent stress 365
with an effective shear viscosity that varies as the following function of depth z below the surface 366 depth zs, 367 𝜂 = 𝜂>exp p−𝑓NKrQ(J2JrQD g)6_RrQDL s t (13) 368
where h0is the reference viscosity, and f1, f2, and g are constant input parameters (Fig. 9, Table
369
S2). The term in parentheses in the exponential is the “porosity function”, which represents the 370
relative change in porosity with depth (Fig. S10), displaying a rapid decrease near the surface and 371
a more gradual decrease at greater depths as is commonly observed within accretionary prisms 372
(e.g. Moore et al., 2001; Moore and Saffer, 2001). The exponential function arises in creep laws 373
for shear deformation in partially molten mantle rocks during diffusion creep (Kohlstedt and 374
Hansen, 2015) and in pressure solution creep laws describing compaction of sediments (Niemeijer 375
et al., 2002; Noort and Spiers, 2009). In both situations, the exponential dependence on porosity 376
accounts for the decreased intergranular contact area (and proportional increased stress on grain 377
contacts) with increasing porosity. By varying f1, f2, and g we change the variation in viscosity
378
with depth. However, the more fundamental and generally applicable parameter that we vary is 379
the ratio Fa of the approximate, ambient differential stress imposed by the converging underlying
380
plate, relative to the yield stress, 381
𝐹T =;[789:PQ(J2J;uv w⁄
g)6<h=>7:] . (14)
382
The numerator is the approximate ambient (strain-rate dependent) differential stress with U = 10 383
km/Myr and L = 25 km as defined by Eq. (6). 384
385
We ran calculations for 14 different depth variations in Fa (Fig. 9, Table S2). Results show that
386
models in which Fa ≤ 1 in the upper 85-100% of the sediment layer never produce brittle failure,
387
and the wedge deforms entirely viscously. Cases in which Fa > 1 at depths greater than 0 to ~10%
388
of the starting sediment layer thickness predict brittle failure with frontal thrusts propagating from 389
top to bottom much like in the reference model. Within the intermediate range of Fa tested, the
390
frontal thrust initiates just above the décollement and propagates from the bottom up. 391
392
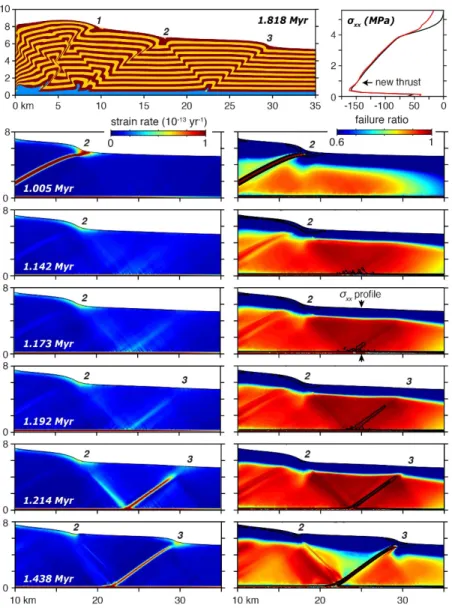
The case shown in Figure 10 (and Anim. S13) is one such case of bottom-up propagation. Here 393
the failure ratio F in the numerical model forward of a mature frontal thrust is seen to be largest at 394
depth where the effective viscosities are highest. Immediately in front of the wedge, the zone of 395
high F thickens to shallower depths, but F remains highest just above the décollement (t = 1.005-396
1.173 Myr). Eventually, cross-cutting shear bands form at the base (t = 1.173 Myr), and a dominant 397
forward-verging thrust fault emerges and propagates up towards the surface (t = 1.192-1.214 Myr). 398
The strain-rate dependence in the models is essential for bottom-up propagation. For these models 399
with intermediate values of Fa, the stress due to ambient contraction (2hU/L) is too low to initiate
400
faulting in the upper half of the layer. Once a prominent shear band initiates near the base, strain 401
rates and hence differential stresses become magnified near the tip of the shear band and brittle 402
failure extends upward (Fig. 9c). This feedback between magnified strain rate and fault tip 403
propagation continues upward either to the surface or to the level where the viscosities are too low 404
for further brittle failure. In the model show in Figure 10, the shallowest sediment deforms by 405 folding. 406 407 6. Discussion 408 6.1 Model shortcomings 409
The most significant shortcoming of our models is their simulation of incompressible 410
deformation, whereas matrix compaction (and the concurrent dewatering) can accommodate a 411
substantial portion of the horizontal shortening in accretionary prisms (e.g. Barnes et al., 2018; 412
Moore et al., 2001; Morgan and Karig, 1995). Our models therefore are likely to over-predict the 413
amount of shearing on incipient or main thrusts for a given amount of total shortening. This 414
shortcoming is likely to be most important at shallow depths were the initial porosities are lowest, 415
and hence the models over-predict the tendency for protothrusts to nucleate near the surface. This 416
shortcoming is also likely to be more significant for higher-porosity, submarine accretionary 417
prisms than for lower-porosity mountain belts that incorporate crystalline basement rock. Our 418
models also do not simulate fluid flow and the dynamic responses of the partitioning between 419
volumetric versus shear strain, or changes in pore pressure. Thus, the rates of fault formation and 420
propagation, as well as the time-integrated distribution of slip along individual faults are unlikely 421 to be realistic. 422 423 6.2 Top-down propagation 424
Models that predict the frontal thrust to initiate near the surface include those with moderate-to-425
low pore-fluid pressure ratios. Pore pressure has the effect of reducing the rate at which brittle 426
strength increases with depth compared to the rate differential stress increases therefore promoting 427
greater depths of incipient shear-band formation. For the Japan Trench, a critical-taper-based, 428
whole-wedge pore pressure ratio estimate of l = 0.5 (Davis et al., 1983) is compatible with Nankai 429
PTZ formation near the top of the sediment section (Figs. 1, 6). 430
431
For models in which cohesion increases with depth, a shallow, low-cohesion layer displays 432
diffuse deformation, largely accommodated by small, short-lived shear bands. The model example 433
shown in Fig. 8 bears resemblance to both the Nankai and Hikurangi seismic reflection images, 434
which reveal a PTZ composed of closely spaced thrusts that appear to intersect the surface but not 435
the décollement (Fig. 1). The zone of deformation composed of fine shear-bands on the hanging 436
wall side of the fully developed frontal thrust fault (e.g. thrust #2 in Fig. 8) is also reminiscent of 437
small-scale, PTZ-like structures observed in the Hikurangi and Nankai examples. 438
439
The minimal size and spacing of the shear bands in the above model, however, is limited by the 440
size of our model grids. In nature, brittle deformation, perhaps in localized bands, may in fact 441
occur on the grain scale and thus be truly diffuse on the scale of stratigraphy or seismic reflection 442
resolution. It is therefore appropriate to question how the model discretization impacts the results. 443
Morgan (2015) used a discrete element numerical method to study the effects of cohesion on 444
faulting in wedges and showed that individual thrust faults tend to be more stable (longer-lived) 445
and more widely spaced when cohesion (uniform across the model) is largest, and thrust faults 446
become less stable and more closely spaced with decreasing cohesion. With this insight, we can 447
expect that as cohesion increases with depth, incipient thrusts should begin to emerge at increasing 448
length scales and stability. Thus, although the SiStER models may not accurately represent the 449
size and spacing of shear bands in the low cohesion layer, the nucleation of shear-bands that are 450
sizeable compared to the scale of stratigraphy or seismic reflection resolution, the downward 451
propagation of these bands toward the décollement, and their transformation to major frontal 452
thrusts should be relatively robust predictions. That is, at least to the extent that prior compaction 453
results in a state where shortening by plastic shearing is dominant. 454
455
At orogenic wedges, the depth at which thrusts initiate and the direction in which they lengthen 456
may impact inferences about the associated kinematics and structure. Evidence for shallow 457
nucleation and downward propagation is provided, as previously discussed, by geologic outcrops 458
in the Appalachian Valley and Ridge province (McConnell et al., 1997), where the exposure spans 459
a sufficient depth range to reveal a decrease in fault displacement with depth (Fig. 1), and in the 460
Caledonides of Southern Norway (Morley, 1994). Also, Nivière et al. (2006) document 461
anomalously high rates of local uplift in the outer Western Alps, which they attribute to shallow 462
ramp activation (i.e. new frontal thrust formation) in the incoming sediment section well above the 463
active décollement. In contrast, geologic reconstructions often assume that many of the exposed 464
shallow folds and short-strike anticlines at the front of active accretionary wedges are associated 465
with faults that extend all the way from the basal décollement to near the surface (e.g. Hubbard et 466
al., 2014; Lavé and Avouac, 2000). This assumption is used to estimate fault slip and crustal 467
shortening rates. If instead, the folds are related to incipient faults that have not yet linked to the 468
basal décollement, then inferred total slip and shortening would be less. We suggest that anticlinal 469
folds with small along-strike dimensions are more consistent with shallow faults if the vertical 470
extent of the fault is comparable to the horizontal extent. 471
472
6.3 Bottom-up propagation 473
Models that consistently predict the frontal thrust to propagate from bottom to top include cases 474
in which the pore-fluid pressure ratio increases with depth to values ³ ~0.7 at the base of the 475
sediment section. The implication for natural systems is that bottom-up propagation should occur 476
in sediments with a low effective basal coefficient of friction and thus lower surface taper angle. 477
478
The other type of model that leads to more definitive nucleation of faults near the décollement 479
and upward propagation are the viscous deformation models in which the converging plate creates 480
ratios of ambient differential stress to plastic yield stress (Fa) that exceed 1 starting at depths of
481
~15-50% of the sediment thickness. Again, our models simulate viscous creep accommodating 482
shear strain not volumetric strain. In natural porous sediments, substantial shear deformation by 483
pressure-solution creep becomes apparent at temperatures of ~150°C or more (e.g. Fagereng and 484
den Hartog, 2017; Gratier et al., 2013). These temperatures, however, are only reached near the 485
décollement of submarine wedges (e.g. Fagereng and den Hartog, 2017; Moore and Saffer, 2001) 486
suggesting that the model profiles of Fa are not likely to be achieved by viscous shear deformation
487
in these systems. Higher temperatures are more likely at shallower levels in subaerial fold-and-488
thrust belts, particularly in backarc settings where geothermal gradients are elevated (e.g. Currie 489
and Hyndman, 2006) and in continent-continent collision zones with high radioactive heat 490
production in the upper crust and rapid exhumation rates (e.g. Cattin and Avouac, 2000). However, 491
if pressure-solution creep that accommodates compaction leads to similar ambient stress ratio Fa
492
profiles in subaerial or submarine systems, then our model predictions of brittle failure initiation 493
may be more generally applicable to both submarine and subaerial systems. 494
495
The second feature of our viscous flow models is the upward fault propagation due to the 496
concentration of stress near the upper tip of the lengthening faults. If this is not accommodated by 497
volumetric strain in natural systems, then we speculate that distributed brittle creep can lead to the 498
required rate dependence on this process (e.g. Brantut et al., 2013). Indeed, the interaction of brittle 499
and ductile deformation is known to be important in fault zones (e.g. Gratier et al., 2013), and may 500
be integral to the time-dependent behavior of deep megathrusts of active subduction zones (e.g. 501
Fagereng and den Hartog, 2017). 502
503
The model shown in Fig. 10 also predicts the shallowest sediment to always remain too weak for 504
brittle failure to occur. This behavior is reminiscent of the “ductile” deformation that creates large 505
amplitude folds above buried thrust faults and evidence for wedge-front earthquakes that do not 506
rupture the surface but rather are attributed to blind thrusting below more distributed deformation 507
above the fault tip (e.g. Ainscoe et al., 2017; Stein and Yeats, 1989). 508
509
6.4 The relationship between the protothrust zone and the frontal thrust 510
A recent study using multi-channel seismic reflection data examined the detailed structure of the 511
PTZ and frontal thrusts across the Hikurangi accretionary prism, offshore New Zealand (Barnes et 512
al., 2018). The key results relevant to this study are that the protothrusts often clearly intersect the 513
seafloor, do not extend to the décollement, and show the largest offsets in the middle to upper half 514
of the sediment layer that decrease both up- and down-dip. Across the frontal thrust, however, 515
displacements reach a maximum at the base of the sediment section and decrease up-section, which 516
can be interpreted as indicating the frontal thrust initiated near the décollement and propagated up. 517
If this is true, then these observations are not clearly reproduced our models: the cases that exhibit 518
bottom-up propagation predict strain in the PTZ to extend across the whole sediment layer (Figs. 519
5, 7) or be highest near the décollement (Fig. 10), not at shallow levels as imaged for the PTZ at 520
Hikurangi. In contrast, the models that exhibit a prominent shallow PTZ always predict frontal 521
thrusts to propagate top-down. The depth-varying l cases, with l3.5 ³ 0.7, are perhaps more
522
consistent with Hikurangi observations as regions approaching brittle failure form both at depth 523
and near the surface before a listric thrust propagates up from the décollement (Fig. 9). The closely 524
spaced, shallow shear bands that typify Hikurangi (and some of our top-down models), however, 525
do not form across the shallow, high-strain regions in these models at the current grid resolution. 526
527
We then question whether the frontal thrust necessarily grows out of an incipient protothrust. 528
The suggestion that the protothrusts are compactive shear bands below the critical stress for Mohr-529
Coulomb failure (Barnes et al., 2018) while the frontal thrust forms by critical Mohr-Coulomb 530
failure provides a reason for a decoupling between the two. Our viscous deformation models of 531
bottom-up propagation could represent such a behavior if strain-rate dependent compaction 532
produces subcritical stresses in the shallow half the sediment layer but critical stresses below. On 533
the other hand, the dynamical interaction between shear deformation, volumetric strain, and fluid 534
flow on or around the newly forming frontal thrust probably leads to the large variation in slip 535
distribution along the Hikurangi frontal thrust, and this slip distribution may not necessarily, 536
directly reflect upon the depth of origin or sense of propagation of the fault. It may then be possible 537
for the frontal thrust to grow from top to bottom out of the protothrust but then preferentially 538
accumulate greater slip at depth as the frontal thrust matures. 539
540
7. Conclusions
541
We have used finite-difference numerical models of spontaneous thrust fault formation as well 542
as a simple elastic stress analysis to investigate the formation of the frontal thrust zone of 543
accretionary wedges. As is commonly predicted in other numerical and analogue modeling studies, 544
our reference models with uniform material strength parameters predict new frontal thrust faults 545
to initiate near the surface and propagate downward. Similar behavior occurs with low pore-fluid 546
pressures and with cohesion that is negligible in the shallow sediment layer and increases with 547
depth. These models help to explain evidence from geologic outcrops for decreasing fault throw 548
with depth as well as high-resolution seismic reflection images of protothrust zones characterized 549
by numerous cross-cutting faults in the shallow and/or middle portion of the sediment section that 550
do not clearly intersect the décollement (Fig. 1). 551
552
In contrast, if pore-fluid pressure is a large fraction of the lithostatic pressure (≥ 0.8 if l is 553
constant and ≥ 0.7 if l increases with depth), models predict faults to initiate over a full range of
554
depths including directly above the décollement. Faults consistently nucleate near the décollement 555
and propagate towards the surface if differential stress depends on strain-rate and increases with 556
depth such that brittle failure occurs only in the deeper half of the incoming sediment layer. 557
Upward propagation of the new frontal thrust occurs due to enhanced strain-rate and thus stress 558
near the upper tip of the incipient thrust. 559
560
All of our models indicate a close mechanical and temporal link between the formation of a 561
broad zone of incipient thrusting, the forward propagation of slip along the décollement and the 562
formation of a new frontal thrust. We always predict the new frontal thrust to grow out of an 563
incipient protothrust, but whether this is the case in nature depends on the relative importance of 564
compactive deformation and the dynamical effects on fluid flow, pore-pressure variations, and 565
plastic strength. We suggest that determining the depths at which new frontal thrusts nucleate in 566
accretionary wedges can help provide constraints on the pore-pressures and hydrologic processes 567
of the system, advance our understanding of ductile and brittle deformation mechanisms, and lead 568
to a more accurate interpretation of surface features that signal the widening of an accretionary 569 wedge. 570 571 ACKNOWLEDGEMENTS 572
We thank Samuel Howell, Eric Mittelstaedt, and Ben Z. Klein for their work in developing the 573
numerous features of SiStER. We also thank Eileen L. Evans, Jessica C. Hawthorne, and Jonas B. 574
Ruh for their comments that helped improve the manuscript. This research benefited tremendously 575
from discussions with Julia K. Morgan about different modeling approaches as well as her reviews 576
of multiple drafts of this manuscript. Ito’s effort in our numerical code development benefited 577
from discussions during the Melt in the Mantle program which was hosted by the Isaac Newton 578
Institute (INI) for Mathematical Sciences and supported by EPSRC Grant Number EP/K032208/1. 579
Ito also thanks the Simons Fellowship for helping support of his stay at the INI. This study was 580
supported by grants NSF-EAR-1443317 (J.R. Weiss), NSF-EAR-1118481 (J.R. Weiss and J.H. 581
Foster) and NSF-OCE-1155098 (G. Ito). J.R. Weiss also benefited from the UK Natural 582
Environmental Research Council (NERC) support through the Earthquakes without Frontiers 583
(EwF) project (EwF_NE/J02001X/1_1) and the Centre for Observation and Modeling of 584
Earthquakes, Volcanoes and Tectonics (COMET, GA/13/M/031, http://comet.nerc.ac.uk). This is
585 SOEST contribution XXXX. 586 587 REFERENCES CITED 588
589 Ainscoe, E.A., Elliott, J.R., Copley, A., Craig, T.J., Li, T., Parsons, B.E., Walker, R.T., 2017. Blind 590 Thrusting, Surface Folding, and the Development of Geological Structure in the Mw 6.3 2015 591 Pishan (China) Earthquake. Journal of Geophysical Research: Solid Earth 122, 9359-9382. 592
Allmendinger, R.W., Shaw, J.H., 2000. Estimation of fault propagation distance from fold 593 shape: Implications for earthquake hazard assessment. Geology 28, 1099-1102. 594 Atkinson, B.K., 1984. Subcritical crack growth in geological materials. Journal of Geophysical 595 Research: Solid Earth 89, 4077-4114. 596
Barnes, P.M., Ghisetti, F.C., Ellis, S., Morgan, J.K., 2018. The role of protothrusts in frontal 597
accretion and accommodation of plate convergence, Hikurangi subduction margin, New 598 Zealand. Geosphere 14. 599 Bernard, S., Avouac, J.-P., Dominguez, S., Simoes, M., 2007. Kinematics of fault-related folding 600 derived from a sandbox experiment. Journal of Geophysical Research: Solid Earth 112. 601 Brantut, N., Heap, M.J., Meredith, P.G., Baud, P., 2013. Time-dependent cracking and brittle 602 creep in crustal rocks: A review. Journal of Structural Geology 52, 17-43. 603
Cattin, R., Avouac, J.P., 2000. Modeling mountain building and the seismic cycle in the 604 Himalaya of Nepal. Journal of Geophysical Research: Solid Earth 105, 13389-13407. 605 Chester, F.M., Chester, J.S., Kronenberg, A.K., Hajash, A., 2007. Subcritical creep compaction 606 of quartz sand at diagenetic conditions: Effects of water and grain size. Journal of Geophysical 607 Research: Solid Earth 112. 608 Chester, J.S., Chester, F.M., 1990. Fault-propagation folds above thrusts with constant dip. 609 Journal of Structural Geology 12, 903-910. 610 Croizet, D., Renard, F., Gratier, J.-P., 2013. Chapter 3 - Compaction and Porosity Reduction in 611
Carbonates: A Review of Observations, Theory, and Experiments, in: Dmowska, R. (Ed.), 612
Advances in Geophysics. Elsevier, pp. 181-238. 613
Currie, C.A., Hyndman, R.D., 2006. The thermal structure of subduction zone back arcs. 614
Journal of Geophysical Research 111, doi:10.1029/2005JB004024. 615
Dahlen, F.A., 1984. Noncohesive critical Coulomb wedges: an exact solution. Journal of 616
Geophysical Research 89, 10,125-110,133. 617
Dahlen, F.A., 1990. Critical taper model of fold-and-thrust belts and accretionary wedges. 618 Annual Review of Earth and Planetary Sciences 18, 55-99. 619 Davis, D., Suppe, J., Dahlen, F.A., 1983. Mechanics of fold-and-thrust belts and accretionary 620 wedges. Journal of Geophysical Research 88, 1153-1172. 621
Del Castello, M., Cooke, M.L., 2007. Underthrusting-accretion cycle: Work budget as revealed 622
by the boundary element method. J Geophys Res-Sol Ea 112. 623
Dotare, T., Yamada, Y., Adam, J., Hori, T., Sakaguchi, H., 2016. Initiation of a thrust fault 624 revealed by analog experiments. Tectonophysics 684, 148-156. 625 Eisenstadt, G., Depaor, D.G., 1987. Alternative model of thrust-fault propagation. Geology 15, 626 630-633. 627 Fagereng, A., den Hartog, S.A.M., 2017. Subduction megathrust creep governed by pressure 628 solution and frictional-viscous flow. Nature Geosci 10, 51-57. 629 Fujiwara, T., Kodaira, S., No, T., Kaiho, Y., Takahashi, N., Kaneda, Y., 2011. The 2011 Tohoku-630 Oki Earthquake: Displacement Reaching the Trench Axis. Science 334, 1240-1240. 631
Gerya, T., 2010. Introduction to Numerical Geodynamic Modelling. Cambridge University 632 Press, Cambridge, U.K. 633 Goff, D., Wiltschko, D.V., 1992. Stresses beneath a ramping thrust sheet. Journal of Structural 634 Geology 14, 437-449. 635
Gratier, J.-P., Dysthe, D.K., Renard, F., 2013. The Role of Pressure Solution Creep in the 636
Ductility of the Earth’s Upper Crust. Advances in Geophysics 54, 47-179. 637
Gutscher, M.A., Kukowski, N., Malavieille, J., Lallemand, S., 1998. Episodic imbricate thrusting 638
and underthrusting: Analog experiments and mechanical analysis applied to the Alaskan 639 accretionary wedge. J Geophys Res-Sol Ea 103, 10161-10176. 640 Hill, E.M., Borrero, J.C., Huang, Z., Qiu, Q., Banerjee, P., Natawidjaja, D.H., Elosegui, P., Fritz, 641 H.M., Suwargadi, B.W., Pranantyo, I.R., Li, L., Macpherson, K.A., Skanavis, V., Synolakis, C.E., 642 Sieh, K., 2012. The 2010 Mw 7.8 Mentawai earthquake: Very shallow source of a rare tsunami 643
earthquake determined from tsunami field survey and near-field GPS data. Journal of 644 Geophysical Research: Solid Earth 117, n/a-n/a. 645 Hubbard, J., Barbot, S., Hill, E.M., Tapponnier, P., 2015. Coseismic slip on shallow décollement 646 megathrusts: implications for seismic and tsunami hazard. Earth-Science Reviews 141, 45-647 55. 648 Hubbard, J., Shaw, J.H., Dolan, J., Pratt, T.L., McAuliffe, L., Rockwell, T.K., 2014. Structure and 649 Seismic Hazard of the Ventura Avenue Anticline and Ventura Fault, California: Prospect for 650
Large, Multisegment Ruptures in the Western Transverse Ranges. Bulletin of the 651 Seismological Society of America 104, 1070-1087. 652 Hughes, A.N., Shaw, J.H., 2015. Insights into the mechanics of fault-propagation folding styles. 653 Geological Society of America Bulletin 127, 1752-1765. 654
Karig, D.E., 1986. The framework of deformation in the Nankai Trough, Initial Reports Deep 655 Sea Drilling Projects. U.S. Government Printing Office, Washington, pp. 927-940. 656 Kohlstedt, D.L., Hansen, L.N., 2015. 2.18 - Constitutive Equations, Rheological Behavior, and 657 Viscosity of Rocks A2 - Schubert, Gerald, Treatise on Geophysics (Second Edition). Elsevier, 658 Oxford, pp. 441-472. 659 Koyi, H., 1995. Mode of internal deformation in sand wedges. Journal of Structural Geology 660 17, 293-300. 661 Lavé, J., Avouac, J.P., 2000. Active folding of fluvial terraces across the Siwalik Hills (Himalaya 662 of central Nepal). J. Geophys. Res. 105, 5735-5770. 663
Lohrmann, J., Kukowski, N., Adam, J., Oncken, O., 2003. The impact of analogue material 664
properties on the geometry, kinematics, and dynamics of convergent sand wedges. Journal 665
of Structural Geology 25, 1691-1711. 666
MacKay, M.E., 1995. Structural variation and landward vergence at the toe of the Oregon 667 accretionary prism. Tectonics 14, 1309-1320. 668 McConnell, D.A., Kattenhorn, S.A., Benner, L.M., 1997. Distribution of fault slip in outcrop-669 scale fault-related folds, Appalachian Mountains. Journal of Structural Geology 19, 257-267. 670 Moore, G.F., Taira, A., Klaus, A., Becker, L., Boeckel, B., Cragg, B.A., Dean, A., Fergusson, C.L., 671
Henry, P., Hirano, S., Hisamitsu, T., Hunze, S., Kastner, M., Maltman, A.J., Morgan, J.K., 672
Murakami, Y., Saffer, D.M., Sánchez-Gómez, M., Screaton, E.J., Smith, D.C., Spivack, A.J., Steurer, 673
J., Tobin, H.J., Ujiie, K., Underwood, M.B., Wilson, M., 2001. New insights into deformation and 674
fluid flow processes in the Nankai Trough accretionary prism: Results of Ocean Drilling 675 Program Leg 190. Geochemistry, Geophysics, Geosystems 2, n/a-n/a. 676 Moore, J.C., Saffer, D., 2001. Updip limit of the seismogenic zone beneath the accretionary 677 prism of southwest Japan: An effect of diagenetic to low-grade metamorphic processes and 678 increasing effective stress. Geology 29, 183-186. 679 Morgan, J.K., 2015. Effects of cohesion on the structural and mechanical evolution of fold and 680 thrust belts and contractional wedges: Discrete element simulations. Journal of Geophysical 681 Research: Solid Earth 120, 3870-3896. 682
Morgan, J.K., Karig, D.E., 1995. Décollement processes at the Nankai accretionary margin, 683
southeast Japan: Propagation, deformation, and dewatering. Journal of Geophysical 684 Research: Solid Earth 100, 15221-15231. 685 Morley, C.K., 1994. Fold-generated imbricates - examples from the Caledonides of southern 686 Norway. Journal of Structural Geology 16, 619-631. 687
Niemeijer, A.R., Spiers, C.J., Bos, B., 2002. Compaction creep of quartz sand at 400–600°C: 688
experimental evidence for dissolution-controlled pressure solution. Earth and Planetary 689
Science Letters 195, 261-275. 690
Nivière, B., Giamboni, M., Innocent, C., Winter, T., 2006. Kinematic evolution of a tectonic 691
wedge above a flat-lying décollement: The Alpine foreland at the interface between the Jura 692
Mountains (Northern Alps) and the Upper Rhine graben. Geology 34, 469-472. 693
Noort, R.v., Spiers, C.J., 2009. Kinetic effects of microscale plasticity at grain boundaries 694
during pressure solution. Journal of Geophysical Research: Solid Earth 114. 695
Olive, J.-A., Behn, M.D., Mittelstaedt, E., Ito, G., Klein, B.Z., 2016. The role of elasticity in 696
simulating long-term tectonic extension. Geophysical Journal International. 697
Ruh, J.B., 2017. Effect of fluid pressure distribution on the structural evolution of 698 accretionary wedges. Terra Nova 29, 202-210. 699 Scholz, C.J., 1998. Earthquakes and friction laws. Nature 391, 37-42. 700 Simpson, G., 2011. Mechanics of non-critical fold-thrust belts based on finite element models. 701 Tectonophysics 499, 142-155. 702 Skempton, A.W., 1960. Terzaghi's discovery of effective stress, in: Bjerrum, L., Casagrande, 703 A., Peck, R.B., Skempton, A.W. (Eds.), From Theory to Practice in Soil Mechanics: Selections 704 from teh Writings of Karl Terzaghi. Wiley, New York, pp. 42-53. 705 Stein, R.S., Yeats, R.S., 1989. Hidden Earthquakes. Scientific American 260, 48-59. 706 Stockmal, G.S., Beaumont, C., Nguyen, M., Lee, B., 2007. Mechanics of thin-skinned fold-and-707
thrust belts: Insights from numerical models, in: Sears, J.W., Hairns, T.A., Evenchick, C.A. 708 (Eds.), Whence the Mountains? Inquiries into the Evolution of Orogenic Systems: A Volume 709 in Honor of Raymond A. Price. The Geological Society of America, pp. 63-98. 710 Suppe, J., 2014. Fluid overpressures and strength of the sedimentary upper crust. Journal of 711 Structural Geology 69, 481-492. 712
Suppe, J., Medwedeff, D., 1990. Geometry and kinematics of fault-propagation folding. 713
Eclogae Geologicae Helvetiae 83, 409-454. 714
Tavani, S., Storti, F., Lacombe, O., Corradetti, A., Muñoz, J.A., Mazzoli, S., 2015. A review of 715
deformation pattern templates in foreland basin systems and fold-and-thrust belts: 716
Implications for the state of stress in the frontal regions of thrust wedges. Earth-Science 717 Reviews 141, 82-104. 718 Yue, L.-F., Suppe, J., Hung, J.-H., 2005. Structural geology of a classic thrust belt earthquake: 719 the 1999 Chi-Chi earthquake Taiwan (Mw=7.6). Journal of Structural Geology 27, 2058-2083. 720
Zhang, J., 2013. Effective stress, porosity, velocity and abnormal pore pressure prediction 721 accounting for compaction disequilibrium and unloading. Marine and Petroleum Geology 45, 722 2-11. 723 724
Weiss et al., Formation of the frontal zone of accretionary wedges FIGURES
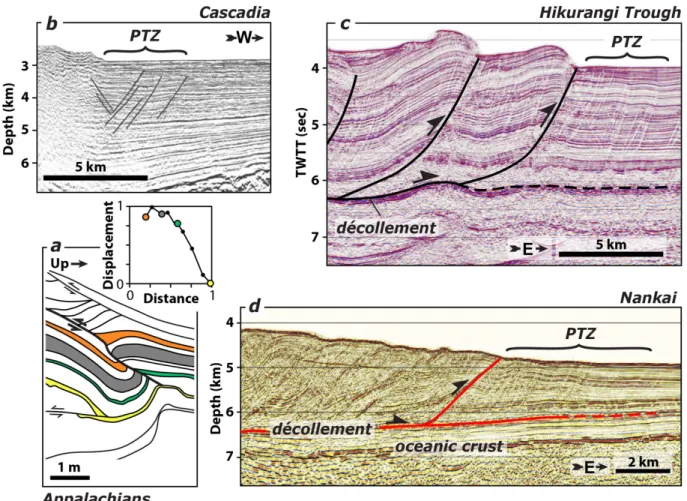
Figure 1 Evidence of thrust faults initiating at or near the surface. (a) Line drawing from
the Appalachian Valley and Ridge fold-and-thrust belt, showing an outcropping thrust fault where measured displacement (inset) decreases down-section into the footwall syncline (redrawn from McConnell et al., 1997). (b-d) Multi-channel seismic reflection images showing the protothrust zones (PTZ) in front of the (b) Cascadia accretionary prism (MacKay, 1995), (c) Hikurangi subduction zone (Barnes et al., 2010), and (d) Nankai Trough (Moore et al., 1990). Karig (1986) define the PTZ as a region forward of the main thrust characterized by disrupted reflection horizons, diffuse thickening, shortening, and porosity reduction that occurs prior to thrusting.
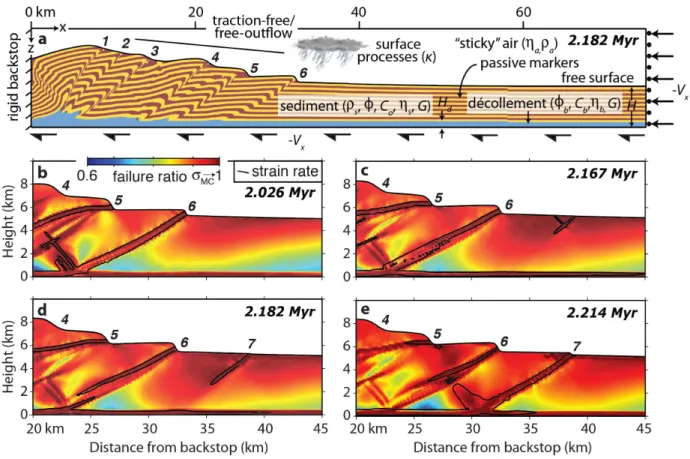
Figure 2 Predictions of the formation of a new frontal thrust in our reference model
(f=30°; fb=15°; k=5×10⁻⁹). (a) Whole model domain at t = 2.182 Myr. The brittle sediment
layer contains passive yellow and brown markers for visualizing accumulated deformation. The frictionally weak basal décollement is blue. Boundary conditions are illustrated and forethrusts are numbered (1-6) in order of when they first appeared. The bold line above the fault numbers indicates the theoretical surface taper angle (a=5.3°) for a cohesionless wedge (Dahlen, 1990). (b - e) Time steps illustrating the formation of a new frontal thrust
where the failure ratio is (s3−s1) divided by the Mohr-Coulomb yield stress. Black
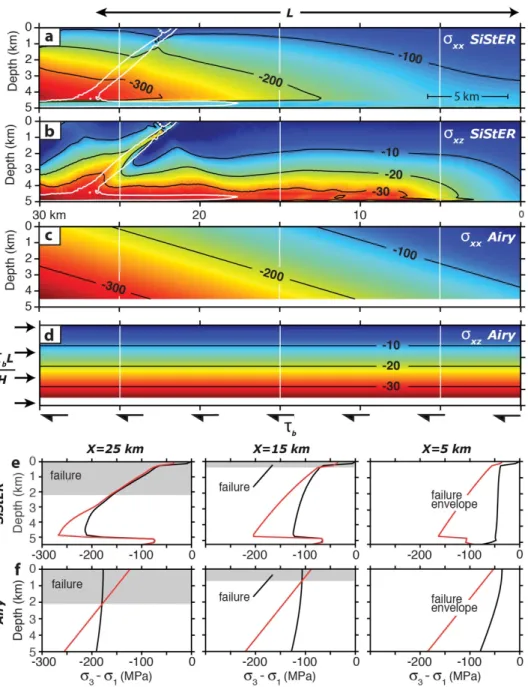
Figure 3 Predicted stress state in front of the wedge for the model shown in Figure 2. (a)
and (b) show sxx and sxz, respectively, predicted by SiStER just after a new frontal thrust
forms (just after time step shown in Figure 2d). Black contours are in units of MPa and contours of elevated strain rate (bold white) highlight the active frontal thrust and
décollement. (c) and (d) show sxx and sxz from the elastic stress model; boundary
conditions indicated with thick black arrows in (d). Profiles of the (e) SiStER and (f) Airy differential stresses (solid black) at locations marked by vertical white lines in (a)-(d). Yield stress profiles are solid red, regions of predicted (incipient) brittle failure are gray.
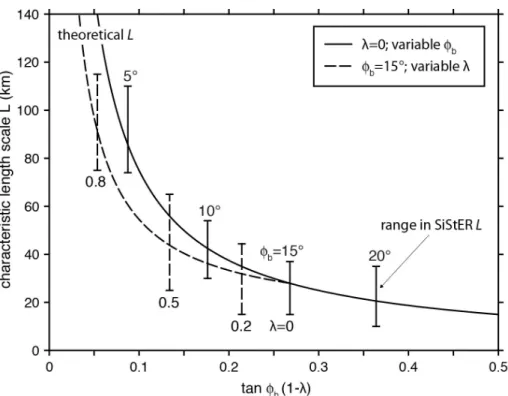
Figure 4 A comparison of L versus basal friction angle fb and pore-fluid pressure l from
the SiStER models and simple force balance arguments presented in Section 3.2 and 4.2 of the main text. The solid black curve is the theoretical length scale L predicted by Eq. (6)
for a case where l = 0. The solid vertical black bars are the range in estimated L measured
from the corresponding SiStER models (fb=5°,10°,15°, and 20°; also see Fig. S3 of the
Supplementary Information). The dashed black curve is the theoretical length scale L
predicted by Eq. (11) for a case with fb=15° and variable l. The dashed vertical black bars
are the range in estimated L measured from the corresponding SiStER models
(l=0,0.2,0.5,0.8). The SiStER L values are generally well explained by the theoretical
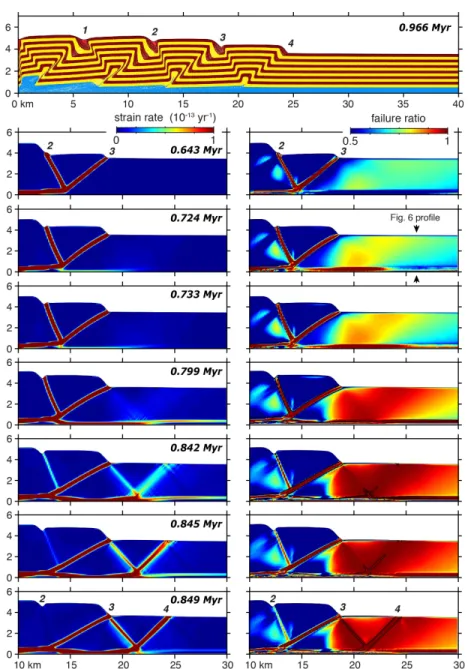
Figure 5 Numerical model predictions of the formation of a new frontal thrust under the
influence of elevated pore-fluid pressure (l=0.8; f=30°; fb=15°; H=3. 5 km Hd = 0. 5 km;
C0=25 MPa; Cmin=5 MPa). Top panel shows stratigraphic markers for the model domain at
~1 Myr, after forethrust #4 has accumulated significant strain. Subsequent panels show strain rate (left) and failure ratio (right) at different time steps leading to the initiation of forethrust #4. At 0.724 Myr an area at the base of the sediment section outboard of fault #3 begins to approach failure. This zone broadens up and outward and after 0.799 Myr almost the entire protothrust region, from the surface to the décollement is close to failure. At 0.842 Myr, a high-strain shear band forms above the décollement, propagates up-dip, and
intersects the surface at 0.849 Myr. High strain rates (10-13 yr-1) are contoured in the bottom
3 failure panels to draw attention to new frontal thrust initiation. An animation of the associated model run is included in the Supplement.
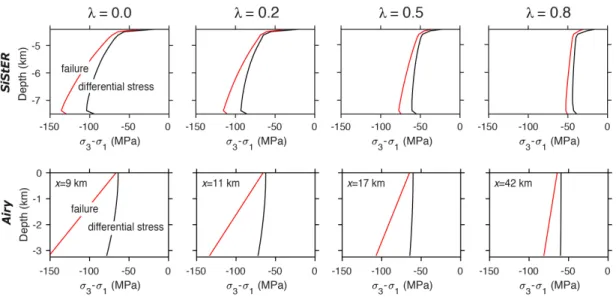
Figure 6 Differential stress (black) and Mohr-Coulomb failure (red) profiles from just prior
to the formation of a new frontal thrust for SiStER (top) and Airy elastic stress models
(bottom). Pore-fluid pressure ratios (l) increase from left to right. For the SiStER models,
profiles are located 26 km from the backstop at variable model times when stresses are
increasing but prior to brittle failure (e.g. 0.724 Myr from the l=0.8 model in Fig. 5; see
Figure S6 and supplemental animations for l=0.0/0.2/0.5 examples). The Airy profiles are
taken from comparable locations (i.e. prior to brittle failure; x position labeled in plots). Both the numerical model and stress analysis predict a decrease in the absolute value of stress and a decrease in the slopes of the failure and differential stress curves with
increasing l so that the wedge front region is closer to failure over a greater depth range
with increasing l. Therefore, at higher values of l a new thrust can initiate anywhere in
the sediment layer including near the décollement (e.g. Fig. 5).