HAL Id: hal-00318069
https://hal.archives-ouvertes.fr/hal-00318069
Submitted on 3 Jul 2006
HAL is a multi-disciplinary open access
archive for the deposit and dissemination of
sci-entific research documents, whether they are
pub-lished or not. The documents may come from
teaching and research institutions in France or
abroad, or from public or private research centers.
L’archive ouverte pluridisciplinaire HAL, est
destinée au dépôt et à la diffusion de documents
scientifiques de niveau recherche, publiés ou non,
émanant des établissements d’enseignement et de
recherche français ou étrangers, des laboratoires
publics ou privés.
Eastward traverse of equatorial plasma plumes observed
with the Equatorial Atmosphere Radar in Indonesia
S. Fukao, T. Yokoyama, T. Tayama, M. Yamamoto, T. Maruyama, S. Saito
To cite this version:
S. Fukao, T. Yokoyama, T. Tayama, M. Yamamoto, T. Maruyama, et al.. Eastward traverse of
equatorial plasma plumes observed with the Equatorial Atmosphere Radar in Indonesia. Annales
Geophysicae, European Geosciences Union, 2006, 24 (5), pp.1411-1418. �hal-00318069�
www.ann-geophys.net/24/1411/2006/ © European Geosciences Union 2006
Annales
Geophysicae
Eastward traverse of equatorial plasma plumes observed with the
Equatorial Atmosphere Radar in Indonesia
S. Fukao1, T. Yokoyama1,∗, T. Tayama1,∗ ∗, M. Yamamoto1, T. Maruyama2, and S. Saito2 1Research Institute for Sustainable Humanosphere, Kyoto University, Kyoto, Japan
2National Institute of Information and Communications Technology, Tokyo, Japan
∗now at: Solar-Terrestrial Environment Laboratory, Nagoya University, Aichi, Japan ∗∗now at: NTT Data Co. Ltd., Tokyo, Japan
Received: 1 September 2005 – Revised: 22 November 2005 – Accepted: 5 December 2005 – Published: 3 July 2006 Part of Special Issue “The 11th International Symposium on Equatorial Aeronomy (ISEA-11), Taipei, May 2005”
Abstract. The zonal structure of radar backscatter plumes
associated with Equatorial Spread F (ESF), probably mod-ulated by atmospheric gravity waves, has been investigated with the Equatorial Atmosphere Radar (EAR) in West Suma-tra, Indonesia (0.20◦S, 100.32◦E; dip latitude 10.1◦S) and the FM-CW ionospheric sounders on the same magnetic meridian as the EAR. The occurrence locations and zonal distances of the ESF plumes were determined with multi-beam observations with the EAR. The ESF plumes drifted eastward while keeping distances of several hundred to a thousand kilometers. Comparing the occurrence of the plumes and the F-layer uplift measured by the FM-CW sounders, plumes were initiated within the scanned area around sunset only, when the F-layer altitude rapidly in-creased. Therefore, the PreReversal Enhancement (PRE) is considered as having a zonal variation with the scales men-tioned above, and this variation causes day-to-day variability, which has been studied for a long time. Modulation of the underlying E-region conductivity by gravity waves, which causes inhomogeneous sporadic-E layers, for example, is a likely mechanism to determine the scale of the PRE.
Keywords. Ionosphere (Equatorial ionosphere; Ionospheric
irregularities) – Radio science (Remote sensing)
1 Introduction
Field-aligned irregularities or plasma plumes associated with Equatorial Spread F (ESF) have been studied intensively with a coherent backscatter technique after the discovery of upward–developing plasma plumes with the Jicamarca
Correspondence to: S. Fukao
(fukao@rish.kyoto-u.ac.jp)
VHF radar (Woodman and LaHoz, 1976). ESF plumes are believed to be a result of the generalized Rayleigh-Taylor instability, in which the bottomside equatorial F-region is raised and grows nonlinearly into the topside, resulting in so-called plasma bubbles (e.g. Ossakow, 1981; Kelley, 1989). The most important phenomenon related to the ESF is a sharp enhancement of the eastward electric field in the evening equatorial F-region that increases both the electrodynamic (direct) and gravitational (indirect) terms of the growth rate of the Rayleigh-Taylor instability. This enhanced electric field raises the F-layer to higher altitudes, an effect which is well known as the PreReversal Enhancement (PRE) (e.g. Woodman, 1970). The PRE is due to the dynamo elec-tric field in the equatorial F-region, which develops when the underlying E-region conductivity rapidly decreases in the evening (e.g. Farley et al., 1986; Haerendel and Eccles, 1992). While the seasonal and solar-cycle dependence of the PRE has been well investigated (e.g. Fejer et al., 1979), the day-to-day variability of the PRE is still an unresolved prob-lem for the prediction of the ESF occurrence (Abdu, 2001; Tsunoda, 2005).
Large-scale (more than a few hundred kilometers) modula-tion of the bottomside equatorial F-region as an initial condi-tion for ESF has been investigated by many researchers with a transequatorial propagation experiment (R¨ottger, 1973), the Jicamarca radar (e.g. Kelley et al., 1981), the ALTAIR radar (e.g. Tsunoda and White, 1981), and in-situ satellite mea-surements (e.g. Oya et al., 1986; Eccles, 2004). Recent ground- and satellite-based airglow observations have also been a powerful technique to detect the zonal structure of the equatorial and low-latitude F-regions (e.g., Ogawa et al., 2005). Kelley et al. (1981) and Hysell et al. (1990) con-cluded that the large-scale modulation is partially due to spa-tially resonant atmospheric gravity waves (Beer, 1973), and
1412 S. Fukao et al.: Eastward traverse of plasma plumes
Fig. 1. Latitude–altitude cross section which shows the EAR site and Chumphon and geomagnetic field lines.
then the seeded perturbation is amplified by the Rayleigh-Taylor instability. On the other hand, based on observa-tions of bottom-type scattering layers (Hysell et al., 2004) and zonal plasma flow shears (Haerendel et al., 1992) at the dip equator, Hysell and Kudeki (2004) proposed a collisional shear instability to produce bottom-type spread F, which may serve as seed waves for the large-scale Rayleigh-Taylor in-stability. Prakash (1999) suggested another idea, that electric field perturbations should be produced by gravity waves in the low-latitude E region through the Hall polarization pro-cess and map up to the equatorial F-region base to seed the Rayleigh-Taylor instability. At the present time, any direct evidence that will show the relationship between the large-scale structure of the bottomside F-layer and ESF plumes or bubbles is strongly needed to verify these hypotheses (Tsun-oda, 2005).
The 47-MHz Equatorial Atmosphere Radar (EAR) in West Sumatra, Indonesia (0.20◦S, 100.32◦E; dip latitude 10.1◦S) has an active phased-array antenna system which allows rapid beam-scanning on a pulse-to-pulse basis (Fukao et al., 2003a). Multi-beam observations of ESF with the EAR have revealed important aspects in terms of plume spatial distribu-tion that could not be understood with slit-camera-like radar observations (Fukao et al., 2003b, 2004; Otsuka et al., 2004; Yokoyama et al., 2004, 2005). Yokoyama et al. (2004) in-vestigated the accurate onset time of ESF plumes and re-vealed that it is closely related to sunset at the altitude of the apex of the geomagnetic field line connected to the ob-served area. Their study indicates that ESF plumes occur exclusively around sunset, and that the coupling between the equatorial and low-latitude regions is very important for the ESF occurrence. Considering plume occurrence at apex sunset and their eastward drift velocity obtained from multi-beam observations, one can estimate the plume occurrence location. In the present paper, we describe a plausible ex-planation for the observed large-scale spatial distribution of
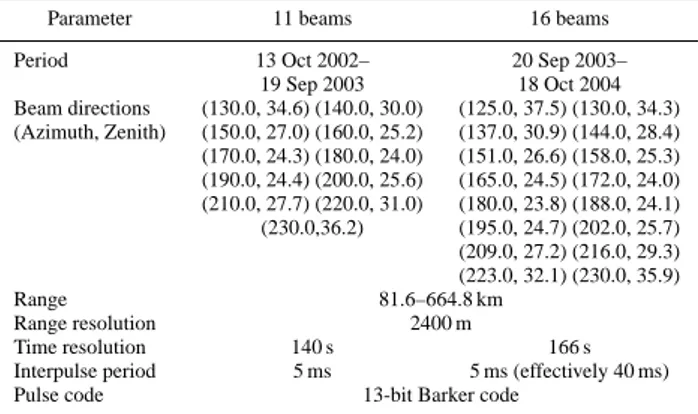
Table 1. Experimental specifications used for the present observa-tions.
Parameter 11 beams 16 beams
Period 13 Oct 2002– 20 Sep 2003–
19 Sep 2003 18 Oct 2004 Beam directions (130.0, 34.6) (140.0, 30.0) (125.0, 37.5) (130.0, 34.3) (Azimuth, Zenith) (150.0, 27.0) (160.0, 25.2) (137.0, 30.9) (144.0, 28.4) (170.0, 24.3) (180.0, 24.0) (151.0, 26.6) (158.0, 25.3) (190.0, 24.4) (200.0, 25.6) (165.0, 24.5) (172.0, 24.0) (210.0, 27.7) (220.0, 31.0) (180.0, 23.8) (188.0, 24.1) (230.0,36.2) (195.0, 24.7) (202.0, 25.7) (209.0, 27.2) (216.0, 29.3) (223.0, 32.1) (230.0, 35.9) Range 81.6–664.8 km Range resolution 2400 m Time resolution 140 s 166 s
Interpulse period 5 ms 5 ms (effectively 40 ms)
Pulse code 13-bit Barker code
ESF plumes in terms of occurrence location and mechanism of generation, along with the clue from FM-CW ionospheric sounders that the F-layer uplift, due to PRE, is not zonally uniform but has a zonal structure similar to that of the ESF plumes.
2 Experimental description
Multi-beam observations of ESF with the EAR have been conducted in each equinoctial season since October 2002. The observations were conducted with 11 antenna beams from 13 October 2002 to 19 September 2003 (11 sets of single-beam mode), and 16 beams from 20 September 2003 to 18 October 2004 (2 sets of 8-beam mode). Details of the observational parameters are listed in Table 1. The zenith angle in each direction was determined to satisfy the per-pendicularity of the beam with the geomagnetic field at an altitude of 350 km, by using the International Geomagnetic Reference Field model (IGRF2000). Details are described in Fukao et al. (2004).
FM-CW sounders, which belong to the network called SouthEast Asia Low-latitude Ionospheric Observation Net-work (SEALION), were installed at Kototabang in Indonesia (the EAR site) and Chumphon in Thailand (10.7◦N, 99.4◦E; dip latitude 3.2◦N), close to the geomagnetic dip equator on the same magnetic meridian as the EAR. Figure 1 shows a latitude–altitude cross section including both sites and geo-magnetic field lines. The geogeo-magnetic field line that reaches its apex at an altitude of 300 km over the dip equator crosses 125 km over the EAR, and the line that passes 300 km over the EAR reaches its apex altitude approximately 474 km over the dip equator. The sounders at Kototabang and Chumphon have been operated since March 2004. In the present pa-per, time variations of the bottom altitude of the F-layer (cor-responding to 2.5 MHz radio reflection) obtained at Kotota-bang and Chumphon in March 2004 are used as an indication of the PRE.
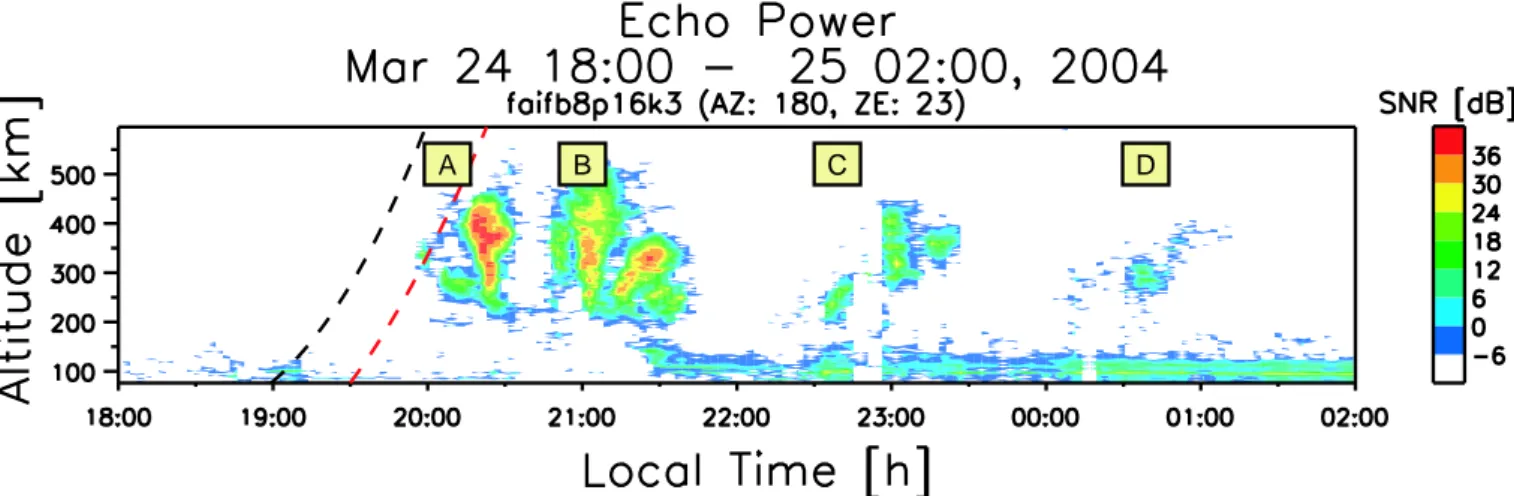
C
B D
A
Fig. 2. Altitude-time-intensity (ATI) plot of ESF plumes observed with the EAR from 18:00 LT on 24 March to 02:00 LT on 25 March 2004. Black and red lines indicate local and apex sunset terminators, respectively.
3 Observational results
3.1 Backtrace of plasma plumes
Radar backscatter plumes associated with ESF (ESF plumes) sometimes appeared intermittently with periods of several tens of minutes to a few hours (e.g. Woodman and LaHoz, 1976). This can be interpreted as spatial structures which drift eastward into and out of the radar beam, according to the nighttime dynamo electric field. We can obtain the ac-tual drift velocity from the multi-beam observations without slit-camera interpretation or a frozen-in assumption of ESF plumes. In this section, we trace each plasma plume back to the occurrence location from which it travels eastward during the nighttime.
Figure 2 shows an altitude-time-intensity (ATI) plot of ESF plumes obtained from one of the 16 beams used in the experiment of 24 March 2004, the one directed due south. The ionosphere was quiet with a Kp index of less than 3+ from 20 to 25 March 2004. Black and red lines indicate local and apex sunset terminators, respectively (Yokoyama et al., 2004). These echoes are divided into four groups. The plumes which occurred within the scanned area (see below), before 22:00 LT, around 23:00 LT, and after midnight, are labeled group A, B, C, and D, respectively. Multi-plumes within each group may be due to bifurcation of the initial plasma bubble (e.g. Zalesak et al., 1982). ESF plumes ob-served with the EAR are generally limited to pre-midnight while weak echoes, such as group D, are sometimes observed after midnight, as late as 02:00 LT. Disruption of E-region echoes during the growth phase of ESF before 21:20 LT and continuous E-region echoes after 21:20 LT are also a general characteristic seen with the EAR (Patra et al., 2005).
Figure 3 shows temporal variation of echo intensity from ESF plumes against zonal distance at an altitude of 300 km. Combining echo intensities from 16 azimuthal directions,
Fig. 3. Temporal variation of ESF plumes against zonal distance at the altitude of 300 km from 19:40 LT on 24 March to 01:40 LT on 25 March 2004. Vertical axis indicates zonal distance (positive eastward) from the EAR.
we do not require slit-camera interpretation to discuss the zonal motion of the plumes. All plumes that appeared on 24 March 2004 have positive slopes in Fig. 3, which rep-resent an eastward motion of the plumes. The plumes in group A occurred within the scanned area between 20:00 LT and 20:20 LT, which corresponded just to apex sunset time (Yokoyama et al., 2004). Each of the three plumes in group A occurred around apex sunset and drifted away without cross-ing the others. After 20:20 LT, all plumes appeared first in the westernmost beam (bottom of Fig. 3) and then drifted eastward. The echo intensity in groups C and D was much weaker than that in groups A and B. Plumes in group D dis-appeared within the scanned area at 01:00 LT. It should be
1414 S. Fukao et al.: Eastward traverse of plasma plumes
Fig. 4. Local time dependence of the eastward drift velocity of ESF plumes. Plotted data have been collected from 23 days of observa-tions with the EAR from 13 October 2002 to 5 October 2004.
noted from all observations with the EAR that the initiation of plumes within the scanned area (as group A) was seen only around sunset, that is, all plumes observed after sunset en-tered the scanned area from the western edge of the scanned area (as groups B to D; they are all called fossil plumes – Kelley, 1989). It is then confirmed that all ESF plumes are generated around sunset and drift eastward before decaying around midnight.
From the slopes of echo intensity shown in Fig. 3, the east-ward drift velocity of plumes can be estimated. The drift ve-locities of plumes estimated from data of 23 days (from 13 October 2002 to 5 October 2004) when ESF plumes were observed are plotted versus local time in Fig. 4. The ge-omagnetic activity on these days was as low as that of 24 March 2004, shown in Fig. 2. The velocity reaches as large as 140 ms−1around sunset and decreases with local time at the rate of approximately 10 ms−1h−1. Such time variation of zonal drift of the ESF plumes is consistent with the plasma drift velocity measured with the incoherent backscatter tech-nique at Jicamarca, a velocity controlled by the downward dynamo electric field in the nighttime (Fejer et al., 1981). Assuming that equatorial plasma bubbles occur at apex sun-set and that their eastward drift velocity is represented by the linear regression line in Fig. 4, individual ESF plumes can be traced back to their occurrence locations.
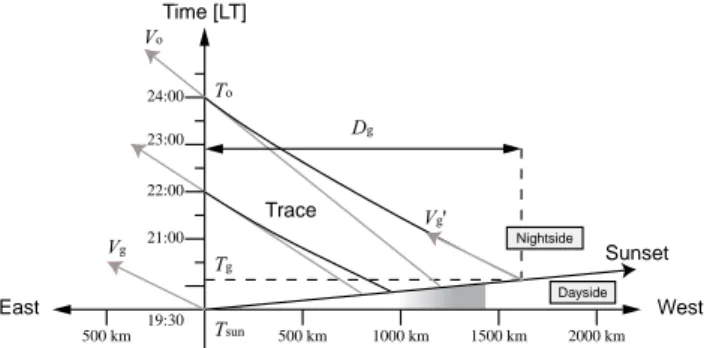
Figure 5 shows the method devised to trace the plumes back to their origin. The horizontal and vertical axes repre-sent zonal distance from the EAR and local time at the EAR, respectively. Given that a plume is generated at a distance
Dgat local time Tgof the EAR, Dgis written as
Dg=-Vsun(Tg-Tsun) , (1)
where Vsunis the westward velocity of the sunset terminator
(464 ms−1 over the equator), and Tsun is sunset time at the
EAR site. The plume drifts toward the east and is observed
500 km 1000 km 1500 km 19:30 21:00 23:00 500 km 22:00 24:00 2000 km Time [LT] East West Sunset Trace Dayside Nightside
Fig. 5. A schematic diagram representing the method to trace ESF plumes back to their origin.
with the EAR at Towith a velocity of Vo. Assuming that the
plume has a velocity of Vgat the initial stage (Tg) and there
is a linear decay of the drift velocity, Dgcan also be written
as
Dg=(To-Tg)(Vo+Vg)/2. (2)
Eliminating Tgfrom Eqs. (1) and (2), Dgcan be obtained as
Dg=
−Vsun(To−Tsun)(Vo+Vg)/2
(Vo+Vg)/2 − Vsun
, (3)
where Vgis given from the regression line in Fig. 4.
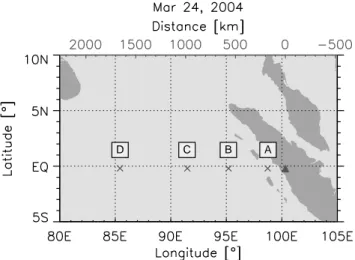
The estimated occurrence locations of the plumes on 24 March 2004 are shown in Fig. 6. Symbols A to D correspond to the groups of ESF plumes shown in Fig. 2. Multi-plumes within the same group were considered as bifurcations from the original common bubble. Zonal distances between A and B, B and C, and C and D were 420, 410, and 670 km, re-spectively. Considering decay of the plumes in group D, 3-m scale irregularities associated with equatorial plasma bubbles generated to the west of 85◦E could not reach 100◦E above the EAR. This method was applied to 16 nights when we could estimate distances between groups of ESF plumes, re-sulting in distances ranging from 370 to 1000 km and aver-aging 690 km.
3.2 Echo appearance and the F-layer uplift
The PRE, or enhancement of eastward electric field in the evening, is one of the essential phenomena for excitation of the Rayleigh-Taylor instability (e.g. Kelley et al., 1981). F-layer uplift due to the PRE contributes to an increase in the growth rate of the Rayleigh-Taylor instability accord-ing to the decrease in the collision frequency with the neu-trals. The altitude variation of the F-layer monitored with the SEALION FM-CW sounders can be an indicator of the PRE and initiation of the Rayleigh-Taylor instability. Dur-ing March 2004, plumes associated with ESF were observed for 12 nights and not observed for 5 nights. Averaged time variations of the F-layer 2.5-MHz altitude over Kototabang (EAR site) and Chumphon (dip equator) are shown for each
A B C D
Fig. 6. Occurrence location of ESF plumes plotted on a map in the geographic coordinate. Symbols from A to D correspond to groups of plumes shown in Fig. 2. Zonal distance in kilometers is shown in top axis. A triangle indicates the location of the EAR.
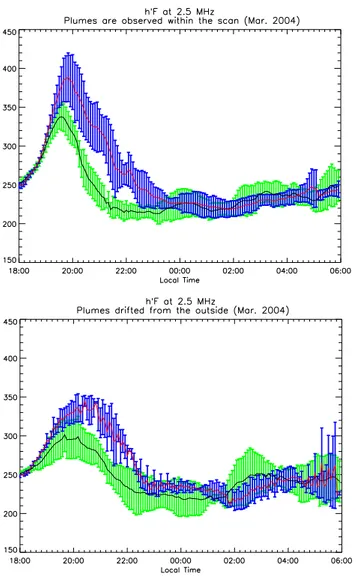
case in Fig. 7. The top and bottom panels show the average altitude when ESF plumes were observed and not observed, respectively. Black and red lines with green and blue stan-dard deviations indicate the time variations over Kototabang and Chumphon, respectively. An increase in the F-layer alti-tude between 18:00 to 19:30 LT was a common phenomenon in both cases. The F-layer reached higher altitudes over both sites, in association with ESF plume occurrence, which agrees with a condition for initiation of the Rayleigh-Taylor instability. However, large standard deviations of the alti-tudes during the uplift indicate that day-to-day variability of the uplift is significant. In order to see the relationship to time of plume occurrence, the top panel of Fig. 7 is divided into two categories in Fig. 8; new plumes occurring within the scanned area at around sunset (7 nights; top panel) and fossil ones drifting from the western edge at later times (5 nights; bottom panel). When ESF plumes drifted from the western edge (bottom panel of Fig. 8), the F-layer altitude variation was comparable to that without any plumes (bot-tom panel of Fig. 7). When new plumes were created within the scanned area (top panel of Fig. 8), on the other hand, the F-layer altitude increased more sharply than that shown in the top panel of Fig. 7. This pattern indicates that initiation of ESF plumes within the scanned area around sunset was evidently accompanied by a strong PRE along the geomag-netic meridian of the EAR site, whereas fossil plumes were not associated with the PRE above the EAR. In other words, if the strong PRE which drives ESF occurs beyond several hundred kilometers west of the EAR, the EAR detects ESF plumes without any indication of PRE at the EAR site or Chumphon. It should be emphasized that both PRE and ESF occurrence have zonal variations with a scale of several hun-dred kilometers each day, and this zonal variation causes the
Fig. 7. Temporal variation of the F-layer 2.5-MHz altitude. The alti-tude was obtained from the FM-CW sounders at Kototabang (black) and Chumphon (red). Top and bottom panels show the averaged al-titude when the ESF plume was observed and not observed, respec-tively.
day-to-day variability of the ESF occurrence, which has been intensively studied for a long time.
4 Discussion
We have shown three important aspects of the initiation of ESF plumes as follows: (1) ESF plumes or 3-m scale irreg-ularities are initiated exclusively around sunset (especially at apex sunset) (Yokoyama et al., 2004), (2) groups of ESF plumes drift eastward while keeping distances of several hun-dred to a thousand kilometers between them, and (3) plumes are initiated within the scanned area around sunset only when the F-layer altitude over the longitudinal sector of the EAR rapidly increases in the evening. Putting the last point in
1416 S. Fukao et al.: Eastward traverse of plasma plumes
Fig. 8. The top panel of Fig. 7 is regrouped into two cases; one is for plumes occurring within the scanned area around sunset (top) and the other for fossil plumes drifting into the scanned area from the west (bottom).
other words, fossil plumes that are observed by the EAR might have occurred due to strong PRE west of the EAR.
Taking these aspects into consideration, a simple model of the zonal distribution of F-layer uplift can be drawn as shown in Fig. 9. When the sunset terminator passes to the west, the eastward electric field is intensified because of the decrease of the E-region conductivity (Farley et al., 1986). The inten-sification is assumed not to be zonally uniform but to have a structure with the scales estimated above. Since the west-ward velocity of the sunset terminator (464 ms−1) is much faster than the eastward drift velocity of the F-region plasma (order of 100 ms−1), the structure can be approximately in-terpreted as a snapshot. If the strongest PRE occurs along the longitudinal sector of the EAR, ESF plumes should be initiated in the scanned area. If the PRE is strongest west of the EAR but weak above the EAR, as shown in Fig. 9, ESF
Fig. 9. A schematic illustration representing the zonal variation of the PRE. When the sunset terminator passes to the west, the F-layer uplift due to the PRE varies with the estimated zonal scale.
plumes are not observed around sunset but enter the scanned area at later time. Since the F-layer altitude decreases rapidly after sunset, the uplift of the F-layer altitude is not observed above the EAR sector in such a case. The factor which de-termines the zonal scale of the PRE is expected to play an important role in initiating ESF plumes.
The estimated characteristic scale of the ESF plumes observed with the EAR is consistent with the scale mea-sured with the ALTAIR radar (Tsunoda and White, 1981), satellites as a depletion of plasma density (Oya et al., 1986; Singh et al., 1997), and a transequatorial propagation exper-iment (R¨ottger, 1973). Makela and Kelley (2003) proposed another technique to estimate plasma-bubble occurrence lo-cation, with composite airglow images from the ground, and showed a case study with bubbles separated by several hun-dred kilometers. Ogawa et al. (2005) showed that plasma bubbles observed with an airglow imager on the ground were embedded in the crest of the 1000-km scale plasma den-sity structure in the equatorial anomaly measured by the IM-AGE satellite. Tsunoda (2005) pointed out the importance of the large-scale wave structure in the bottomside F-region for day-to-day variability of ESF. Our technique to estimate the spatial structure has advantages over the other observations on the following points: (1) no requirement of slit-camera interpretation, as done with the Jicamarca radar (e.g. Hysell et al., 1990), (2) continuous observation of successive ESF plumes, which satellites may miss, and (3) independence from weather or moon conditions, which may disturb obser-vations with ground-based optical imagers.
The essential subject is how the equatorial F-region is modulated with such a scale and what created the seed for the Rayleigh-Taylor instability. Spatial resonance with grav-ity waves propagating in the F-region has been widely inves-tigated as the most plausible mechanism (e.g. Kelley et al., 1981). A collisional shear instability proposed by Hysell and Kudeki (2004) can also produce such structures. On the other hand, Prakash (1999) argued that gravity waves act on the un-derlying E-region and modulate the F-region through the po-larization electric field. We pointed out that the F-layer uplift
in the evening, namely the PRE itself, should be modulated in the zonal direction. Considering that one of the most im-portant factors to determine PRE intensity is a rapid decrease in the E-region conductivity (Tsunoda, 1985; Farley et al., 1986), we propose another likely mechanism, that the mod-ulation of the E-region conductivity by gravity waves with the scales estimated above should be reflected as the zonal pattern of PRE. Although it remains an outstanding subject as to how gravity waves modulate E-region conductivity, we may suggest that inhomogeneous distribution of sporadic-E layers, which suppress PRE (Stephan et al., 2002), should be a cause of the zonal variation of PRE. The Hall polar-ization process can easily occur within such inhomogeneous sporadic-E layers to initiate the Rayleigh-Taylor instability, as proposed by Prakash (1999). Observational evidence of possible correlations between ESF occurrence and sporadic-E layer parameters should be a future subject for the sporadic-EAR and the SEALION FM-CW sounders.
5 Conclusions
From the spatial distribution of occurrence locations of ESF plumes estimated with multi-beam observations of the EAR and the relationship between plume occurrence and F-layer uplift, we have concluded that the intensity of PRE is not zonally uniform but has a zonal variation with a scale of sev-eral hundred to a thousand kilometers. Zonal variation is as important as day-to-day variability for the study of PRE and ESF occurrence. Gravity wave modulation of the underly-ing E-region conductivity, which may create inhomogeneous sporadic-E layers, is a likely mechanism to determine the scale of the PRE and should be studied with the SEALION FM-CW sounders. Coupling between gravity waves gener-ated in the lower atmosphere and the ionospheric E or F-regions should be a focus in the near future. The EAR and the related instruments collocated at the same site are expected to reveal the coupling process in the equatorial atmosphere. Acknowledgements. The present research is partially supported by
Grant-in-Aid for Scientific Research on Priority Area – 764 of the Ministry of Education, Culture, Sports, Science and Technology of Japan. We thank W. L. Oliver (Boston University) for careful edit-ing of revised version of the manuscript. The operation of EAR is based upon the Agreement between RISH and LAPAN signed on 8 September 2000.
Topical Editor M. Pinnock thanks A. Patra and another referee for their help in evaluating this paper.
References
Abdu, M. A.: Outstanding problems in the equatorial ionosphere– thermosphere electrodynamics relevant to spread F, J. Atmos. Solar-Terr. Phys., 63, 869–884, 2001.
Beer, T.: Spatial resonance in the ionosphere, Planet. Space Sci., 21, 297–307, 1973.
Eccles, J. V.: Assimilation of global-scale and mesoscale elec-tric fields from low-latitude satellites, Radio Sci., 39, RS1S09, doi:10.1029/2002RS002810, 2004.
Farley, D. T., Bonelli, E., Fejer, B. G., and Larsen, M. F.: The Pre-Reversal Enhancement of the zonal electric field in the equatorial ionosphere, J. Geophys. Res., 91, 13 723–13 728, 1986. Fejer, B. G., Farley, D. T., Woodman, R. F., and Calderon, C.:
De-pendence of equatorial F-region vertical drifts on season and so-lar cycle, J. Geophys. Res., 84, 5792–5796, 1979.
Fejer, B. G., Farley, D. T., Gonzales, C. A., Woodman, R. F., and Calderon, C.: F-region east-west drifts at Jicamarca, J. Geophys. Res., 86, 215–215, 1981.
Fukao, S., Hashiguchi, H., Yamamoto, M., Tsuda, T., Nakamura, T., Yamamoto, M. K., Sato, T., Hagio, M., and Yabugaki, Y.: Equa-torial Atmospheric Radar (EAR): System description and first results, Radio Sci., 38(3), 1053, doi:10.1029/2002RS002767, 2003a.
Fukao, S., Ozawa, Y., Yamamoto, M., and Tsunoda, R. T.: Altitude-extended equatorial spread F observed near sunrise ter-minator over Indonesia, Geophys. Res. Lett., 30(22), 2137, doi:10.1029/2003GL018383, 2003b.
Fukao, S., Ozawa, Y., Yokoyama, T., Yamamoto, M., and Tsun-oda, R. T.: First observations of spatial structure of F-region 3-m-scale field-aligned irregularities with the Equatorial Atmo-sphere Radar in Indonesia, J. Geophys. Res., 109, A02304, doi:10.1029/2003JA010096, 2004.
Haerendel, G., and Eccles, J. V.: The role of the equatorial electro-jet in the evening ionosphere, J. Geophys. Res., 97, 1181–1192, 1992.
Haerendel, G., Eccles, J. V., and C¸ akir, S.: Theory for modeling the equatorial evening ionosphere and the origin of the shear in the horizontal plasma flow, J. Geophys. Res., 97, 1209–1223, 1992. Hysell, D. L., and Kudeki, E.: Collisional shear instability in the
equatorial F-region ionosphere, J. Geophys. Res., 109, A11301, doi:10.1029/2004JA010636, 2004.
Hysell, D. L., Kelley, M. C., and Swartz, W. E.: Seeding and lay-ering of equatorial spread F by gravity waves, J. Geophys. Res., 95, 17 253–17 260, 1990.
Hysell, D. L., Chun, J., and Chau, J. L.: Bottom-type scattering layers and equatorial spread F, Ann. Geophys., 22, 4061–4069, 2004.
Kelley, M. C., Larsen, M. F., and LaHoz, C.: Gravity wave initiation of equatorial spread F: A case study, J. Geophys. Res., 86, 9087– 9100, 1981.
Kelley, M. C.: The Earth’s Ionosphere: Plasma Physics and Elec-trodynamics, Int. Geophys. Ser., 43, Academic Press, San Diego, Calif, 1989.
Makela, J. J., and Kelley, M. C.: Field-aligned 777.4-nm composite airglow images of equatorial plasma depletions, Geophys. Res. Lett., 30(8), 1442, doi:10.1029/2003GL017106, 2003.
Ogawa, T., Sagawa, E., Otsuka, Y., Shiokawa, K., Immel, T. J., Mende, S. B., and Wilkinson, P.: Simultaneous ground- and satellite-based airglow observations of geomagnetic conjugate plasma bubbles in the equatorial anomaly, Earth Planets Space, 57, 385–292, 2005.
Ossakow, S. L.: Spread-F theories – a review, J. Atmos. Terr. Phys., 43, 437–452, 1981.
Otsuka, Y., Shiokawa, K., Ogawa, T., Yokoyama, T., Yamamoto, M., and Fukao, S.: Spatial relationship of equatorial plasma
bub-1418 S. Fukao et al.: Eastward traverse of plasma plumes bles and field-aligned irregularities observed with an all-sky
air-glow imager and the Equatorial Atmosphere Radar, Geophys. Res. Lett., 31, L20802, doi:10.1029/2004GL020869, 2004. Oya, H., Takahashi, T., and Watanabe, S.: Observation of low
lat-itude ionosphere by the impedance probe on board the Hinotori satellite, J. Geomag. Geoelectr., 38, 111–123, 1986.
Patra, A. K., Yokoyama, T., Yamamoto, M., Saito, S., Maruyama, T., and Fukao, S.: Disruption of E region echoes observed by the EAR during the development phase of equatorial spread F: a manifestation of electrostatic field coupling, Geophys. Res. Lett., 32, L17104, doi:10.1029/2005GL022868, 2005.
Prakash, S.: Production of electric field perturbations by grav-ity wave winds in the E region suitable for initiating equatorial spread F, J. Geophys. Res., 104, 10 051–10 069, 1999.
R¨ottger, J.: Wave-like structures of large-scale equatorial spread-F irregularities, J. Atmos. Terr. Phys., 35, 1195–1206, 1973. Singh, S., Johnson, F. S., and Power, R. A.: Gravity wave seeding
of equatorial plasma bubbles, J. Geophys. Res., 102, 7399–7410, 1997.
Stephan, A. W., Colerico, M., Mendillo, M., Reinisch, B. W., and Anderson, D.: Suppression of equatorial spread F by sporadic E, J. Geophys. Res., 107(A2), doi:10.1029/2001JA000162, 2002. Tsunoda, R. T.: Control of the seasonal and longitudinal
occur-rence of equatorial scintillations by the longitudinal gradient in integrated E region Pedersen conductivity, J. Geophys. Res., 90, 447–456, 1985.
Tsunoda, R. T.: On the enigma of day-to-day variabil-ity in equatorial spread F, Geophys. Res. Lett., L08103, doi:10.1029/2005GL022512, 2005.
Tsunoda, R. T. and White, B. R.: On the generation and growth of equatorial backscatter plumes, 1. Wave structure in the bottom-side F-layer, J. Geophys. Res., 86, 3610–3616, 1981.
Woodman, R. F.: Vertical drift velocities and east-west electric fields at the magnetic equator, J. Geophys. Res., 75, 6249–6259, 1970.
Woodman, R. F. and LaHoz, C.: Radar observations of F-region equatorial irregularities, J. Geophys. Res., 81, 5447–5466, 1976. Yokoyama, T., Fukao, S., and Yamamoto, M.: Relationship of the onset of equatorial F-region irregularities with the sunset termi-nator observed with the Equatorial Atmosphere Radar, Geophys. Res. Lett., 31, L24804, doi:10.1029/2004GL021529, 2004. Yokoyama, T., Patra, A. K., Fukao, S., and Yamamoto, M.:
Iono-spheric irregularities in the low-latitude valley region observed with the Equatorial Atmosphere Radar, J. Geophys. Res., 110, A10207, doi:10.1029/2005JA011208, 2005.
Zalesak S. T., Ossakow, S. L., and Chaturvedi, P. K.: Nonlinear equatorial spread F: The effect of neutral winds and background Pedersen conductivity, J. Geophys. Res., 87, 151–166, 1982.