HAL Id: hal-02672928
https://hal.inrae.fr/hal-02672928
Submitted on 31 May 2020
HAL is a multi-disciplinary open access
archive for the deposit and dissemination of
sci-entific research documents, whether they are
pub-lished or not. The documents may come from
L’archive ouverte pluridisciplinaire HAL, est
destinée au dépôt et à la diffusion de documents
scientifiques de niveau recherche, publiés ou non,
émanant des établissements d’enseignement et de
Effect of nitrogen on intake and digestibility of a tropical
grass grazed by Creole heifers
Maryline Boval, Pablo Cruz, Jean-Emmanuel Ledet, Ode Coppry, Harry
Archimède
To cite this version:
Maryline Boval, Pablo Cruz, Jean-Emmanuel Ledet, Ode Coppry, Harry Archimède. Effect of nitrogen
on intake and digestibility of a tropical grass grazed by Creole heifers. Journal of Agricultural Science,
Cambridge University Press (CUP), 2002, 138, pp.73-84. �hal-02672928�
DOI : 10.1017\S0021859601001721 Printed in the United Kingdom
Effect of nitrogen on intake and digestibility of a
tropical grass grazed by Creole heifers
M. B O V A L"*, P. CRUZ#, J. E. LEDET", O. COPPRY" H. ARCHIMEDE"
" Institut National de la Recherche Agronomique (INRA) Antilles-Guyane, Station de Zootechnie,
Domaine Duclos, 97170 Petit-Bourg, Guadeloupe (F.W.I.)
# Institut National de la Recherche Agronomique (INRA) Toulouse, Station d’Agronomie, BP 27,
31326 Castanet-Tolosan, France
(Revised MS received 20 June 2001)
S U M M A R Y
So far, little has been done on the effect of nitrogen fertilizer on intake and digestibility in tropical
grazing conditions. The effect of two nitrogen levels, 0 (NF) and 50 kg\ha (F) for three successive
grazing cycles, on organic matter intake (OMi) and digestibility (OMd) for Creole heifers (208 kg live weight) was determined. Two groups of four tethered heifers, allowed 18 kg of dry matter daily, grazed individual NF or F circular areas at 28 re-growth days. The heifers were moved and watered daily. Sward characteristics (height, herbage mass, morphological and chemical composition and in
situtiller measurements), OMi, OMd and feeding behaviour (biting rate, bite size, intake rate, grazing
and ruminating times) were evaluated simultaneously per circular area.
Under nitrogen fertilizer, the stems elongated rapidly (by 133 %) as did the leaves, but to a lesser extent (by 40 %). Consequently, canopy height, leaf and stem masses and crude protein content increased (respectively by 100 %, 66 %, 186 % and 40 %), while total bulk density decreased (by
10n5%). Throughout the successive grazing cycles, there was a particular effect on leaf number, both
in the F and NF swards, whereas this parameter was not affected by the fertilizer level. Under fertilizer, OMi and OMd were both 9 % greater than for the NF sward. The increase in herbage CP content partly explains the rise in OMi, and there is evidence that rumen load has a determining effect on OMi. Leaf mass is the major factor accounting for the 9 % increase in OMd under fertilizer regime. On the other hand, whatever the fertilizer regime, OMd was positively influenced by the greater leaf number throughout the grazing cycles. Biting rate, bite size and intake rate were determined respectively by sward height, CP content and stem fraction, whereas grazing and ruminating times were partially influenced by sward characteristics.
I N T R O D U C T I O N
Nitrogen fertilizer is commonly used to increase animal production at pasture. In tropical pastures,
the live weight (LW) gain reported varies between 1n3
and 4n7 kg LW\ha per year per additional kg of
nitrogen added per hectare (Mears & Humphreys 1974 ; Jones 1990 ; Humphreys 1991). In most studies the greater herbage mass or crude protein content induced by the addition of nitrogen fertilizer are the main parameters put forward to explain the rise in animal production. However, few data in the tropics allow a precise explanation of the mechanism by which nitrogen fertilizer affects the intake of grazing animals. Nevertheless, such knowledge would be
* To whom all correspondence should be addressed. Email : boval!antilles.inra.fr
helpful for establishing a suitable fertilizer supply level, and also for developing alternative means to the addition of nitrogen fertilizer to generate greater intake at pasture.
Using equal herbage allowances, the effect of fertilizing an indigenous tropical sward based on
Dichanthiumspp., grazed by Creole heifers, on intake and on digestibility was investigated. The primary aim was to estimate the gain in intake and digestibility under fertilization, as these two parameters determine LW gain. A second objective was to determine any additional parameters involved in the improvement of gain.
M A T E R I A L S A N D M E T H O D S The experiment was carried out at the experimental station of the National Institute for Agricultural
Research (INRA) in the French West Indies,
Guadeloupe (16m 16h N, 61m 30h W). Average
temperatures ranged from 21–25mC to 27–31 mC. The
mean rainfall on the experimental site is 1000 mm a year.
Experimental design
Two levels of nitrogen fertilizer (0 and 50 kg\ha) were
applied to two plots of a sward based on Dichanthium spp. after 28 days re-growth. The plots were grazed by two groups of 4 tethered Creole heifers (12 months old and 208 kg LW), during three successive grazing
cycles, according to a 2i2 Latin Square design. Each
grazing cycle comprised two 4-day measurement periods, each following an 11-day adaptation period. The measurements were taken every 15 days. During the same grazing cycle, the heifers grazed alternately NF or F sward. They had a daily allowance of 18 kg of dry matter (DM).
Sward and animal management
Two plots were each divided into 28 subplots in early February. The subplots were all fertilized at the beginning of the experiment with 187 kg\ha of a 27–9–18 N–P–K fertilizer, in order to respect the annual management of this natural grassland. Every day from 24 February to 24 March, two subplots per plot were mown daily at ground level with a powered lawnmower equipped with a collection tray. After mowing, one of the mown subplots was fertilized (F) with 50 kg nitrogen per hectare as ammonium nitrate (NH% NO$) whereas the second was not (NF). In order to avoid limiting water conditions, a positive water balance was maintained by irrigating all the plots, in accordance with the evapo-transpiration estimated from data collected by an adjacent auto-matic meteorological station (CIMEL). On 24 March, the last two subplots F and NF were mown which subsequently, together with those mown first, had their 28 day re-growth grazed for the first time by the heifers for 24 h. The first grazing cycle then began. Afterwards the subplots were grazed successively every 28 days. The other grazing cycles lasted 28 days each.
The two groups of 4 heifers grazed two subplots NF or F daily. Each of the eight heifers had a defined circular area of herbage to graze, determined by the chain length and the herbage mass, measured pre-viously, and taking into account the heifer neck length. They were moved daily to fresh areas at 09.00 h and were watered individually at 13.00 h. Every 15 days, at the end of each period of measurement, the heifers were weighed at 09.00 h and were then treated against ticks by spraying. An anthelminthic treatment was applied once a month.
Sward characterization
The sward which the heifers were allowed to graze was characterized by physical and chemical para-meters. Swards were measured for each of the eight circular areas of herbage intended for daily grazing by the heifers, for 2 days per measurement period. Sward height was measured with a rising-plate meter (Michell 1982) at 10 sites per circular area. Herbage mass was estimated at the same sites, by cutting the herbage under the plate over an area of 0n03 m#, at ground level with hand-held electric clippers. Each of the 10 herbage samples cut was weighed fresh, and all of them were then pooled per circular area. Two subsamples of 300 g were kept, the first to determine dry matter (DM) and chemical composition, the second to determine morphological composition : stems, leaves and debris (including senescent and dead material) were sorted manually prior to drying. The structure of in situ tillers was described before grazing. Ten random tillers per circular area (0n14 to 0n28 tillers\m#) were identified with a coloured ring, and for each one, extended length, stem length and leaf length were measured with a sliding ruler. The cumulated leaf length per tiller was calculated by adding all the leaf lengths from the same tiller. Total herbage bulk density (kg OM\m$) before grazing, was calculated by dividing the total herbage mass (kg OM\m#) by the mean extended tiller length (m). Stem and leaf bulk densities were also calculated by dividing the stem and leaf masses by the mean extended tiller length.
Determining OM intake and OM digestibility
Organic matter intake per day (OMi, kg OM\day) was determined from total faecal OM output and OM
digestibility (Streeter 1969) : OMil faecal OM output
\(1kOM digestibility).
Faecal OM output per day (kg OM\day) was measured by manually collecting all faeces excreted by each heifer on the individual circular areas, over the 4-day measurement period. Faeces collection was facilitated by the high faecal DM content (184 g\kg faeces on average) and was carried out twice daily (07.00 h and 17.00 h) to reduce non-collection of faeces due to trampling. The amount of uncollected faeces was estimated to be 2 % of the total amount excreted (Boval et al. 1996 b). For each heifer, the entire amount of collected faeces over the 4-day measurement period was weighed and calculated per day. The faeces were then mixed and homogenized and a subsample of 500 g was taken to determine chemical composition.
OM digestibility (OMd) was estimated for each heifer from the crude protein content (CP, g\kg OM) of the faecal subsample taken, according to a local
equation established by Boval et al. (1996 a) with Creole steers fed on Dichanthium spp. herbage :
OMdl 0n983k4n002\CP
(R# l 0n84; .. l 2n53 10−#; .. l 37).
Digestible OMi (dOMi, g OM\kg LW!n(& per day)
was calculated by multiplying OMi, expressed by
metabolic LW kg (g OM\kg LW!n(& per day), by
OMd. Non digestible OMi (ndOMi, g OM\kg LW!n(&
per day) is equal to faecal output expressed per kg of metabolic LW.
Determining ingestive behavioural parameters
The feeding behavioural parameters were determined by visually observing the heifers for 24 h twice per measurement period. The observers recorded the current activity of each heifer every 10 min : grazing (head down, searching for or gripping herbage), ruminating or idling. When the activity was grazing, the observer counted the number of bites (by listening to the noise of the herbage pulled out) taken for
1 min, to determine the biting rate (BR, bites\min).
At night, heifers were observed with a flashlight. Grazing, ruminating and idling times (GT, RT and IT respectively) were calculated by multiplying the times of each activity recorded every 10 min, by 10. Bite size (BS, mg OM) was calculated by dividing OMi by the
total number of bites (l BRiGT). Intake rate (IR, g
OM\min) was calculated by multiplying biting rate
by bite size.
Determining chemical composition
Dry matter (DM) contents of both herbage and faeces samples were determined by drying at constant weight
at 60mC in a forced-draught oven over 48 h. The
samples were then ground (0n75 mm) prior to chemical
analysis. The OM content was measured after a 10 h
pyrolysis at 550mC. Neutral detergent fibre (NDF),
acid detergent fibre (ADF) and acid detergent lignin (ADL) were estimated following the methods of Van Soest et al. (1991). Nitrogen concentration was determined by the Kjeldahl method. Crude protein content was calculated by multiplying the nitrogen
content by 6n25.
Statistical analysis
Data were analysed according to a Latin Square design, with the GLM (General Linear Model) procedure of SAS (1989). Animal data and in situ tiller measurements were analysed according to the following model :
Yijkl mjFijGjjHkj(FG)ijjPl(Gj)jeijkl
where m is the mean, Fiis the fertilization effect (il
1, 2), Gjis the grazing cycle effect ( jl 1, 2, 3), Hkis
the heifer effect (kl 1 to 8), (FG)ij is the
fertilizationigrazing cycle interaction effect, Pl(Gj) is
the period effect (ll 1, 2) within each grazing cycle
and eijklis the residual term. The other herbage data
(sward height, herbage mass and morphological parameters) were analysed according to the same model, without the heifer effect.
The relationships between all the measured para-meters were first shown by calculating correlation coefficients by the COR procedure of SAS (1989). Regressions were then calculated by the REG pro-cedure using the MAXR (Maximum R# Improvement) method. This method tests each independent par-ameter with all the others, until the best n-parpar-ameter model (n fixed by user) is obtained, producing the highest R#. The dependent variables were corrected for the heifer effect. The residual distribution was analysed.
R E S U L T S
Effect of nitrogen fertilizer and grazing cycles on sward characteristics
Under nitrogen fertilizer, the herbage mass increased
by 1n6 t DM\ha, and the sward height was nearly
twice that of the NF sward (Table 1). Both stem and leaf masses increased with nitrogen fertilizer, but not to the same extent (186 v. 66 % respectively), and
consequently the leaf\stem ratio decreased. Debris
mass remained the same whatever the fertilizer level. The total and leaf bulk density values both decreased with fertilizer use (by 11 % and 14 % respectively), whereas the bulk density of the stems rose by 57 %. The fertilized tillers grew much longer than the unfertilized ones, with the extended tiller length increasing by 67 %. The stem and leaf lengths both increased but not to the same extent (by 133 % and 39 % respectively), whereas the leaf number per tiller remained the same for the F and the NF swards. The main chemical parameter modified by nitrogen fertilizer was the herbage CP content (40 % higher in the F sward).
Throughout the successive grazing cycles on the NF sward, the leaf mass, leaf length and also the number of leaves, increased respectively, by 113 %, 16 % and 21 % (Table 1). Leaf bulk density rose by 133 % and consequently total bulk density increased by 52 %. In the F sward, the grazing cycles had a significant effect on all the herbage characteristics, not only on the leaves as was the case for the NF sward. Canopy height as well as total, stem and leaf masses, increased sharply between the first and the third grazing cycle. All the morphological parameters were also significantly greater at the third grazing cycle than at the first.
Effect of nitrogen fertilizer and grazing cycles on intake, digestibility and ingestive behaviour On the F sward, the heifers ingested 9 % more OM and the herbage ingested was better digested by 6
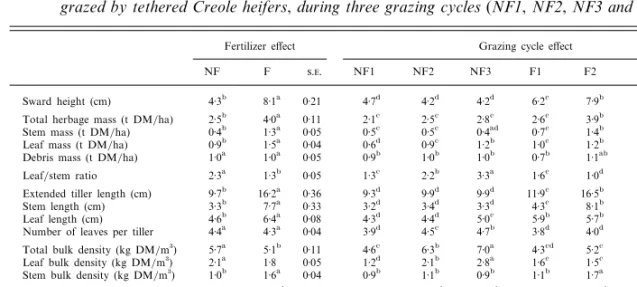
Table 1. Characteristics of unfertilized (NF ) and fertilized (F ) tropical Dichanthium spp. based swards, each
grazed by tethered Creole heifers, during three grazing cycles (NF1, NF2, NF3 and F1, F2, F3)
Fertilizer effect Grazing cycle effect
NF F .. NF1 NF2 NF3 F1 F2 F3 .. R.s.d. Sward height (cm) 4n3b 8n1a 0n21 4n7d 4n2d 4n2d 6n2c 7n9b 10n1a 0n36 1n02 Total herbage mass (t DM\ha) 2n5b 4n0a 0n11 2n1c 2n5c 2n8c 2n6c 3n9b 5n5a 0n19 0n55 Stem mass (t DM\ha) 0n4b 1n3a 0n05 0n5c 0n5c 0n4ad 0n7c 1n4b 1n7a 0n08 0n24 Leaf mass (t DM\ha) 0n9b 1n5a 0n04 0n6d 0n9c 1n2b 1n0c 1n2b 2n2a 0n07 0n19 Debris mass (t DM\ha) 1n0a 1n0a 0n05 0n9b 1n0b 1n0b 0n7b 1n1ab 1n3a 0n09 0n25 Leaf\stem ratio 2n3a 1n3b 0n05 1n3c 2n2b 3n3a 1n6c 1n0d 1n3c 0n09 0n25 Extended tiller length (cm) 9n7b 16n2a 0n36 9n3d 9n9d 9n9d 11n9c 16n5b 20n2a 0n62 1n75 Stem length (cm) 3n3b 7n7a 0n33 3n2d 3n4d 3n3d 4n3c 8n1b 10n8a 0n58 1n63 Leaf length (cm) 4n6b 6n4a 0n08 4n3d 4n4d 5n0c 5n9b 5n7b 7n4a 0n14 0n38 Number of leaves per tiller 4n4a 4n3a 0n04 3n9d 4n5c 4n7b 3n8d 4n0d 5n0a 0n08 0n21 Total bulk density (kg DM\m$) 5n7a 5n1b 0n11 4n6c 6n3b 7n0a 4n3cd 5n2c 5n9b 0n18 0n52 Leaf bulk density (kg DM\m$) 2n1a 1n8 0n05 1n2d 2n1b 2n8a 1n6c 1n5c 2n1b 0n08 0n21 Stem bulk density (kg DM\m$) 1n0b 1n6a 0n04 0n9b 1n1b 0n9b 1n1b 1n7a 1n7a 0n07 0n22 DM 0n32a 0n27b 0n005 0n38a 0n28b 0n30b 0n35a 0n24b 0n24b 0n008 0n024 OM (g\kg DM) 887a 865b 2n4 881a 869ab 844c 889a 892a 881ab 4n2 12n2 CP (g\kg OM) 73b 102a 1n2 74ab 69b 78a 99a 104a 103a 2n1 5n8 NDF (g\kg OM) 708b 722a 2n9 716bc 723b 684d 706c 742a 718bc 5n0 14n2 ADF (g\kg OM) 351b 357a 2n1 368ab 360b 326d 359b 374a 339c 3n6 10n3 ADL (g\kg OM) 75a 71a 1n7 73ab 80a 72ab 66bc 81a 66bc 3n0 8n4
Values with different superscripts within fertilizer levels or grazing cycles are significantly different (P 0n05). R.s.d. : Root Mean Squared Error ;..: standard error.
Table 2. Herbage allowances, OM intake, OM digestibility and ingestive behaviour parameters (Biting rate, Bite
size, Intake rate, Grazing, Ruminating and Idling times) for tethered Creole heifers grazing unfertilized (NF ) or
fertilized(F ) tropical Dichanthium spp. based swards, during three grazing cycles (NF, NF2, NF3 and F1,
F2, F3)
Fertilizer effect Grazing cycle effect
NF F .. NF1 NF2 NF3 F1 F2 F3 .. R.s.d. Allowance (g OM\kg LW!n(& per day) 342a 351a 10n4 297c 343b 386a 287c 389a 377ab 18n1 3n5 OM intake (g\kg LW!n(& per day) 76n6b 83n6a 1n53 75n1b 77n1b 77n6b 81n7ab 89n1a 80n1b 2n65 7n50 OM digestibility 0n64b 0n70a 0n002 0n62f 0n63e 0n67d 0n68c 0n70b 0n73a 0n004 0n012 dOMi (g\kg LW!n(& per day) 49n3b 59n5a 1n11 46n6bc 48n8bc 51n5b 55n8ab 62n0a 58n3a 1n93 5n46 ndOMi (g\kg LW!n(& per day) 27n6a 24n9b 0n48 28n6a 28n3a 26n1ab 25n9b 27n1ab 21n9c 0n84 2n37 Biting rate (bites\min) 54a 50b 0n6 54b 55b 58a 53bc 51cd 49d 1n1 3n2 Bite size (mg OM) 186b 267a 6n2 205c 172d 181cd 247b 280a 276ab 10n7 30n4 Intake rate (g OM\min) 10b 13a 0n3 10n9b 9n2c 10n0bc 12n8a 13n8a 12n8a 0n5 1n5 Grazing time (min) 431a 362b 6n0 378b 463a 452a 351b 367b 368b 10n4 29n5 Ruminating time (min) 129a 179a 5n7 189b 101d 98d 219a 160c 157c 9n8 27n8 Idling time (min) 213b 233a 6n8 233a 197b 208ab 232a 233a 233a 11n8 33n4
Values with different superscripts within fertilizer levels or grazing cycles are significantly different (P 0n05).
dOMi, digestible OM intake ; ndOMi, non digestible OM intake ; R.s.d., Root Mean Squared Error ;.., standard error.
digestibility units than on the NF sward (Table 2). On the F sward the heifers grazed with a lower biting rate and for a shorter time than on the NF sward. Bite size and intake rate were both higher on the F sward.
From the first to the last grazing cycle, with both the NF and the F swards, digestibility increased by 5 digestibility units whereas intake did not vary (Table 2). On the F sward, the biting rate decreased whereas the grazing time did not vary between the
grazing cycles. On the NF sward, both the biting rate and the grazing time increased (Table 2) from the first to the third grazing cycle.
Analysis of determining parameters for intake,
digestibility and ingestive behaviour
Table 3 a. Correlation coefficients between OM intake (OMi ), OM digestibility (OMd ), Biting rate (BR,
bites\min), Bite size (BS, mg OM), Intake rate (g OM\min), Grazing time (GT, min) and Ruminating time (RT,
min) and sward characteristics, whatever the fertilization level, for tethered Creole heifers grazing tropical
Dichanthium spp. based swards
OMi OMd BR BS IR GT RT
Sward height (cm) 0n24ns 0n70*** k0n71*** 0n70*** 0n39** k0n30* 0n26ns
Total mass (t DM\ha) 0n29* 0n73*** k0n60*** 0n61*** 0n33** k0n18ns 0n05ns
Stem mass (t DM\ha) 0n33* 0n74*** k0n61*** 0n72*** 0n46*** k0n31* 0n11ns
Leaf mass (t DM\ha) 0n21ns 0n77*** k0n51*** 0n51*** 0n27ns k0n16ns k0n03ns
Debris mass (t DM\ha) 0n23ns 0n24ns k0n48*** 0n27* 0n01ns 0n17ns 0n14ns
Leaf\stem ratio k0n16ns k0n25ns 0n40** k0n58*** k0n48*** 0n48*** k0n40** Extended tiller length (cm) 0n26ns 0n70*** k0n66*** 0n69*** 0n40** k0n28* 0n14ns
Stem length (cm) 0n24ns 0n65*** k0n65*** 0n68*** 0n39** k0n28* 0n07ns
Mean leaf length (cm) 0n28ns 0n75*** k0n59*** 0n63*** 0n38** k0n26ns 0n31*
Number of leaf per tiller 0n04ns 0n40** k0n27ns 0n04ns k0n15ns 0n24ns k0n33*
Total bulk density (kg DM\m$) 0n15ns k0n04ns 0n41** k0n35* k0n22ns 0n44** k0n53*** Leaf bulk density (kg DM\m$) 0n08ns 0n15ns 0n33* k0n27ns k0n17ns 0n33* k0n51***
Stem bulk density (kg DM\m$) 0n37** 0n64*** k0n28ns 0n61*** 0n54*** k0n30* k0n04ns
CP (g\kg OM) 0n43** 0n75*** k0n25ns 0n79*** 0n77*** k0n61*** 0n03ns
NDF (g\kg OM) k0n05ns 0n17ns k0n60*** 0n29* 0n02ns k0n10ns 0n20ns
ADF (g\kg OM) k0n01ns k0n21ns k0n32* 0n12ns k0n01ns k0n03ns 0n45** ADL (g\kg OM) 0n18ns k0n29* 0n05ns k0n21ns k0n23ns 0n43** 0n05ns
ns, non significant ; *, **, *** : significantly correlated (P 0n01, 0n001, 0n0001 respectively).
Table 3 b. Correlation coefficients between OM intake (OMi, g\kg LW!n(&), OM digestibility (OMd), digestible
OM intake(dOMi, g\kg LW!n(&), non digestible OM intake (ndOMi, g\kg LW!n(&), Biting rate (BR, bites\min),
Bite size(BS, mg OM ), Intake rate (g OM\min), Grazing time (GT, min) and Ruminating time (RT, min) for
tethered Creole heifers grazing tropicalDichanthium spp. based swards, whatever the fertilization level
OMi OMd dOMi ndOMi BR BS IR GT RT
OMd 0n21ns dOMi 0n92*** 0n58*** ndOMi 0n61** k0n64*** 0n24ns BR 0n19ns k0n48*** k0n04ns 0n54*** BS 0n52*** 0n67*** 0n71*** k0n14ns k0n49*** IR 0n70*** 0n48*** 0n79*** 0n14ns k0n03ns 0n88*** GT k0n15ns k0n30* k0n25ns 0n14ns 0n11ns k0n67*** k0n73*** RT 0n15ns 0n02ns 0n14ns 0n07ns k0n32* 0n19ns 0n09ns k0n12ns
ns, non significant ; *, **, *** : significantly correlated (P 0n01, 0n001, 0n0001 respectively).
correlated with the herbage CP content and stem bulk density (Table 3 a). OMi was not correlated with OMd, even if these two variables are linked by calculation (Table 3 b), but was correlated to dOMi and ndOMi. The dOMi increased with OMi on F or NF sward with a slope of 0n75, whereas ndOMi increased slowly, keeping close to an average value of
26n3 g OM\kg LW!n(&, whatever the F or NF treatment
(Fig. 1). Intake was also correlated with bite size and intake rate (Table 3 b) but these correlations are also arguable, as the parameters concerned are linked by calculation. Considering the predictive regressions
(Table 4), sward characteristics and even herbage CP content accounted for little of OMi (Table 4), explaining only 16 % of OMi variance.
OMd was well correlated with several sward characteristics with correlation coefficients in the range 0n70–0n77: leaf mass and leaf length, CP content, stem mass and sward height or extended tiller length (Table 3 a). With respect to ingestive behavioural parameters, OMd was negatively correlated with biting rate and grazing time (Table 3 a). It was positively correlated with bite size and intake rate but, as already pointed out for OMi, these parameters are
80 70 60 50 40 30 20 10 0 50 60 70 80 90 100 110 OMi (g MO/kg LW0·75) (g OM/kg L W 0·75 )
Fig. 1. Evolution of non digestible OM intake (ndOMi) and digestible OM intake (dOMi) with total OM ingested (OMi) in fertilized (F) or unfertilized (NF) Dichanthium spp. based sward. >, domi-F; =, domi-NF; $, ndOMi-F; #, ndOMi-NF.
Table 4. Predictive regressions of OM intake (OMi, g\kg LW!n(&), OM digestibility (OMd), Biting rate (BR,
bites\min), Bite size (BS, mg OM), Intake rate (g OM\min), Grazing time (GT, min) and Ruminating time (RT,
min), from characteristics of tropical Dichanthium spp. based swards grazed by tethered Creole heifers
Equations Percentage variance explained (R#) Residual standard deviation (R.s.d) Error degrees of freedom (..) Mean OMil 47n11j49n18 OMd 0n02 9n43 46 80n1 OMil 58n3j2n48 Herbage CP 0n16 8n71 46 OMil 41n11j1n48 ndOMi 0n37 7n64 46 OMil k2n3j1n9 ndOMij3n69 CP 0n74 4n86 45
OMdl 0n56j0n023 Sward heightk0n0008 Sward height# 0n51 0n028 45 0n67 OMdl 0n59j0n018 Stem lengthk0n0006 Stem length# 0n51 0n028 45
OMdl 0n51j0n017 Ext. tiller lengthk0n0003 Ext. tiller length# 0n57 0n026 45 OMdl 0n34j0n070 Ln (Leaf mass) 0n63 0n025 46 OMdl 0n52j0n00037 Leaf massj0n012 Herbage CP 0n76 0n019 45
BRl 60n75k1n44 Sward height 0n51 3n92 46 52
BRl 112n6k1n108 Sward heightk0n754 Herbage NDF 0n57 3n62 45
BSl 96n5j547n22 Stem fraction 0n58 35n1 46 226
BSl 96n51j386n75 Stem fractionj6n15 Sward height 0n62 33n4 45
BSl k2n35j26n07 Herbage CP 0n63 32n9 46
BSl 11n65j19n30 Herbage CPj7n34 Sward height 0n73 28n6 45
IRl 6n8j20n19 Stem fraction 0n39 1n86 46 11n6
IRl 1n78j1n12 Herbage CP 0n59 1n54 46
IRl 3n89j1n18 Herbage CPk7n40 Leaf fraction 0n61 1n48 45
GTl 283n4j63n9 Debris bulk density 0n38 51n4 46 396 GTl 485n9j7n9 Total bulk densityk21n3 Herbage CP 0n44 48n9 45
RTl 355n9k37n34 Total bulk density 0n26 68n4 46 154 RTl 176n7k28n9 Total bulk densityk451 Herbage DM 0n38 62n6 45
0·80 0·75 0·70 0·65 0·60 0·55 0 50 100 150 200 250 300 350
Leaf mass (t DM/ha)
OM digestibility OMd = 0·34 + 0·070 ln (x) R2 = 0·63, R.s.d = 0·025 0·80 0·75 0·70 0·65 0·60 0·55 0·50 3·0 3·5 4·0 4·5 5·0 5·5 6·0
Number of leaves per tiller
OM digestibility OMd = 0·425 + 0·097 x – 0·007 x2 R2 = 0·72, R.s.d = 1·8 OMd = 1·020 – 0·223 x – 0·031 x2 R2 = 0·51, R.s.d = 2·9 (a) (b)
Fig. 2. (a). Effect of leaf mass on in vivo OM digestibility (OMd) measured on fertilized (F,) or unfertilized sward (NF, )
Dichanthiumspp. based swards. (b) Effect of the number of leaves per tiller on in vivo OM digestibility (OMd) on fertilized (F,) and unfertilized (NF, ) Dichanthium spp. based swards.
linked to OMd by calculation. The predictive re-gression analysis shows that leaf mass was the main determining parameter for OMd. Indeed leaf mass alone explained 63 % of OMd variance (Table 4, Fig. 2 a) and, combined with the CP content, R# went up
to 76 % (Table 4). Stem length and sward height predicted OMd equally and the prediction was slightly better on the basis of extended tiller length. Con-sidering F sward data separately, the number of leaves appeared to be the parameter which is best
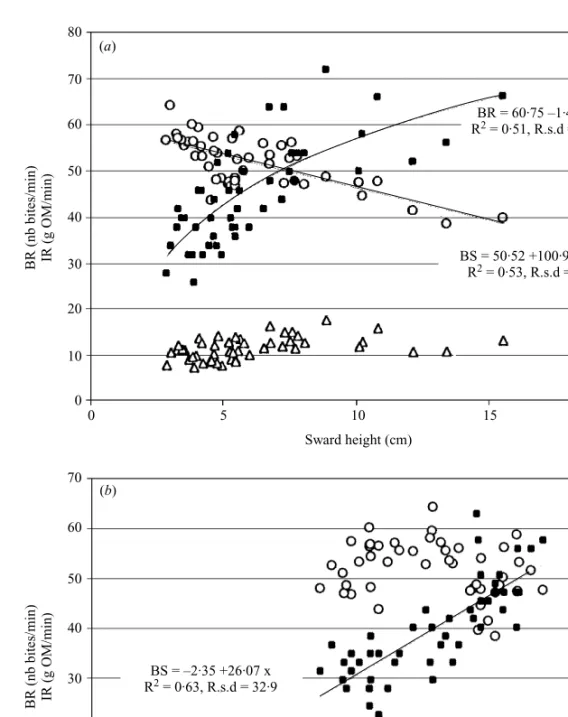
80 70 60 50 40 30 20 10 0 0 5 10 15 20 Sward height (cm) 400 350 300 250 200 150 100 50 0
BR (nb bites/min) IR (g OM/min) BS (mg OM/bite)
(a) 70 60 50 40 30 20 10 0 0 2 4 6 8 10 12 14 0 50 100 150 200 250 300 350 400 BR = 60·75 –1·44 x R2 = 0·51, R.s.d = 3·9 BS = 50·52 +100·98 ln(x) R2 = 0·53, R.s.d = 37·0
BR (nb bites/min) IR (g OM/min) BS (mg OM/bite)
Herbage CP content (% DM) BS = –2·35 +26·07 x R2 = 0·63, R.s.d = 32·9 IR = 1·78 +1·12 x R2 = 0·59, R.s.d = 1·5 (b)
Fig. 3. (a). Evolution of biting rate (BR,#), intake rate (IR, =) and bite size (BS, ) with sward height of a Dichanthium spp. based sward, with or without fertilization, (b) with CP content of a Dichanthium spp. based sward, with or without fertilization.
correlated with OMd (Fig. 2 b ). This relationship was also significant in the NF sward.
The feeding behavioural parameters such as biting rate, bite size and intake rate were better correlated
with sward characteristics than with grazing,
ruminating or idling times. Biting rate was well
correlated with, and predicted by sward height (Tables 3 a and 4, Fig. 3 a). Bite size and intake rate were first correlated with CP content (Fig. 3 b), and to a lesser extent with stem fraction. Grazing and ruminating times were both predicted mainly by total bulk density.
D I S C U S S I O N
Effect of nitrogen fertilizer and successive grazing cycles onDichanthium spp. characteristics The rise in herbage mass induced by the addition of nitrogen fertilizer was consistent with other reports, from 19 kg DM per additional kg N for Digitaria
decumbens (Ethredge et al. 1973 ; Blunt & Haydock 1977) to 29n7 kg DM\kg N for Cynodon dactylon (Crespo 1984), two stoloniferous tropical grasses as are also Dichanthium spp. The higher CP content due to nitrogen fertilizer has also been reported in other tropical studies (Minson 1973 ; Monson & Burton 1982), whereas the rise we measured was greater, probably because of measurement conditions at pasture.
The rise in herbage mass and CP content under nitrogen fertilizer, is classically explained by leaf elongation and consequently a rise in leaf mass and leaf area index, for tillering grass species. These morphological modifications have been reported for temperate (Mazzanti et al. 1994) and tropical (Pinto
et al. 1994) tillering grass species. In our experiment, the nitrogen effect on the Dichanthium spp. sward appeared mainly on the stems, which grew much longer than the leaves, with the leaf\stem ratio decreasing. This has previously been reported for
Dichanthium aristatum(Schemoul 1988 ; Cruz & Boval 2000), Digitaria decumbens (Cruz et al. 1989) and
Cynodon dactylon (Overman & Wilkinson 1989). Although to a lesser extent than the stems, the leaves also elongated and the greater leaf mass that followed helped to increase the CP content and the herbage quality. Moreover, it is possible that the addition of fertilizer doubled leaf density at the top of the sward compared to the lower layers, as shown by Stobbs (1973 b, 1975) and Hendricksen & Minson (1985), easing thereby the accessibility of leaves for grazing animals.
It is generally considered that stem elongation causes a fall in the quality of the herbage offered, but
this undoubtedly proves to be invalid under
fertilization. The young elongated stems caused by fertilizer may be similar in digestibility to the leaves (Haggar & Ahmed 1970) and they do have less tensile strength than unfertilized stems (Flores et al. 1993). Furthermore, whereas the total herbage bulk density declined with the elongation of the stems under fertilizer, it remained higher than the threshold value of 100 kg DM\ha per cm, usually reported for tropical swards (Stobbs 1973 a), which does not limit the bite size of grazing animals (Humphreys 1991). In such conditions the fertilized elongated stems may help grazing animals to get a good grip on high quality herbage.
Throughout the successive grazing cycles, a higher number of living leaves per plant, which were also much longer, was observed. This effect was measured
on the NF sward as well on the F sward. Moreover, on the F sward all the other sward parameters varied, owing to the accumulation of nitrogen fertilizer from one application to another, combined with the effect of successive grazing cycles (Mears & Humphreys 1974). The higher leaf number may be explained by the successive frequent defoliation which can generate the production of shorter leaves and sheaths than with infrequent cutting, according to Davies (1977).
In the current study some typical effects of nitrogen fertilization, such as the rise in herbage mass, CP content and leaf elongation, were demonstrated for a grazed Dichanthium spp. based sward. However, the fertilizer effect on stem elongation is more specific to tropical stoloniferous grasses. In other tropical studies, the leaf expansion rate measured throughout the successive grazing cycles was not reported either. In fact there is a lack of characterization of various morphological tropical grasses at pasture (Hacker & Evans 1992 ; Cruz & Boval 2000).
Nitrogen fertilizer effect on intake and digestibility
At a fixed daily herbage allowance, intake and digestibility were higher for the fertilized sward, resulting in a rise in digestible OM intake (dOMi) by 20n6%. Minson (1973) with tropical Chloris gayana and Delagarde et al. (1997) with temperate perennial ryegrass, reported dOMi rises of 21 and 25n6%, from fertilizing respectively with 125 to 500 kg N\ha at 28 days of re-growth and from 0 to 60 kg N\ha at 32 days of re-growth. The 20n6% increase in dOMi is consistent with the LW gain during the experiment, for the NF and F swards (respectively 230 and 462 g\day), although it was measured over short periods. The energy input is sufficient to meet
maintenance requirements (0n044UF\kg LW!n(&,
Ve! rite! et al. 1987), and the growth energy for a
potential daily LW gain of 200 g and 425 g respectively for the NF and F swards. Taking into account the amount of fertilizer added, the LW gain from the NF to the F sward is equivalent to 1n47 kg LW\ha per additional kg of fertilizer. This value is close to values reported in other studies, from 1n3 to 4n7 kg LW\ha per year and per additional kg of nitrogen fertilizer (Mears & Humphreys 1974 ; Jones 1990). However, in those studies, the stocking rate was not adjusted with regard to the fertilizer level, and the LW gain recorded is generally explained by a rising herbage allowance. The fertilizer effect measured seems in accordance with other studies, but the explanatory parameters may differ. Firstly, greater herbage allowance due to nitrogen fertilizer could not be invoked in the current experiment. On the other hand, the herbage CP rise from the NF to the F sward contributed to the increase in OMi. In the NF sward the herbage CP content is close to the limiting value reported for nitrogen deficiency in the rumen (Minson 1990).
According to Ve! rite! et al. (1987) 126 to 135 g of CP is required to digest 1 kg of digestible OMi (dOMi), whereas for the NF sward, the amount of CP was 115 g. Consequently, under fertilization, the increase in herbage CP content may compensate for a CP deficiency, facilitating the cellulolytic activity in the
rumen (Archime' de et al. 1999) of the grazing heifers.
However, the herbage CP rise accounts only for 16 % of the OMi variance, and the rumen load could be the other main determining parameter for OMi in our experiment (Fig. 1). Ruminants are able to ingest a constant amount of nondigestible OM (ndOMi), irrespective of the total amount consumed and which is representative of the rumen load (Lehman 1941, quoted by Jarrige 1989). Whatever F or NF swards, ndOMi varied slightly with intake, keeping close to
26n3 g OM\kg LW!n(&. However on the F sward,
ndOMi represented 29 % of the total intake whereas it represented 36 % on the NF sward (Fig. 1). So on the F sward, the amount of ndOMi was reached when a greater amount of digestible OM was ingested (dOMi) and consequently for a greater total intake, compared to the unfertilized sward. Such ndOMi values, have already been measured in previous experiments (Boval et al. 1996 b ; Boval et al. 2000) and in other tropical environments, as reviewed by Kennedy (1995) for cattle and buffaloes. This needs to be checked in further experiments, in which rumen load is measured.
Intake was influenced by neither of the physical sward characteristics, whereas the latter influenced the ingestive behaviour of the heifers. Indeed sward height determines biting rate and bite size as already reported for cattle (Laca et al. 1992) and sheep (Black & Kenney 1984 ; Burlinson et al. 1991). Stem fraction and herbage CP content also influenced bite size and intake rate. However, the other behavioural parameters, grazing and ruminating times for in-stance, were modified to a lesser extent by sward characteristics, except a little by herbage bulk density. It is possible that sward characteristics affect in-gestive behaviour instantaneously, in the short-term, via parameters such as biting rate, bite size or intake rate. However on a daily basis there is compensation (Allden & Whittaker 1970 ; Jamieson & Hodgson 1979) between short-term parameters and this com-pensation may contribute to the maintenance of equal daily grazing and ruminating times. Indeed the non-limiting amount of fresh herbage allowed daily, may have helped the heifers to adapt their behaviour to satisfy their appetite and energy requirements. This probably also explains why OMi, resulting from many bites during the day, is not affected by sward char-acteristics such as short-term ingestive behavioural parameters. Thereafter, if the addition of nitrogen fertilizer influences both OMi and ingestive be-havioural parameters, it does not occur in the same way and this implies the choice of the appropriate
parameters to understand grazing animal nutrition on a daily basis.
Conversely, the increase in OM digestibility in the F sward is mainly explainable by physical sward structure. Leaf mass accounts for the best OMd gain which is better still when combined with CP content. Sward characteristics such as sward height and extended tiller length also explain the OMd rise under fertilizer quite well. Thus, even if nitrogen fertilizer elongated the stems more than the leaves, the stems produced did not constitute a limit for gripping high quality herbage, as is often reported for tropical herbage (Stobbs 1973 b ; Hendricksen & Minson 1980). There are a few references to the effect of sward characteristics on OMd, which was mostly estimated
in vitro. However, Forbes & Coleman (1993) reported a significant effect of the leaf fraction of warm-season
Bothrichloaspp. on OMd. Irrespective of leaf mass and CP content effects, the number of living leaves also determined OMd, inducing a 5 unit gain (Fig. 2 b ), whatever the fertilizer level on the sward. This 5 unit gain is close to the 6 unit gain measured as the fertilizer effect. This was unexpected and suggests that for the same leaf mass, shorter but more numerous leaves may be better than a few long leaves in improving the digestibility of the herbage consumed at pasture. Indeed Duru et al. (1999) reported that shorter leaves are more digestible than longer ones, because the time required for elongation is shorter and the leaves are less mature. It is worth noting that OMd as well as ingestive behavioural parameters are influenced by sward characteristics, whereas OMi is not. The relationship between sward characteristics, some ingestive behavioural parameters and OMd, can be explained by the fact that low quality individual bites have a higher influence on OMd than on OMi. OMi is indeed the resultant of many small amounts of herbage consumed per bite, throughout the day, and a given daily OMi can be reached by increasing either bite size, biting rate or grazing time (Allden & Whittaker 1970 ; Hodgson 1982). In return, if many low quality bites are achieved by grazing animals, this induces an irremediable drop in OMd, which is difficult to compensate.
C O N C L U S I O N S
Nitrogen fertilizer induced a rise in herbage mass, by way of a considerable stem and leaf elongation and a rise in herbage CP content. Having equal herbage allowances the heifers ingest 9 % more OM, which is more digestible by 5 digestibility units, on the fertilized sward. The rise in OMi is just partly explainable by the rise in herbage CP content. In other respects, the stability of ndOMi regardless of nitrogen level, suggests a determining effect of rumen load on OMi, although the latter was not measured. In contrast to OMi, the gain in OMd is firstly
explainable by physical sward characteristics such as leaf mass. The length of the fertilized stems and the subsequent sward height also help to increase OMd, probably by making the leaves easier to grip. Ingestive behaviour is closer to OMd than OMi. This suggests that studies at pasture which take into account just ingestive behaviour to indicate intake are not reliable. Thus nitrogen fertilizer causes a significant im-provement in digestible intake at pasture, by inducing a leafy sward with a greater young stem mass and a greater herbage CP content, irrespective of herbage allowance. This indicates that the structure of the
R E F E R E N C E S
A, W. G. & W, I. A. MD. (1970). The determinants of herbage intake by grazing sheep : the interrelationships of factors influencing herbage intake and availability. Australian Journal of Agricultural
Re-search 21, 755–766.
A, H., A, G., S, G., D, E., D, P. & X, A. (1999). Effects of urea and saccharose on intake and digestion of a Digitaria
decumbenshay by black belly sheep. Animal Science 69, 403–410.
B, J . L. & K, P. A. (1984). Factors affecting diet selection by sheep. Grass and Forage Science 35, 565–578. B, C. G. & H, K. P. (1978). Effect of irrigation, nitrogen and defoliation on Pangola grass in the dry season at the Ord Valley, north-western Australia.
Australian Journal of Experimental Agriculture and Animal Husbandry 18, 825–833.
B, M., P, J . L., X, A., A, G., C, O. & S, G. (1996a). Evaluation of faecal indicators to predict digestibility and voluntary intake of
Dichanthium spp. by cattle. Annales de Zootechnie 45, 121–134.
B, M., P, J . L. & X, A. (1996b). Effect of nocturnal enclosing and splitting offered area on herbage intake of tethered creole heifers. Annales de Zootechnie 45, 219–231.
B, M., C, P., P, J . L. & P, P. (2000). Herbage allowance effect on intake of Creole heifers tethered at pasture. Grass and Forage Science 55, 201–208.
B, A. J ., H, J . & I, A. W. (1991). Sward canopy structure and the bite dimensions and bite weight of grazing sheep. Grass and Forage Science 46, 29–38. C, G. (1984). Variation in the response of tropical
pastures to nitrogenous fertilizers througout the year. 1. Pangola grass (Digitaria decumbens Stent) without ir-rigation. Cuban Journal of Agricultural Science 18, 63–73. C, P. & B, M. (2000). Effect of nitrogen on some morphogenetical traits of temperate and tropical perennial forage grasses. In Grassland Ecophysiology and Grazing
Ecology (Eds G. Lemaire, J. Hodgson, A. de Moraes, C. Nabinger & P. C. de F. Carvalho), pp. 151–167. Wallingford : CAB.
C, P., A, G. & B, H. (1989). Cine!tique de croissance foliaire et stolonife' re d’un peuplement de
Digitaria decumbens au cour de la repousse. In
Pro-ceedings of the XVI International Grassland Congress,
sward has to be considered with the chemical components, to investigate ruminant nutrition at pasture. Knowledge of the effects of nitrogen fertilizer on animal nutrition via the morphological modifi-cations of the herbage, allows better definition of suitable management for promoting nutrition at pasture. In that sense, knowledge provided by agronomists on morphological responses of tropical grass under various conditions, may be helpful.
We thank A. Nepaut and P. Mulciba for their great technical participation.
Volume I. (Ed. Desroche), pp. 499–500. Nice : The French Grassland Society.
D, A. (1977) Structure of the grass sward. In
Pro-ceedings of the International Meeting on Animal Production,
from Temperate Grasslands(Dublin, Ireland), pp 36–44. D, R., P, J . L. & D, L. (1997). The
effect of nitrogen fertilization level and protein sup-plementation on herbage intake, feeding behaviour and digestion in grazing dairy cows. Animal Feed Science and
Technology 66, 165–180.
D, M., D, H. & F, E. (1999). In vitro digestibility response of cocksfoot (Dactylis glomerata L.) to growth and defoliation : a simple model. Journal of
Agricultural Science, Cambridge 133, 379–388.
E, J ., B, E. R. & L, R. M. (1973). Effects of clipping height, clipping frequency, and rates of nitrogen on yield and energy content of Coastal Bermuda-grass. Agronomy Journal 65, 717–719.
F, E. R., L, E. A., G, T. C. & D, M. W. (1993). Sward height and vertical morphological differentiation determine cattle bite dimensions. Agronomy
Journal 85, 527–532.
F, T. D. A. & C, S. W. (1993). Forage intake and ingestive behaviour of cattle grazing Old World Bluestems. Agronomy Journal 85, 808–816.
H, J . B. & E, T. R. (1992). An evaluation of the production potential of six tropical grasses under grazing. 1. Yield and yield components, growth rates and phe-nology. Australian Journal of Experimental Agriculture 32, 19–27.
H, R. J . & A, M. B. (1970). Seasonal production of Andropogon gayanus. 2. Seasonal changes in digestibility and feed intake. Journal of Agricultural Science, Cambridge
75, 369–373.
H, R. E. & M, D. J. (1985). The voluntary intake, digestibility and retention time by cattle and sheep of stem and leaf fractions of a tropical legume (Lablab
purpureum). Australian Journal of Experimental
Agri-culture 32, 389–398.
H, R. E. & M, D. J. (1980). The feed intake and grazing behaviour of cattle grazing a crop of
Lablab purpureus cv. Rongai. Journal of Agricultural
Science, Cambridge 95, 547–554.
H, J. (1982). Influence of sward characteristics on diet selection and herbage intake by the grazing animal. In
Nutritional Limits to Animal Production from Pastures
(Ed. J. B. Hacker), pp. 153–166. Farnham Royal : Com-monwealth Agricultural Bureaux.
H, L. R. (1991). Tropical Pasture Utilisation. Cambridge : Cambridge University Press.
J, W. S. & H, J. (1979). The effect of daily herbage allowance and sward characteristics upon the ingestive behaviour and herbage intake of calves under strip-grazing management. Grass and Forage Science 34, 261–271.
J, R. (1989). Recommended Allowances and Feed
Tables(Ed. R. Jarrige). Paris : INRA.
J, R. J. (1990). Nitrogen rate and stocking rate effects on steer gains from grazed irrigated pangola grass in the Ord Valley, Western Australia. Australian Journal of
Experimental Agriculture 30, 599–605.
K, P. M. (1995) Comparative adaptability of herbivores to tropical environments. In Proceedings of the
IVth Symposium on the Nutrition of Herbivores (Eds M. Journet, E. Grenet, M.-H. Farce, M. Theriez & C. Demarquilly), pp. 309–328. Paris : INRA.
L, E. A., U, E. D., S, N. G. & D, M. W. (1992). Effects of sward height and bulk density on bite dimensions of cattle grazing homogeneous swards.
Grass and Forage Science 47, 91–102.
M, A., L, G. & G, F. (1994). The effect of nitrogen fertilization upon the herbage production of tall fescue swards continuously grazed with sheep. 1. Herbage growth dynamics. Grass and Forage Science 49, 111–120.
M, P. T. & H, L. R. (1974). Nitrogen response and stocking rate of Pennisetum clandestinum pastures. 2. Cattle growth. Journal of Agricultural Science, Cambridge
83, 469–478.
M, P. (1982). Value of rising-plate meter for estimating herbage mass of grazed perennial ryegrass-white clover swards. Grass and Forage Science 37, 81–87.
M, D. J. (1973). Effect of fertiliser nitrogen on digestibility and voluntary intake of Chloris gayana
digitaria decumbens and Pennisetum clandestinum.
Australian Journal of Experimental Agriculture and Animal Husbandry 13, 153–157.
M, D. J. (1990) In Forage in Ruminant Nutrition (Ed. D. J. Minson). San Diego : Academic Press.
M, W. G. & B, G. W. (1982). Harvest frequency and fertilizer effects on yield, quality, and persistence of eight Bermudagrasses. Agronomy Journal 74, 371–374. O, A. R. & W, S. R. (1989). Partitioning of
dry matter between leaf and stem in Coastal Bermuda-grass. Agricultural Systems 30, 35–47.
P, J . C., G, J . A., M, M. & L, N. F. (1994). Crescimento de folhas de gramineas forrageiras tropicales, cultivadas en vasos, com duas doses de nitrogenio. Revista da Sociedade Brasileire de Zooteccnia
23, 327–332.
SAS (1989) SAS\STAT User’s guide, Version 6, Fourth
Edition, volume 2. Cary, NC : SAS Institute Inc. S, E. (1988). Productivite! primaire et morphoge!ne'se
d’un peuplement de Petit Foin (Dichanthium spp. Will) en Guadeloupe. Me! moire DAA, ENSA Montpellier. S, T. H. (1973a). The effect of plant structure on the
intake of tropical pastures. I. Variation in the bite size of grazing cattle. Australian Journal of Agricultural Research
24, 809–819.
S, T. H. (1973b). The effect of plant structure on the intake of tropical pastures. II. Difference in sward structure, nutritive value, and bite size of animals grazing
Setaria ancepsand Chloris gayana at various stages of growth. Australian Journal of Agricultural Research 24, 821–829.
S, T. H. (1975). The effect of plant structure on the intake of tropical pastures. 3. Influence of fertiliser nitrogen on the bite size harvested by Jersey cows grazing
Setaria ancepsCV. Kazungula swards. Australian Journal
of Agricultural Research 26, 997–1007.
S, C. L. (1969). A review of techniques used to estimate in vivo digestibility of grazed forage. Journal of
Animal Science 29, 757–768.
T, J . M. A. & T, R. A. (1963). A two stages technique for in vitro digestion of forage crops. Journal of
the British Grassland Society 18, 104–111.
V S, P. J ., R, J . B. & L, B. A. (1991). Methods for dietary fibre, neutral detergent fibre and non starch polysaccharides in relation to animal nutrition.
Journal of Dairy Science 74, 3583–3597.
V!!, R., M-D, B., C, P., P, J . L. & P, C. (1987). Re!vision du syste'me des prote! ines digestibles dans l’intestin (P.D.I). Bulletin