Economic Feasibility of a Fast Car-Ferry Service
by
Javier Saez Ramirez Naval Architect,
Escuela Tecnica Superior de Ingenieros Navales, Madrid, Spain, 1997
Submitted to the Department of Ocean Engineering In Partial Fulfillment of the Requirements for the
Degree of
Master of Science in Ocean Systems Management at the
Massachusetts Institute of Technology June 1998
@ Javier Saez Ramirez, 1998. All Rights Reserved
The author hereby grants to MIT permission to reproduce and to distribute publicly paper and electronic copies
of this thesis document in whole or in part
Signature of the Author
Department of Ocean Engineering May 1998
Certified by /7 '-'--y
-S
,
cHenry S. Marcus
Professor of Marine Systems Chairman, Ocean Systems Management Program
Accepted by
MASSACHUSETTS INSTITUTE Chai OF TECHNOLOGY
OCT 2 3 1998
LIBRARIES
J. Kim Vandiver Professor of Ocean Engineering rman, Ocean Engineering Departmental Graduate Committee
Economic Feasibility of a Fast Car-Ferry Service
by
Javier Saez Ramirez
Submitted to the Department of Ocean Engineering In Partial Fulfillment of the Requirements for the Degree of
Master of Science in Ocean Systems Management
Abstract
Since the early nineties, the introduction of new High Speed Car-Ferries has had an important effect on waterborne transportation networks. In some of the most characteristic routes around the globe, a substitution process of conventional ferries by high-speed units in a certain domain of distances is taking place.
The purpose of this research is to analyze the economic parameters that define the Fast Ferry market and to study the economic feasibility of such a service. The demand for the service, the cost structure of both the fast car-ferry and the conventional ferry as well as competitive issues characteristic of the industry will be analyzed to determine the feasibility of a high-speed service. Special attention will be paid to the possibility of substituting conventional ferries with fast car-ferries.
Thesis Supervisor: Henry S, Marcus
Acknowledgements
I am thankful for the support of the Fundacion Pedro Barrie de la Maza, which funded my graduate studies at MIT. I am indebted to Professor Henry S. Marcus, for his
Table of Contents
Introduction 11
Motivation for the study 11
Aim and Scope 11
1. An Overview of the Industry 13
1.1 Brief History of the Fast Ferry Industry 13
1.2 Markets for a Fast Car-Ferry Service 17
1.3 Main Characteristics of a Fast Car-Ferry 20
1.4 Corporate Structure of the Industry 25
2. Consumer Decision And the Fast Car-Ferry Service Demand 29
2.1 Individual Consumer Choice 29
2.2 Market Demand Segments 34
2.3 Aggregation across Individuals 37
3. Estimating Fast Car-Ferries Market Shares
39
3.1 Analysis of Existing Fast Car-Ferry Routes 39
3.2 Market Shares Versus Attributes of the Modes 41
3.3 Application to the Generic Routes 45
4.
Cost Structure of the Fast Car-Ferry Industry
49
4.1 Criterion to Perform the Comparison 49
4.2 Cost Structure: Main Items 50
4.3 Definition of the Generic Routes 53
4.4 Cost Structure: Fast and Conventional Service 55
4.5 Results and Sensitivity Analysis 58
4.6 Discussion of the Results 60
5.
Feasibility Analysis
65
5.1 Monopolistic Operator Introducing Fast Ferries 66 5.2 Fast Ferry Specialized Operator Entering a Quasi-monopolized Routes 70 5.3 Fast Ferry Specialized Operator Competing against Major Operator 74
5.5 Strategic Issues
6. Conclusions
6.1 The Fast Car-Ferry, in the Restricted Context of the Car-Passenger
Waterborne Transportation Industry
6.2 The Fast Car-Ferry, in the Context of the Ferry industry as a Whole
Appendices
Appendix 1 Appendix 2.1 Appendix 2.2
References
Database of existing Fast Car-Ferries. Major Fast Car-Ferry Services
Selected Routes for Fast Car-Ferries.
93 101 103 109
List of Figures
Figure 1.3.1: Figure 2.2.1: Figure 2.2.2: Figure 5.1.1: Figure 5.2.1: Figure 5.3.1: Figure 5.3.2:Fast Car-Ferry Typology
Price/Service relation to trip Characteristics Demand Segmentation Conceptual Model
Decision Chart: Monopolistic Operator Introducing Fast Ferries In Competition with Conventional Ferries Decision Chart: Fast Ferry Specialized Operator entering a Quasi-Monopolized Route with Only Conventional Ferries Decision Chart: Specialized Operator Entering a Quasi-Monopolized Route with Conventional and Fast Ferries Decision Chart: Major Operator Reacting to the Introduction of an Independent Fast Ferry
List of Tables
Table 1.1.1: Table 3.2.1: Table 3.2.2: Table 3.2.3: Table 3.3.1: Table 3.3.2: Table 4.2.1: Table 4.3.1: Table 4.4.1: Table 4.4.2: Table 4.4.3: Table 4.5.1: Table 4.5.2: Table 4.5.3: Table 4.5.4: Table 4.5.5: Table 5.1.1: Table 5.2.1: Table 5.3.1: Table 5.3.2:Development of the Fast Ferry Fleet
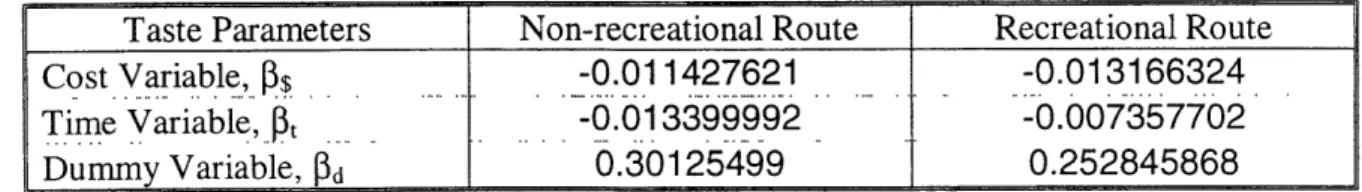
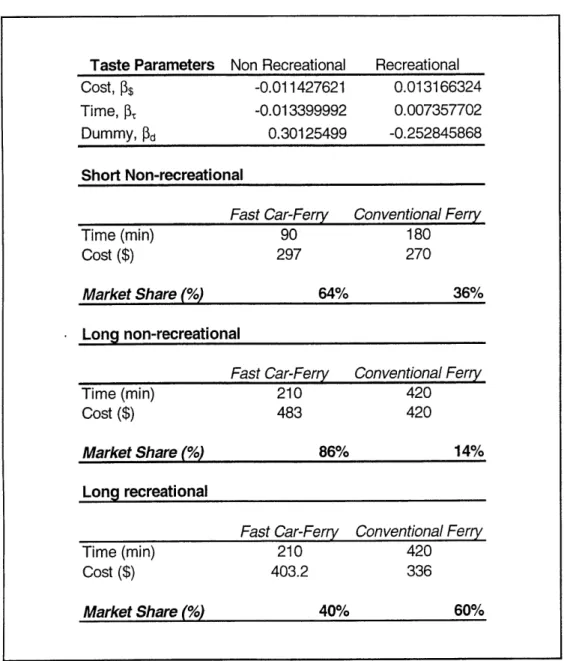
Fast Ferry Market Share versus Time and Cost
Selected Fares for Fast Ferries and Competing Modes Estimated Values for the Taste Parameters
Attributes for the Generic Routes
Generic Routes: Market Shares Estimates Selected Port Dues Per Trip in French Francs Characteristics of the Generic Routes
Fast Ferry Cost Items
Selected Conventional Ferries Conventional Ferry Cost Items
Cost Comparison Results, Short Route Cost Comparison Results, Long Route Cost Comparison, excluding port dues Capital Cost Analysis
Sensitivity Analysis of the Cost Structure
Sample Revenue-Cost Calculation: Monopolistic Operator Introducing Fast Ferries Backed up with Conventional Ferries
Sample Revenue-Cost Calculation: Specialized Operator Entering a Quasi-Monopolized Route with only Conventional Ferries Sample Revenue-Cost Calculation: Specialized Operator Entering a Quasi-Monopolized Route with
Conventional and Fast Ferries
Sample Revenue-Cost Calculation: Major Operator Reacting to the Introduction of an Independent Fast Ferry
INTRODUCTION
Motivation for the Study
Since the early nineties, the introduction of new High Speed Car-Ferries has had an important effect on waterborne transportation networks. Prior to the present decade, the speed at sea had been restricted to a very limited number of passenger-only ferries. In some of the most characteristic routes around the globe, a substitution process of conventional ferries by high-speed units in a certain domain of distances is taking place.
Up until today, both the number of units ordered and the size of the vessels continue to grow. The market has already validated the size of the vessels initially introduced, around 400 passengers and 75 cars, sailing at around 35 knots. New orders have focused on bigger and faster units, with the biggest ones currently in operation of 1,500 pass / 375 car catamarans sailing at 40 knots, and the faster one a 450pass / 50cars sailing at 55 knots.
Such a young transportation service has not yet reached its equilibrium. Operators continue to study new proposals in relation to both routes and technical particulars. Certain operators in the market believe that these new vessels will create a revolution in the ferry market, while others remain doubtful, thinking that the profitable application of
the new designs will remain confined to a few very specific routes.
The Fast Car-Ferry market has been especially developed in European routes. The deregulation of passenger transportation at sea within the UE member states scheduled to be effective in 1999 will move to a more competitive market, and operators with competitive advantages will take advantage of the situation. Within this framework, the study of the Fast Car-Ferry, its economies and its viability as a concept become important issues.
Aim and Scope
The purpose of this research is to analyze the economic parameters that define the Fast Ferry market and to study the economic feasibility of such a service. The demand for the service, the cost structure of both the fast car-ferry and the conventional ferry as well as competitive issues characteristic of the industry will be analyzed to determine the feasibility of the high-speed service. Special attention will be paid to the possibility of substituting conventional ferries with fast car-ferries.
The study will be specifically, although not exclusively, focused on vessels of over about 500 pass/100 vehicles with a minimal speed of 35 knots. The range of the routes analyzed will include trips in between 20 and 200 nautical miles. This is the range where timesaving offered by the high speed vessels can be appreciable. The study will be limited to inter-city waterborne transportation.
To the extent that information is available, a database including existing vessels and new orders, defined with technical characteristics with relevant economic influence, prices, delivery dates, operators, builders, routes, passengers carried, etc. will be developed. This database will be used as a support for the study.
Chapter 1
AN OVERVIEW OF THE INDUSTRY
This chapter provides the necessary knowledge about the Fast Ferry industry to develop the targeted goals of the study. In conjunction with Appendices 1 and 2, it will provide knowledge about the state of the art in the Fast Car-Ferry industry. We begin by briefly reviewing the history of fast ferry transportation. In the second section, the potential markets for Fast Ferry services are outlined, pointing out the main characteristics of the existing routes. The main particulars defining the vessels and specially those with economic influence are reviewed. Finally, we present an overview of the current corporate structure of the industry.
1.1 Brief History of the Fast Ferry Industry'
It may come as a surprise to learn that the world's first Fast Ferry, using the classical definition of a commercial vessel sailing over 25 knots, entered service on a route in southern Italy, linking Sicily with mainland Italy in August 1956. That first ferry, a 72 seat PT.20 designed by Supramar and built by Rodriquez, remained in service for almost
30 years and the same design is still operated on the route to this day.
In June 1957 the first hydrofoil designed for river routes was launched in the USSR. The total number of hydrofoil ferries produced in the former USSR is supposed to have been very large. Although available data is not very reliable, the production lines of just three designs (the Raketa, Meteor and Kometa) exceeded 1,000 vessels.
Conveniently, at the beginning of each subsequent decade since the 1950s, a new fast ferry concept has emerged. We will consider the development of the industry on a decade by decade basis:
1956-1959: Surface piercing hydrofoils
Following the introduction of its first hydrofoil in 1956, Rodriquez had a monopoly for the remainder of the decade. The company initially concentrated on production of the PT.20 but introduced the larger PT.50 in 1959.
At the end of the decade, the prospective fast ferry operator had the choice of one yard, one type of vessel, two designs, a size range of 70-140 seats and a service speed of approximately 32 knots.
1960-1969: Surface Effect Ships (SES)
Air cushion vehicles (hovercraft and sidewall hovercraft, or SES vehicles) were introduced, but with limited commercial success. Supramar remained the dominant designer with the PT.20 and PT. 50 and Rodriquez had been joined as licensee by Hitachi in Japan and Westamaran in Norway. For most of the decade, surface piercing hydrofoils were the only practical option available to operators and the size range remained identical to the one offered in the fifties.
Towards the end of the decade there were two significant developments in the United Kingdom. One, the appearance of the Hovermarine 216 SES, was to have a pronounced impact on fast ferry development during the next two decades. The other was the appearance of the British Hovercraft Corporation SR.N4, and was to prove a false dawn.
At a time when the largest capacity/service speed being offered elsewhere was 140 passengers and 32 knots, this was a vessel capable of carrying 254 passengers plus 30 cars at a service speed of up to 65 knots. It is worth pointing out that two of those self-same craft, rebuilt as larger versions during the late 1970s, are still in service in the English Channel ( operated by Hoverspeed, a subsidiary of SeaContainers). They carry 390 passengers and 55 cars at a service speed that results in an average crossing time of less than 30 minutes -faster that the train trip through the Channel Tunnel.
1970-1979: Asymmetric Catamarans
This was the period when passenger transport around the West Coast of Norway was changed by the appearance of the Westamaran 86. The builder was Westamaran, who having built Supramar hydrofoils under license, could see the attraction of high speed at sea, but could also see that the market was being suppressed by the relatively high cost and perceived sophistication of providing such a service.
The company's solution was to produce a catamaran that could carry 160 passengers with a reasonable ride quality for the Norwegian market. Although the service speed was approximately 7 knots lower than that of the hydrofoils, it was still faster than what had been generally available in the area previously. A few years after the Westamaran 86, a 180-seat having a service speed of around 28 knots, the Westamaran 95, appeared and started to make an impact on export markets.
While this was happening, Rodriquez had started to build its own designs, which were marginally larger and marginally faster than those proposed by Supramar. At the same time, Hovermarine was having considerable success with its HM 216, a design able to carry up to 65 passengers at a service speed of 35 knots.
By the end of the 1970s, the number of fast ferries built had doubled, and the number of designs available was seven. Fast ferries with capacities of over 200 passengers were still relatively rare.
The 1970s also proved to be the high point, in terms of commercial sales, of hovercraft. We should also mention the Boeing Marine Systems Jetfoil, a 260-seat fully submerged hydrofoil design that has a service speed of 42 knots and a ride quality that fast ferry designers continue to use as a benchmark to this day. The craft is still in license production but a design that was expected by its builder to be very well received became, like the SR.N4 hovercraft, a one-route vessel. SR.N4 is in operation only in Dover-Calais, and the Jetfoil, in Hong Kong-Macao.
1980-1989: Symmetrical Catamarans
The 1980s were the decade of commercial realism as far as the fast ferry industry was concerned. It was the decade when the builders and operators made the breakthrough. The number of countries building fast ferries doubled, symmetrical catamarans appeared, and for the first time one country, Norway, could claim to have more than one significant builder. By the end of the decade, not only were the symmetrical catamarans considerably bigger than the surface piercing hydrofoils, they were also as least as fast. A country that had not previously figured at all - Australia -entered in the scene. The number of operators in Australia was limited, basically to Barrier Reef excursions, as was its design base but in International Catamarans, it had a company that was prepared to license builders around the world. The country also had companies that were experienced in aluminum construction and by the end of the 1980s, two Australian yards were becoming dominant.
Growth in the size of fast ferries worldwide had also been substantial and by the end of the 1980s, operators had a choice going up to 449 seats - the largest then allowed by international legislation. They still had only eight basic types to choose from. By 1989 the catamaran was the most common type of vessel.
The 1980s was the decade when Hovermarine completely dominated the market for fast ferries up to 100 seats, apart from the vessels purchased by Norwegian operators, at the expense of the surface piercing hydrofoils. By now, the hydrofoil market had basically been marginalized to 150-250 seats.
Around the middle of the 1980s, there was also another important development that has proved successful: the appearance of the first wavepiercing catamaran.
1990s: Fast Car-Ferries
Since the early nineties, when the size of the vessels started to grow, several yards now looking for new markets to replace lost naval orders, entered the commercial high-speed sector. Their strategy has been to offer designs that they know and understand
-high speed monohulls. The possibility of -high value contracts has also attracted yards that would have previously dismissed fast ferries as being too small to bother with.
One result of all this is that there is now a much wider geographic spread of fast ferry builders, particularly in Europe. At present, vessels are under construction in 19 countries around the world. However, most of those countries continue to be represented by just one or two yards. Approximately 85% of all the fast ferries ever built are still in existence.
The first Fast Car-Ferry suitable for commercial use transporting both passengers and cars was the "Great Britain" wave piercing catamaran, built in Australia on account of the British conglomerate SeaContainers. It was destined to the English Channel and, although it suffered some operating problems, it proved that this new mode was technically practicable and profitable.
At present, the industry is dominated by vehicle carrying ferries. The number in service and on order continues to grow, as does the size of the designs, some of which now have a limited bus and truck carrying capability. One of the most recent to appear is the Stena HSS 1500.
To take the growth at one yard, International Catamarans Australia, as an example, in 1990 the normal size of the 74m wavepiercer was 450 passengers plus 84 cars. In 1996, the standard production model was an 81m wavepiercer able to carry 700 passengers and 180 cars. But from the middle of 1997 onwards, the standard design has been an 86m wavepiercer capable of carrying 800 passengers and 200 cars.
Development of the Fast Ferry Fleet
Number Growth 1997 Fleet
Type 1990 1997 %. Avg Passenger Car
age capacity capacity
Catamaran 311 530 70.4% 6.5 151.6 3,911 Hovercraft 45 28 -37.8% 11.5 3.4 184 Hydrofoil 368 343 -6.8% 16.9 50.4 0 Monohull 118 215 82.2% 7.4 45.5 2,091 SES 61 102 67.2% 11.4 18.2 0 Total 903 1,218 34.9% 10.1 269.1 6,186
Source: Drewry Shipping Consultants
Table 1.1.1: Development of the Fast Ferry Fleet
With the exception of two SR.N4 hovercraft, all the vehicle ferries at present in service have been built since 1990. At the end of 1995, 37 of the 85 fast ferries on order
were vehicle ferries. In Table 1.1.1 we summarize the growth of the industry in the nineties.
Ponder the words of the chairman of Stena Line, an operator that currently operates several Incat wavepiercers, a HSS 900 catamaran, and three HSS 1500 catamarans:
"Our technical achievements [with the HSS] will revolutionize ferry traffic worldwide and the commercial importance of this breakthrough can be likened to the changeover in the aviation industry from propeller driven aircraft to jet engines"
1.2 Fast Ferry Markets
Waterborne transportation is something that continues to be seen by the general public as a strange or, at least, an unfamiliar transportation mode. For the rest of the transportation modes it will not be necessary to explain what their potential markets are; it is something that, for most people, is intuitively obvious.
In the introductory notes to this thesis, the length of the potential routes to be studied was limited to a range between 20 and 200 nautical miles. The reason for this restriction is that, with the level of technology presently available, the proposed distance range is the one in which a fast car-ferry can compete with other transportation modes. For longer routes, timesaving will never be comparable with those of the air mode, and if time is not a constraint, the conventional ferry seems a "good enough" alternative. Also, different regulations require providing cabins when trip time exceeds a certain number of hours. For distances under a certain limit, which we have roughly defined equal to 20 miles, the time gains, in comparison to the conventional ferry, decrease by the presence of the port and terminal timing constraints to levels at which the service does not offer any competitive advantage.
For existing routes, Appendix 2.1 serves as a valid reference to show where large fast ferries are an available mode at present. The main areas with fast ferry presence can be divided geographically as follows:
* Those surrounding U.K. (the English Channel, including routes from Belgium Holland, the Ireland- England or Scotland routes).
* Scandinavian routes, mainly connecting Denmark with the Scandinavian peninsula, * West Mediterranean routes, either from mainland Italy to Sardinia, mainland France
with Corsica or mainland Spain with the Balearic Islands, and also the Gibraltar Strait, connecting mainland Spain with Ceuta or with Morocco.
* Other routes, including Rio de la Plata (linking Argentina with Uruguay), Australia-Tasmania route, the Cook Strait in New Zealand, the British Columbia project, one route in Japan, domestic Greek routes and others in Asia.
Future potential markets, based on geographical considerations and in an important ferry tradition (i.e., routes where the distance range is appropriate and the economy of the area is perceived as being capable to support such a service), can be found in several places. To mention just some examples, within the U.S. (see Ref. [4]), Lake Michigan offers interesting possibilities as does the Hawaiian Islands. In an international context, several places on the planet offer potential for development. Some connections between U.S. and certain Caribbean destinations can also be potential routes. In Asia, Japan, Philippines and Malaysian domestic routes also offer high potential for development. In Southern Europe, expansion is now facing the eastern Mediterranean countries, especially the inter-island Greek network.
A categorization of the markets attending to the trip purpose will allow us to distinguish between the two most important segments of this market. To the present, fast car-ferries have been introduced in routes serving recreational destinations and in routes serving non-recreational destinations with high passenger flow rates round the year. The analysis of the different routes in service shows that, from a distance viewpoint, recreational destinations tend to be longer links.
However, the most important fact that clearly distinguishes these two routes is the seasonality of the demand. In the case of non-recreational routes, although with clear peak periods and therefore important seasonal effects over the demand, vessels are capable to operate round the year. In the case of recreational routes, the ships are not profitable out of the summer season. In this second case, the operators need to relocate the vessel in the winter season. The strategies to relocate the vessels in the off-summer periods will be discussed later on in this study.
The competing modes in a given route are also an important parameter to look at. Among the existing routes, the most extensive competition is found in the English Channel. In this route, we find all potential competitors. Airplanes, joining Paris and Brussels with London; the fixed link, provided by Eurotunnel, offering direct high-speed trains to link London with Paris and Brussels and Shuttle trains to transport freight vehicles and passengers between Dov and passengers between Dover and Calais, the conventional ferry operators and the fast ferry operators. In most of the cases the fixed link is not an available mode, although fixed links are expected to join, in the near future, Denmark with the Scandinavian Peninsula and Argentina with Uruguay.
The existence of a fixed link is in practice synonymous with a non-recreational and short route. That is the case of the all the (three) existing or projected major links. Nevertheless, the most common situation that we find is a fast ferry competing with a conventional ferry.
Seasonality can also be due to weather or sea-state conditions. This would be in direct relation with a parameter that must be analyzed from both the viewpoint of the vessel and the route: the level of reliability of the service. By reliability we mean the ability of the ship to sail at the targeted speed in rough seas (without causing seasickness
to the majority of the passengers, or deteriorating the vehicles). Prior to the introduction of a Fast Car-Ferry in a given route, it is necessary to perform a statistical analysis of the sea state along the operational season. With these data, the operator will be able to statistically infer the expected number of days that the service will not be operational, and the number of days that it will be operated at lower speeds. A Reliability coefficient for a given route summarizing this information will be used. In the following section of this chapter we will analyze the problem from the vessel's design perspective.
All the route examples outlined a few paragraphs above share some common characteristics, apart from the fact that they are in a certain distance range. First, previous to the introduction of a fast ferry, there was a conventional ferry operating in the route. In most of the routes the conventional ferry continues to operate, although capacity has been reduced. From this viewpoint, the fast ferry is somehow implicated in a substitution process of conventional units. Second, all of the routes are located in areas where the average household income is enough to support the extra-cost associated with the timesaving offered by the service. The routes are located in well-developed economies. Third, the introduction of the fast service has expanded the number of passengers and cars carried. It is not clear to what extent this fact relates to the introduction of the new mode or if it has just been the consequence of introducing the new service at a time in which demand for transportation is suffering strong growth.
The previous discussion and the information contained in Appendix 2 help to gain knowledge about the routes where Fast Car-Ferries are potential competitors. We have reviewed the different parameters that can characterize a route, including trip purpose,
domestic or international route, distance, seasonality, and competing modes.
For the purposes of this study, we now suggest to breakdown the routes in the following categories:
* Short Non-Recreational Route: operating throughout the whole year, competing with a conventional ferry offering seats, a fix link (in some cases) and indirectly with air transportation services. The best example for this category may be the Dover-Calais route.
* Long Non-Recreational Route: operating throughout the whole year in longer routes, competing with a conventional ferry, offering seats and in some cases also cabins, and indirectly with airplane services. Two very different examples of this category are the routes between Montevideo and Buenos Aires and the one between Hook of Holland and Harwich.
* Recreational Route: operating only in the peak season, the vessel must be relocated or shifted to another service in the off season. They operate in a distance range longer on average than the non-recreational routes. They are in competition with the airplane and the conventional ferry, offering both seats and cabins. Examples of recreational routes include the links between the Mediterranean islands Mallorca, Corsica and Sardinia and the mainland of their respective countries, Spain, France and Italy.
The distance range chosen, between 20 and 200 miles, shows approximate figures just for guidance. It will be difficult for all the existing routes to fit in the rigid frame of a given range of distances. In any case, to define the upper limit of the long route, considerations about comfort and time on board for passengers, regulations imposing the disposition of cabins for trips over certain travel time, and relative timesaving to other modes have been taken into account. To define the minimal distance of the short route, relative timesaving with respect to conventional ferries has been the most important issue taken into consideration.
The proposed classification intends to distinguish routes looking to the core of their economics. Regarding the demand on the route, the main distinction is recreational versus non-recreational markets. Regarding costs, the main distinction is long versus short routes.
1.3. Fast Ferry Characteristics
This section intends to overview fast ferry's technical characteristics and discusses those with economic influence. We begin by choosing the most representative issues and afterwards we discuss in depth different available alternatives and their consequences. The main particulars of most of the ships currently operating or on order are included in
Appendix 1.
To characterize a specific vessel we have chosen to take into account the following features [10]:
* Basic available designs * Construction material * Geometrical particulars * Transportation Capacity * Performance * Construction time * Crew
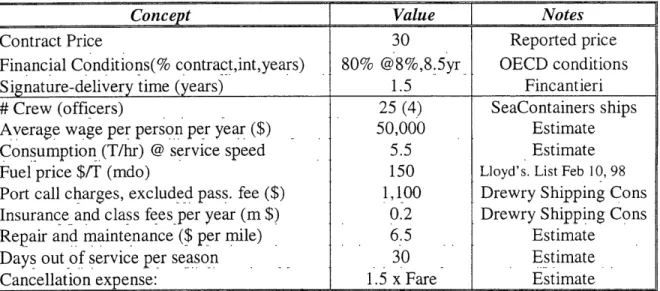
Other important characteristics of the ships, such as price, financial conditions, and in general the cost structure will be studied in Chapter 4.
Design Types
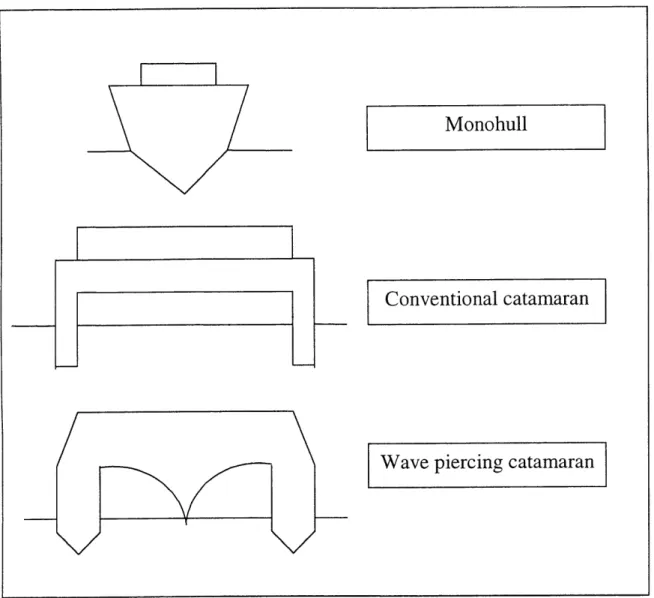
At present there are three basic available designs on the market (Figure 1.3.1): Conventional Catamarans, Wave Piercing Catamarans and Monohulls. In short, it is generally accepted that catamarans constitute the best choice for calm seas, while single-hull units are supposed to offer major flexibility to service requirements, granting better
performance on rough seas. This difference is more difficult to detect as vessels grow in size.
Figure 1.3.1: Fast Car-Ferry Typology
In reference to the typology of the builders, simplifying the matter, we can say that monohulls are offered especially but not exclusively, by shipyards with strong military construction tradition, while wavepiercer catamarans are exclusive of the Australian builder InCat (International Catamarans). Conventional catamarans are built in several different shipyards, especially in Australia and Scandinavian countries.
Although the type chosen has not a direct economic effect, it will have a direct relation with the route to which the vessel is optimized and the reliability of the service in relation with its sea-keeping properties. It will also be related to the type of terminal most
Monohull
Conventional catamaran
suitable. If no investment at all is to be made in the terminal, monohulls are the most appropriate option. Catamarans will provide the operator with bigger beams thus giving them greater flexibility to decide the configuration of the public spaces.
The reported prices for existing units tend to show higher values for catamarans. In any case, this information has to be carefully examined, since the importance of subsidies in the shipbuilding industry (especially in the case of naval constructors) can distort the real investments made by the owners. In EU countries OECD conditions are assumed to be mandatory, which is not necessarily the case in Australia.
Construction material
Two basic options are available for fast ferries: aluminum alloys and high tensile steel. Combinations of these basic options are also possible; the most common is a high tensile steel hull with an aluminum superstructure. For certain parts on the superstructure composite materials can also be used. Although certain hulls have been built of high tensile steel, the most common solution chosen is aluminum.
The motivation for the use of this material is the reduction in weight, which is in the order of 30%. Performance in fast ferries is strongly dependent on displacement, and the reductions provided by the use of this material are a key factor.
On the other hand, aluminum imposes certain added difficulties. First, aluminum loses its structural properties at temperatures under those that are reached in a fire, and it becomes necessary to double the structure in certain areas of the vessel for security reasons. Second, the number of units fully built in aluminum, of the size of the average fast car-ferry, is very limited, and the expense in structural design calculations in order to fulfill the class requirements can be burdensome.
Geometrical particulars
The main particulars to be reviewed include Length Over All (Loa), Maximum Beam (B), Molded Draft (T), Gross Registered Tons (GRT), Displacement and Deadweight Tons (DWT).
Physical size related parameters, combined with the type of design chosen, provide a better understanding of the product we are dealing with. Physical dimensions can also be important to study the interaction with the terminals.
In the case of monohulls, the L/B ratio is not especially high. Most of the units have a ratio around 6.5. The vessel's small block coefficients are obtained combining V hulls with small drafts. Thus, the key issue is to minimize the draft. Most of the units (including catamarans) are reporting drafts of less than 3 meters. Also, DWT will be
adjusted as much as possible. For that reason, endurance is considered a key parameter when defining the specification of the vessel.
The other major implication of the need of a draft as small as possible is the limitation imposed on the propulsion. Waterjets perform like propellers inside nozzles, providing higher power for a given diameter than conventional propellers. This becomes an important advantage when draft is a major constraint.
Vessels are light with most of the hull out of the water. This creates in them the need for extra-maneuvering power, since it can prove very difficult to approach the terminal at low speeds and high winds. Waterjets also help to overcome this inconvenience.
Transportation Capacity
To define the transportation capacity we need to know the number of passengers and cars for which the ship is licensed and the dead weight capacity. With the exception of the HSS 1500 Stena design, none of the units currently in service is prepared to carry freight. The two MDV 3000 Jupiter units currently under construction in Fincantieri will
add to this list.
The first generation of fast car-ferries was one of vessels around 450 passengers and 80 vehicles. But, following the development of the industry in the nineties, the average size of the units on order has been continuously growing. A stable size for these vessels might be around half of the capacity of a competing conventional ferry.
An important reference when studying the fast ferry fleet is the ratio of passengers-to-cars. The first units that entered into service in the early nineties (Incat 74) had a ratio around 5.5. That was also the case with the first monohulls, Aquastrada and Mestral. The most recent units seem to be closer to a ratio of 4. Conventional ferries use to have figures in between 3 and 4, although in this case a certain percentage of car space is devoted to freight transportation. It seems that fast ferry designs have reached a ratio that is consistent with the market needs.
Another group of fast car-ferries, characterized by much higher speeds (over 50 Knots) and higher ratios (around 9), has been introduced recently. This is the case of the designs developed by Advanced Multihull Designs. This particular type of catamaran is especially designed to maximized its speed is calm waters.
Performance
This heading includes Service Speed (at a percentage of the MCR and for a given displacement and sea state), sea-keeping properties (ride quality) and issues related to the propulsion plant (power output, type of engines, propulsion method and consumption).
The service speed must be clearly defined, at a realistic MCR percentage and for a given displacement and sea state. Usual terms to define service speed are 90% of the MCR, the expected load factor in the route and a sea state characterized by waves of 1.5 m of significant height. It would be necessary to reduce the nominal speed to take into account an operational margin that will sustain a reliable schedule in case of any inconveniences. Maximum allowed speeds in restricted waters must be taken into consideration when calculating total navigational times for the routes.
Seakeeping properties of the vessels are assured by the stabilizing systems on board. The most common arrangement includes a T-foil in the forepart of the hull, lateral fins placed in a "strategic" position (usually about 2/3 from the aft part of the ship) and two flaps at the aft of the vessel. The performance measurement used is the percentage of people getting seasick in the route. Precisely, the probability that, given a certain vertical acceleration (consequence of the sea state, the interaction of the vessel with the waves and the speed) a certain percentage of the passengers will become seasick.
O'Hanlon and McCauley defined the comfort curves, or Motion Sickness Incidence (MSI) curves. These curves give the most probable percentage of seasick passengers after a given exposition time to a certain vertical acceleration and wave-ship encounter frequency.
Certain countries limit the navigational permits for fast ferries to a maximum characteristic wave height. For example, when the Stena HSS 1500 started operations in the Irish Sea, the British Authorities decided to impose a maximum limit of 2.5m significant wave height, that later was changed to 4.5m. For a given route, there is statistical information about the waves in the area that will allow the operator to estimate a certain number of cancellations per year, providing an evaluation of the minimal seakeeping properties that the vessel must comply with.
There are two alternatives to provide the necessary power to these vessels: high-speed diesel engines and gas turbines. At least three issues must be considered when defining the propulsion plant: Consumption (high in both cases, but higher for the turbine), weight per kW produced, and maximum throughput of each option. If very high speeds are required, the turbine will be the only available option. The weight per kW in the case of diesel engines is about 4.5 Kg/kW, which compares to the 14.2Kg/kW ratio of the conventional diesel engines installed in conventional ferries.
Most of the fast car-ferries currently operating are equipped with diesel engines, due to the considerable fuel savings offered by this option. Just to give an approximate idea, while the consumption in shop trials of a diesel engine is about 200gr/kW-hr, the same figure in the case of the gas turbine is about 240gr/kW-hr. A further inconvenience of the gas turbine is that its performance is very sensitive to the ambient temperature. In all the cases surveyed, the propulsion was provided with waterjets. The only differences detected are the number of waterjets and its specification.
Construction time
The time gap between contract signature and delivery date affects the timing of the payments (and prefinancing needs for the builder) and the forecasts that the operator must do when planning the investment. Construction time is shorter in the case of fast ferries as it compares to conventional ferries. While for a fast ferry it takes about 1.5 years to be built, for a comparable conventional ferry it will take between 2 and 2.5 years.
It is likely that better payment terms will be available in the case of fast ferries (say, 20% at signature and 80% at delivery) than for the conventional ferry. For the latter, the payment terms are more likely to follow the general rule in the industry (20% at signature, steel cutting, keel laying, launching, and delivery). This is due to the smaller prefinancing required for a fast ferry, which is a consequence of the shorter construction time and smaller capital requirements.
Crew
The smaller crew requirement in the case of fast ferries is considered one of the major potential advantages of this option. A fast ferry can be completely operated with as little as 12 crewmembers, while the number in a conventional unit will be much higher. This matter will be analyzed in depth in the study of the cost structure.
1.4. Corporate Structure of the Industry
In this section, the corporate structure of the fast ferry industry will be reviewed focusing on the different parties involved. First, we will characterize the operators and then we will review the builders.
Operators
The typology of the companies involved in fast ferry operations can be traced by categorizing the companies in relation to their position in the ferry business in general. There are at least three well-differentiated types of companies [2]: fast ferry specialists, major ferry companies with interests in the fast ferry segment, and regional ferry operators.
Specialized firms include firms dedicated to Fast Ferries with little or no presence in the conventional ferry market. Buquebus, the Uruguayan operator, Holyman, an Australian subsidiary of the TNT Group, and the ferry branch of SeaContainers are the best examples.
Those companies have almost no conventional ferries and are not limited to a single market or operational area. They do not back-up fast ferry operations with conventional
ferries. The strategy is to take advantage of any potential route through direct operations, subsidiaries or joint ventures. The vessels are not operated in a single route; on the contrary, they are located on the market what they best suit at any time. Some of these companies are also active in the charter market, bareboat chartering the vessels to other ferry operators in their off-peak seasons.
The companies that best represent the segment of the ferry operators committed to introducing new fast units are, with very different strategies Stenaline, the ferry operator of the Stena Group, and the ferry division of the P&O Group. Those companies are the most important conventional ferry operators in Europe. From the very beginning of the fast car-ferry era, Stenaline has stated its commitment to the fast ferry concept. First, chartering units to operate them in selected routes and later on developing their own designs. The HSS program constitutes a unique approach to the Fast Ferry concept, based on units customized to fulfill the needs of the company, but also requiring extensive investments both on the ships and at the terminals. The HSS 1500 are the only operating fast car-ferries capable of handling freight, which is also a major difference with respect to the approach of the other operators.
The case of P&O is substantially different. It has been the most reluctant among the major operators to enter in the high-speed segment, and when they finally decided to enter in this market, they have chosen to charter existing vessels rather than order new ships. For two years, the company has been testing the concept in one route, between Scotland and Northern Ireland, where the Group also has control over the ports. For the 1998 summer session, they have decided to charter another ship to serve one of their U.K.- Continent routes.
These two companies have merged most of their operations in the English Channel and, interestingly, have decided not to include (with the exception of one route) fast ferries in the assets of the resulting company, P&O Stena.
Regional Ferry companies constitute the third group. An important number of them are state-owned companies. That is the case of SNCM in France, Tirrenia di Navigazione in Italy, BC Ferries in British Columbia, Tranzrail in New Zealand and Transmediterranea in Spain. Other private corporations specialized on certain areas. That is the case of the Greek Minoan Lines, the Scandinavian venture ScandLines or the Norwegian ColorLine. All these companies support their operations with a conventional ferry fleet and have introduced on certain specific routes fast ferries, in some cases to absorb seasonal demand and in other cases on a more continuous basis. In all the cases, the companies operate jointly fast and conventional tonnage, thus backing-up the fast service in the case of cancellations.
In most of the routes the number of companies competing is very restricted. There is an important number of routes that are quasi-monopolies in practice, and in most of the routes the number of operators is three or less. Since most of the fast car-ferries are operated in European routes, the scheduled deregulation of the industry in 1999
(eliminating entry barriers to domestic routes in all EU countries) can have a major impact, especially for regional operators with protected niche markets.
Ferry operators have three major sources of revenue: Passengers and private vehicle tickets, freight, and onboard sales (in international routes granted with duty free sales rights). Freight is seized by most of the conventional operators as a key element, since it produces a fairly constant stream of cargo during the whole year, as opposite to the highly seasonal passenger demand. On board expense can be the major source of revenue in routes granted with duty free rights, providing up to one third of the total revenues for some conventional ferry operators [20]. In mid-99, duty-free sales are going to be eliminated in European Union domestic routes, and will force some of the major operators to restate their revenue structure.
The ferry business is rich in cash. Reservations and delayed expense payments provide operations cash flows and companies do not need to finance operations.
Fast Ferry Builders
The type of designs offered by the shipyards is a good criterion to categorize fast ferry builders. While wavepiercing catamarans are an exclusive product of International Catamarans, the Australian yard, different shipyards build the other two basic designs, conventional catamarans and monohulls.
Monohulls are basically a product offered by European naval builders (e.g., Fincantieri in Italy, Bazan in Spain, etc) that have used this market to maintain workloads in the yards at a time when naval orders were not buoyant. Applying their expertise to the more conventional monohull high speed crafts, they have been capable to enter a market that in its origin was dominated by catamaran builders, offering extremely competitive prices and good delivery dates. Perhaps the fact that most of the monohull builders are naval yards is not totally unrelated to the price differential between monohulls and catamarans.
The country building most of the tonnage to date is Australia, a non-traditional shipbuilding country with two yards specialized in high speed: Austal and International Catamarans. Only catamarans are built in Australia, and Australian firms are very active in design and licensing to build in other countries. That is the case, for example, of the three catamarans under construction in British Columbia, Canada for BC ferries, or the B60, a 60 knot unit built in Bazan but designed by Advanced Multihulls Designs, an Australian naval architecture studio specialized in high-speed, inside the high speed market. Other shipyards in Europe, especially in Scandinavian countries (Danyard for the local operator Mols Linen, Finnyards and Westamaran for Stena, etc) also build conventional catamarans.
From the point of view of profitability, building fast crafts has proven to be a dangerous business. Two major issues have played a major role in mismatching costs and
prices for the builders. First, and keeping aside the Australian builders, specialized in fast ferries and aluminum, the yards entering the market coming from traditional shipbuilding have found costly the adaptation to the new construction material (aluminum) and the precision needed in these ships, including painful guarantee periods. The introduction of new technologies has proven to be more costly than expected, as usual.
Second, in such a restricted market, the effect of the unbalance between construction capacity and demand has been evident. The decrease in prices driven by the entrance of naval shipyards in the industry has affected severely the margins of all the builders. The other effect has been an industry growing at a very high rate, possibly generating excess capacity.
Some examples can help to illustrate those situations. Westamaran went bankrupt before finishing the first HSS 900. Finyards was acquired by the Norwegian group Aker Maritime after heavy losses and important delays in the construction of the three HSS 1500. Leroux & Lotz, the French builder, merged its shipbuilding branch with Chantiers de l'Atlantique after difficult financial years coincident with the construction of two fast ferries for the SNCM. Rodriquez, the Italian builder specialized in hydrofoils and also engaged in the construction of the Aquastrada design, was supported by a "rescue package" of local investors last year. And finally, the Australian yards, that were expanding capacity in the first half of the nineties, have nowadays several vessels under construction on "builders' account" (i.e., without a defined buyer).
Chapter
2
CONSUMER DECISIONS AND FAST FERRY DEMAND
The goal of this chapter is to analyze from a qualitative viewpoint the consumer decision process when facing the choice of different alternative modes of transportation. In this chapter only transportation aspects will be analyzed, thus not taking into account onboard leisure activities or other attributes inherently associated with the ferry market.Although the data necessary to develop a quantitative application of a demand mode split model is out of the scope of this study, the chapter presents a conceptual model of how individuals choose from a set of alternatives (including waterborne transportation) and a description of the aggregate demand. The quantitative application will be covered in the next chapter by presenting and analyzing the market shares of Fast Ferries in a
group of selected routes where they compete with conventional tonnage and with a fixed link, in the case of the English Channel routes.
Fast ferries are most of the times introduced in routes where a conventional ferry was already operating. Therefore, a certain substitution effect between conventional ferries and fast car-ferries is expected. At the same time, the service can compete with air transportation in certain cases, basically when the route is directly linking two major cities.
We begin by describing the individual behavior for the choice between the different alternatives. Then, an aggregation technique based in a classification method is proposed to estimate market shares. In order to define the classification in an accurate manner, we discuss the different market segments in this particular transportation case and propose a demand segmentation criterion.
2.1 Individual Consumer Choice
2A plausible model for mode choice decisions should be based in a valid theory of
consumer decision-making and should be possible to be adapted to transportation mode
2 The theoretical background and the models used this section are based on Ref. [13]. The particularization
decisions. The classical approach to these problems makes use of the concept of individual utilities to explain the choice behavior. The basic assumption underlying the models using the utility maximization criteria is that each individual, when confronted with a set of differentiable modes, is able to compare alternatives, rank them in terms of preference and choose the option with the maximum perceived utility. This model includes a rational choice at each step of the decision process. How rigidly the rational assumption should be interpreted is a matter that has been deeply discussed in the micro-economic consumer choice literature. For the purpose of this study, the utility maximization criterion seems to be a consistent basis to develop an individual choice framework for mode choice, regardless of how rigid those assumptions are.
Other components of the classical micro-economic model of consumer choice can be used in our context, although some must be modified to take into account the particularities of the transportation demand. The most important one is the derived nature of the transportation demand: People travel to be at a particular place at a particular time. The travel by itself imposes disutilities that must be included to realize the benefits of the trip. A transportation ticket is purchased for its attributes. From this perspective, the price of a travel option is not simply its monetary cost, but also the economic equivalent of the additional disutilities imposed to the traveler by the attributes of the trip. Among others, we should include the value of travel time, proximity of the available arrival time to the desired arrival time, comfort and reliability of the service, etc.
Since the benefits of the trip are generally independent of the attributes of the different travel options, we can say that the travel choice depends on the minimization of the disutilities of traveling to the desired destination. If the disutility of the travel is higher than the expected utility of the trip purpose, the consumer will decide not to travel. Individual decision-makers will have different choice sets and will assign different utility values to the different attributes of the different modes. Each individual will primarily define his or her choice set, which should include the available modes that are feasible to him/her, given his own constraints for that particular travel.
It is important to clearly define who is the decision-maker. For non-business trips, it seems clear that the decision-maker is the person who pays the ticket: the individual, the householder, etc. When referring to business travelers, it can be argued that the decision maker is the traveler, while the firm is the one paying. That can be true in the short term, but for the long term the firm is more likely to impose guidelines about its business travelling policy, and therefore is the real decision-maker.
Once the choice set is defined, our rational voyager is supposed to analyze the different modes, explicitly assign to each one of them a perceived disutility, and choose the mode with the lesser of the disutilities. At the time when the decision has to be made, the conceptual model to study the decision process can assume a Simultaneous Decision
In the first case, the consumer is supposed to consider all the modes in his or her choice set at the same time. In the second case the decision-maker might first group the different modes attending to certain criteria (usually in direct relation with trip purpose), then choose one of the groups, and finally choose the mode that minimize the travel disutilities for him or her. For example, in our case, the passenger might first decide if he wants to carry his own vehicle and then decide what mode to use. For the purpose of this study, we have decided to follow the second approach.
To develop the choice framework in our particular case study, suppose that an individual is willing to make an inter-city trip from a certain origin to a certain destination where ferry links are an alternative. The most general scenario that our passenger can find will include four alternative modes. The passenger will be able to choose between the airplane, a fixed link (a bridge or a tunnel) including both road and railroad, a conventional ferry or a fast ferry service.
If a transportation mode is going to be considered as an alternative to the ferry, the degree of substitution should be high enough. In general, there are doubts that air transportation might be included in a ferry analysis. When the ferry is linking two major cities with important traveler flows, airplanes and ferries can be in direct competition. This is the case in the route joining Argentina's Capital Buenos Aires and Montevideo in Uruguay, or in the route that has just been started between Liverpool in U.K. and Dublin in the Republic of Ireland. But for most of the existing routes the airplanes are not believed to be in direct competition with ferry services.
We assume that the consumer has determined the desired arrival time to the desired destination, all modes are available and therefore the consumer must only choose among the different options his or her preferred one.
Each mode is defined by its attributes, which contribute to determine the disutility associated with each one of the alternatives. The attributes taken into account to characterize each mode can be separated in two groups. First, mode specific binary variables, which take the value "1" if a certain condition is met, or "0" otherwise. Second, continuous variables, taking a specific value from a continuous range for each mode. Here we propose the following variables, for each mode
j
competing in a given route:Binary (0,1) variables
- Allows carrying the vehicle? (y/n). - Modej competing? (y/n)
- Availability of the service in the time window? (y/n)
- Alternative specific constant: Reflects the difference in the utility of alternative i from that of j, everything else equal. The variable will be equal to 1 for the alternative chosen as the base case and 0 for the others.
* Continuous variables - Price, Pi
- On-Route Travel Time, ORT,
- Transit time TTi Ti
- Door-to-Door Travel Time, DTi
- Comfort and Amenities, S,
For the purpose of this study, all the time continuous variables will be unified in a Characteristic Travel Time, Ti. This simplification includes the assumption that all times are equally valuable for the customer. Empirical results show that, especially in travel to work, consumers tend to minimize waiting time, thus placing different time values to the different stages of their trip. The Characteristic Travel Time will be specifically defined as a function of the competing modes. In the most important case for us, it will include a transit time and an on-route time, but in other situations a door-to-door time can be more relevant.
The binary variables allow us to define in a systematic way the available modes for the specific trip that the customer is planning to undertake. Whether the targeted trip includes driving or not, or it needs a specific arrival time, will allow to define the available modes for the characteristics that he or she is demanding. In the next chapter we will assume that only fast ferries and conventional ferries are competing, and that both services are available in the time window.
Among the different attributes listed there are some that can be considered to be more relevant for a particular travel than others. Historically, the most commonly used variables have been travel cost and time. Other variables like comfort and amenities can be considered second order characteristics. All of the modes offer different degrees of comfort and service amenities in the same transportation vehicle associated with different fares. Thus, it can be argued that if a customer wants to improve his or her comfort, other things equal, it is more likely that he or she will shift to a higher class rather than changing the mode.
However, it is clear that a level of comfort can be attached to each mode intuitively. We can say, for example, that a cabin in a Ferry is more comfortable than a seat in a Fast Ferry or a Ferry. And that those are more comfortable than a seat in an airplane or driving your own car, although such a statement will carry an important dose of subjectivity. The case of amenities is similar: the range of possibilities offered to the customer ranks from a snack in a plane to duty-free shopping areas, restaurants, in a conventional ferry.
In the case of passenger transportation at sea there is always another factor to take into account when talking about comfort, and that is ride quality. We are more inclined to consider that as a technical matter related to the reliability of the service. A Fast Car-Ferry will not be able to sail at full speed for sea states over a certain limit, but this is a factor that that seems to fit better in the study of a potential route rather than affect the
demand. Or putting it in another way, we will assume here that ride quality is "good enough" in all the competing modes.
We have chosen to consider cost and time as the most relevant variables. The frequency of the service will allow us to determine if a certain mode is a valid alternative for the customer. The rest of the variables will be discussed later on, at the time we revise the different strategies to implement a fast ferry service. Here we just want to remark that for ferry routes, amenities are considered to be a very important issue. In fact, the percentage of revenue obtained from onboard sales is at least of the same order of
magnitude as the ticket sales in international routes with duty-free shopping.
The next step is to define a utility function form for the individual utility. For a variety of reasons, the utility of any alternative is best viewed as a random variable. We now abandon the concept of a deterministic utility function, common in the classical microeconomic theory of consumer behavior, for a probabilistic utility function. Basically, that will allow us to better take into account the empirical results demonstrating that two "identical" individuals n and m, will not choose the same option. Therefore, we will assume that individual n chooses option i with a certain probability
P,,(i).
The random utility variables (Ui) are divided in their systematic (Vi) and random (e,) components. The systematic component can be interpreted as the mean of the probability distribution once a convenient referent has been defined. The form of the function chosen to specify the systematic component is the most difficult assumption to be made. An additive utility function of the attributes (yi) linear in the parameters is most often assumed for computational convenience:
Vin = I Pnk X Yik
Where the parameters Pnk show the taste of the n decision-maker referred to the k-attribute. These are the coefficients that, in an application of a disaggregate demand model, have to be statistically inferred sampling the potential consumer populations.
The means of the random components are (or can be made) equal to zero (after choosing the adequate reference) and their scale must be defined in concordance with the one of the mean Vi. At this point, the derivation of any choice model will be the result of making some assumption about the distribution of the disturbances. If we assume the disturbances are the sum of a large number of unobserved but independent variables, the distribution of the disturbances would tend to be normal. The model resulting from this assumption is called probit model. To overcome the analytical inconvenience of the
probit model, a "probitlike" model, the logit model, is commonly used. This model holds
the theoretical consistency supported in the central limit theorem but reduce de computational burdens.
The form of the logit model, in the case of just two alternative competing modes, i andj, competing, is: