EDUCATIONAL FOR THE SPANISH-SPEAKING PLANNING IN BOSTON by Barbara Beelar
B.A., Northwestern University (1964)
M.A. University of North Carolina (1969)
SUBMITTED IN PARTIAL FULFILLMENT OF THE REQUIREMENTS FOR THE
MASTER OF CITY PLANNING at the JASSACHUSETTS INSTITUTE TECHNOLOGY September, OF 1971 Signature of Author Department of and Planning, Urban Studi August 15,1 Certified b, Accepted by Thesis Supervisor
Chairman, Departmental Committee on Graduate Students
Rotch
pss: INST.NOV 1 1 1971
'C1E AR V5 es 971MUITLibraries
Document Services
Room 14-0551 77 Massachusetts Avenue Cambridge, MA 02139 Ph: 617.253.2800 Email: [email protected] http://libraries.mit.edu/docsDISCLAIM ER
Page has been ommitted due to a pagination error
by the author.
EDUCATIONAL PLANNING FOR THE SPANISH-SPEAKING IN BOSTON by Barbara Beelar
Submitted to on 16 August ments for the
p1 ann
ment the p of th
the Department of Urban Studies and Planning 1971 in partial fulfillment of the
require-degree of Masters in City Planning.
The thesis is an investigatio ing which has been done by the B
for the Spanish-speaking communi
lanning process is described, in
e unique characteristics of the migrants and migrants; a brief descri
Spanish-speaking community in Boston of information relevant to the educat
(A more detailed presentation of this on the research on bilingualism, the
educational programs, and information educational needs and problems of the
included in Appendix A of the thesis.
There are four case studies w
and analyzed. These are th program, Title VII--Bilingu
Transitional Clusters, and components of the planning
through the case studies: planning, program operation
community involvement, and
of the studies compares the common themes In th Education is of the presen procedures. reassessment. e English al Educati the Blacks process ar program in s and plan educationa findings e conclusion, the new De
discussed. A case is ma
t direction of the progr Recommendations are made
n of the educational oston School Depart-ty. The context of cluding discussion
Spanish-speaking im-ption of the
and a brief review
ional planning. information focusing evaluation of the available on the Spanish-speaking is
)
-hich are described
as a Second Language
on, the Bilingual tone School. Five e investigated
itiation, initial ning, parental and 1 goals. A summary and describes some
partment of Bilingual de for a reassessment ams and planning
to accomplish this
Thesis Supervisor: Title: Professor,
Lisa Peattie
Give me your tired, your poor,
Your huddled masses yearning to breathe free, The wretched refuse of your teeming shore, Send these, the homeless, tempest-tossed, to I lift my lamp beside the golden door.
The New Colossus for the Statue o York Harbor me: : Inscription f Liberty, New -- Emma Lazarus to be in America y me in America
hing free in America
small fee in America. Buying on One look I have my What will cre at u own you d S it is so nice
and they charge tw washing machine.
have though to keep i ce.
clean?
Skyscrapers bloom in America Cadillacs zoom in America Industry boom in America
Wealth without room in America.
Lots of new Lots of doo I'll get a
Better get
housing and space r slamming in our face
terrace apartment rid of your accent. Life can be bright i
If you can fight in
Fighting all right i If you are all white Her you So long Free to Free to are free as you s by anyth wait tab n America America n America in America. and you have pride
tay on your own side
ing you choose
les and shine shoes. Everyone's crying in America
Organized crime in America Terrible time in America
You forget I'm in America.
"Ame ri ca" (West Si de Story)
--Stephen Sondheim I like
Okay b
Everyt
ACKNOWLEDGEMENTS
This thesis represents the major phase of my life--the end of There have been many people along
guided me, who have educated me. this thesis to them, with the full
they have given, I am responsible
with their gifts.
conclusion of a my formal education. the way who have
I would like to dedicate understanding that
for what I have done
-- to my parents, first and foremost, who provided
what must have seemed to be never-ending support, but with sorrow that my mother did not live to share the end
of this phase with me;
--to Mr. Rice, my sixth grade teacher who helped
me write my Latin American scrapbook, my first research on Latin America;
--to the Rosenblum family who shared their home and love with me, and especially to Vic who encouraged
me to develop alternatives and enthusiasm;
--to the Club de Las Madres and the others in Los Cerritos who will probably never know about this work but who contributed most through teaching me about
human dignity;
-- to Professor Federico G. Gil (El Jefe)
who kindly helped me through a difficult period, as a true gentleman and a scholar;
-- to the many friends along the way,
particularly Linda, Hunter, Dean, Joyce, Henry, Reiners, Shostaks and Stewarts, the gang at Fat
Chance, and most especially my friend Ken, with love.
.I would also like to thank the M. I. T. professors--Lisa Peattie, my advisor; Herbert Gans; Rob Hollister; and Ron Walter--who have suffered
through many drafts of this thesis, giving advice,
kindness, and trying to make me focus on the central issues. I want given to me by Planning, parti on education in Boston College Spanish-speakin And, fi (once with W, n friend and typi
to acknowledge the financial the Department of Urban Stud
cularly the funds to attend Puerto Rico, and Dr. David
who gave me access to the da g project and free computer nally, I would like to thank ow with S, but never with H) st, who made this readable.
support ies and a conference Smith at ta from the time. Sara Jane Stewart,
The people I have interviewed have given me a lot of their very precious time. They have educated
4
me. I hope that there is something within these pages that they can use toward the realization of our common goal--creation of effective and relevant education for the Spanish-speaking in Boston.
TABLE OF ACKNOWLEDGEMENTS INTRODUCTION Chapter I. PART I. CONTEXT IMMIGRATION AND MIGRATION II. -SPANISH-SPEAKING IN BOSTON III. THE SCHOOL SYSTEM RESPONSE
. .23
. . . . 30
41 16
IV. INFORMATION RELEVANT THE SPANISH-SPEAKING TO THE EDUCATION OF IN BOSTON Research on Bilingua Evaluation of Boston the Spanish-Speaking the E C. Information on and Problems o in Boston D. Conclusion
PART II. CASE V. INTRODUCTION . lism Projects ducati 52 for 54 onal Nee f the Spanish-Speaki STUDIES Participants Chronology
VI. ENGLISH AS A SECOND LANGUAGE
A. Precedents . . . B. Program Initiation C. Program Operations and D. Parental and Community E. Educational Goals . . anni ng vol veme 56 60 63 . 64 67 72 73 73 77 78 85 86 . 51 CONTENTS .
VII. TITLE VII. BILINGUAL EDUCATION .8 Program Initiation
Initial Planning
Program Operations
Parental and Commu
Educational Goals VIII. BILINGUAL TRANSITIONAL
and Planning nity Involvement CLUSTERS . Program Initial Program Parental Educatio Ini ti ation Planning Operations and Commun nal Goals IX. BLACKSTONE SCHOOL
Initial Planning Problems of Planning Involvement a nd Community . . . 128 . . . 138 X. SUMMARY . Program Initial Program Parental Init Plan Oper and - E . Educational F. Conclusion CONCLUSION . . iation . ning . .
ations and Plan Community Invo Goals . . Department Planning Co Educational Planning Mo Involvement Some Ideas of Biling nstraints Goals . del of Parti ual Education sans . . EPILOGUE . 234 . . . 236 . 108 . n and i ty Pl ann Invol i ng veme 109 114 119 122 124 128 149 i ng vement 150 152 158 160 163 165 . 180 181 185 189 200 204 211 .. . .88 MET-HODOLOGY
APPENDIX A Information Relevant to the Educational Needs and Problems of the
Spanish-speaking in Boston 2.8 I. RESEARCH ON BILINGUALISM . A. Bilinguali B. Bilinguali C. Method of and Thought and Academic Introduction Language . . . Bilingualism and Conclusion . . rocesses . Achievement of the Second Biculturali sm . 251 . 256 262 268 273 II. EVALUATION OF BOSTON PROJECTS
FOR THE SPANISH-SPEAKING
A. Description of Evaluations B. Problems and Limitations of
Evaluations . . . .
C. Conclusion . . . . .
III. DATA ON THE EDUCATIONAL NEEDS AND PROBLEMS OF THE SPANISH-SPEAKING
IN BOSTON . . . .
Primary Studies . . .
Estimates of the School-aged Ch Other Information on Edacation
and Schooling . . . .
Adult Education and Pre-School Conclusion . . . . . 2Q ildren . 297 ..301 Programs. 306 311 APPENDIX B Th and Implicati e Spanish-speaking ons of Educational Project Analysis Variables.
A. LANGUAGE DEVELOPMENT OF BOSTON'S
SPANISH-SPEAKING . . .
B. INTEREST IN ADULT EDUCATION CLASSES C. SCHOOLING AND EDUCATION OF CHILDREN D. THE POTENTIAL FOR INVOLVEMENT IN
SCHOOL AND EDUCATIONAL ISSUES
E. CONCLUSIONS . . . . F. TABLES. . . . . . . 321 323 333 342 348 . . 355 BIBLIOGRAPHY .. . . .249 277 277 282 288 292 . 315 . . . 248 416
LIST OF TABLES
A. Size of Birthplace by Country of Childhood -B. Reasons Came to the United States
of Childhood . . . . .
by Country
C. Work Situation of Spanish-Speaking by Country of Childhood . . . . . . . .
D. Evaluation of Present Economic
Country of Childhood E. Comparison Si tuation F. Ability of Present Economic in Homeland . Si tuati on Si tuati on
to Read Spanish by Country
wi th of Childhood. G. Ability to Childhood H. Ability to Childhood I. Ab-ility to
Write Spanish by Country of
. . .35
Speak English by Country of
. .37
Read English by Country of Childhood. 37 J. Ability to
Childhood K. Contacted b
Childhood
Write English by Country of
. .37 1970 Census by Country of . . . .38 L. Of Those Forms in Contacted, Spanish .
Those who Recei ved
M. Belief That Americans
Country of Childhood
N. Discrimination in the of Childhood .
0. Boston School Syst Spanish-Speaking .
Help One Another by United States by Country
40 em Responses to the 45 31 Census 38
P. Census of Children and Teachers in the Boston Public Schools, 1968-1969 . . . .
Q. Census of Children in Boston Public Elementary, Intermediate, and High Schools, 1968
APPENDIX A TABLES
46 47
One. Number of Grade Levels Behind Whites
(Coleman Report) . . . 257
Two. Mean IQ Scores
School Children i Indigenous . . ree. Percentage Children Aged in School (BRA and Reading n New York,, of Famil Six or Ov data) ies ha Grade Levels of In-Migrants and
ving One or More
er who are not Registered
Four. ABCD-BC data on Attending School .
Percentage of Children not
.0 . . . . .
APPENDIX B TABLES
One. Percentage Compa Unweighted Samples Two. Percentage Compa
Un.weighted Samples
Three. Percentage Com
Unweighted Samples
rison of Weighted and
(Table Seventeen) rison of Weighted and
(Table Twenty-One) . parison of Weighted and
(Table Fourteen) . Four. Percentage Comparison of Weighted
Unweighted Samples (Table Sixty) . and
Five. Percentage Comparison of Weighted and
Unweighted Samples (Table Fifty-Six)
Six. Percentage Comparison of Weighted and Unweighted Samples (Table Forty-Seven) Seven. Ability to Read Spanish Compared with
Country of Childhood . . . . Eight. Ability to Write Spanish Compared with
Country of Childhood . . . . Nine. Ability to Speak English Compared with
Country of Childhood . . . . 355 356 . 357 . . 358 . . 359 360 . . 361 361 . . 362 258 298 . 300
Ten. Ability to Read English Compared with
Country of Childhood . . .
Eleven. Ability to Write
Country of Childhood Twel ve.
with
English Compared with Year of Arrival on Mainland Compared
Country of Childhood . . Thirteen. Year of Arrival on Mainland
with Ability to Write Spanish
Fourteen. Year of Arrival on Mainland
with Ability to Speak English
Compared Compared Fi fteen. wi th Sixteen. with
Year of Arrival on Mainland Ability to Read English .
Year of Arrival Ability to Write on Mainland English . Compared Compared . . 365 . . 366
Sevehteen. Interest in Improving Re Writing of Spanish Compared with Read Spanish . . . . Eighteen. Interest in Writing of Spanish Write Spanish . . Nineteen. Interest in Wr'iting of English -Speak English . . ading and Ability Improving Reading and Compared with Ability
Improving Reading and Compared'with Ability
Twenty. Interest in Improving Rea of English Compared with Abili
English . . . .
ding and Writing
ty to Read
Twenty-One. Interest in Improving Reading and
Writing of English Compared with Ability to Write English . . . .
Twenty-Two. Interest in Improving Reading and Writing of English Compared with Interest in Improving Reading and Writing of Spanish .
Twenty-Three. Interest in Improving Writing of English Compared with
Read Spanish . . . . Reading Abi 1 i ty and to Twenty-Four. Interest Writing of English Write Spanish . .
in Improving Reading and
Compared with Ability to . .362 363 363 364 365 . .366 367 367 368 . . . 368 369 370 . . 370
Twenty-Five. Writing Arrival
Interest in Improving of English Compared with on Mainland . Reading and Year of . .371 Twenty-Six Wri ti n Visits g of wi t I h Twenty-Seven. Writing of Spent Watch Twenty-Ei ght. Writing of a Radio . Twenty-Nine. I Writing of nterest English Non-Spa Interest English ing Tele Interes English nterest English in Improving Compared with nish-Speaking in Improving Compared with vision . t in Improvin Compared with in Improving Compared wit Reading and Frequency Neighbors Reading an Hours per of d Day g Reading and Possession of Reading and h Income Thirty. In of Engl Educati Thirty-One. Writing o Education terest in ish Compa on Parent Im red De Interest i f English Helps to
proving Reading and Writing
with Minimum Level of sires for Child .
n Improving Reading and Compared with Belief that Better One's Situation
Thirty-Two. Interest in Improving Reading and
Writing of English Compared with Interest In
Homeland Activities . . . . Thirty-Three. Interest Writing of English of Discrimination i Thirty-Four. Interest Writing of English Membership . Thirty-Five. Interest Writing of English Amount in Common wi of Boston . Thirty-Six. Interest Writing of English of Organizational Speaking . . . in Improvin Compared wi n Boston . in Improvin Compared wi Reading and Perception .. .378 g Reading and th Organizational . . . .379 in Improving Reading and Compared with Concept of
th Spanish-Speaking Community . . . .380
in Improving Reading and Compared with Evaluation
Potential of the
Spanish-. . . .381 372 373 374 375 376 377 ..377
Thirty-Seven. Interest in Improving Writing of English Compared with a Course in English .
Thi rty-Eight.
with HavingYear of Arrival onTaken a Course in
Reading and Having Taken Mainland Compared English Thirty-Nine. Interest Writing of English Attending English Paid $50 Weekly
in Improving Reading and Compared with Interest in Classes if Respondent Was
.- 383. Forty. Interest in Improving Reading and Writing
of English Compared with Interest in Attending English Classes at Night if Respondent Was
Paid "A Small Sum" . . . 384
Forty-One. Interest in Improving Re
Writing of English Compared with in Attending Classes if Paid $30 Plus Lunch and Transportation
Forty-Two. Assessment of Schools'
Spanish-Speaking Compared with Personnel Home Visits
ading and Interest
.00 Monthly
Effort for
Number of School
Forty-Three. Visits of Spanish-Speaking School Personnel Compared with Assessment of Schools' Effort for Spanish-Speaking . . .
- 385
. 386 Forty-Four. Children Having Problems in School
Compared with Number of School Personnel
Home Visits . . . 386
Forty-Five. Minimum Level of Education Parent Desires for Child Compared with Number of
School Personnel Home Visits . . . . . . . 387
Forty-Six. Country of Parent's Childhood Compared
With Sending Children to School . . . 388
Forty-Seven. Assessment of Schools' Effort for Spanish-Speaking Compared with Number of
Children in Pre-School Programs . . . . . . 389
Forty-Eight. Assessment of Schools' Effort Spanish-Speaking Compared with Interest Sending Child to a Day-Care Center . . Forty-Nine.
Compared
for in
390 Children Having Trouble in School
with Country of Parent's Childhood 391 . 382
. 382
Language-Domi nance Preference for ldren's Classes Compared with Ability Read Spanish . . . . . . . .
Fifty-One. Language-Dominance
Children's Classes Compared to Read English .
Preference for
with Ability 392
Fifty-Two. Language-Dominance Preference fo Children's Classes Compared with Interes
in Improving Reading and Writing of Engl
Fi fty-T Chi in Fifty-Fo Chi 1 Arri r t i sh hree. Language-Dominance Preference for
ldren's Classes Compared with Interest Improving Reading and Writing of Spanish
ur. Language-Dominance Preference for
dren's Classes Compared with Year of val on Mainland . . . . . Fifty-Five. Chi 1 dren' of School Language-Dominance s Classes Compared
s' Effort for Spani
Preference for with.Assessment
sh-Speaking .. Fifty-Six. Language-Dominance
Children's Classes Compared Parent's Childhood .
Preference for with Country of
. .395 Fifty-Seven. Language-Dominance Preference
Children's Classes Compared with Number School Personnel Home Visits . .
for of 396 Fifty-Eight. Parental in School as Long Country of Parent' Desire for s Possible Childhood. Child to Remain Compared with . .397 Fifty-Nine. School as
Parental Desire for
Long as Possible
Child to Remain in
Compared with Income.
Sixty.
fo Ch
Minimum Level of Education Parent Desires
Child Compared with Country of Parent's
dhood . . . . . . . - . . . 398
Sixty-One. Country of Childhood Compared with Father's Educational Attainment . . . . Sixty-Two.
Desi res
Minimum Level of Education Parent for Child Compared with Income
Fifty. Chi to 392 393 393 ..394 395 397 399 400
Sixty-Three. Belief that Education
Better One's Situation Compared Helps toWith Income .0 Sixty-Four. Belief that Education
Better One's Situation Comp of Arrival on Mainland . are
Helps to d with Year
.. . .402 Sixty-Five. Belief that Education Helps to
Better One's Situation Compared with
Country of Childhood 402
Sixty-Six. Belief that to "Opinions of Peop
Politicians le Like You" with Country of Childhood .
Pay Attention Compared -- -403 Sixty-Seven. Boston Co Si xty-Ei ght. with Coun Si xt Perception mpared with of Discrimi Country of Organi zati onal Me try of Childhood -y-Nine. Organization
with Year of Arrival
Seventy. with Organizational Income nation in Childhood 404 mbership Compared -- -405 al Membership on Mainland Membership Co Compared 405 mpared 406 Seventy-One. Ex Community Af Childhood . pressed Interest in fairs Compared with Seventy-Two. Expressed Community Affairs C on Mainland Interest ompared wi Local Country of Local Year of Arrival . . . 408
Seventy-Three. Concept of Amount
Spanish-Speaking Community of with Country of Childhood . Seventy-Four. Concept of Amount in
Spanish-Speaking Community of Bo
with Year of Arrival on Mainland
in Common with Boston Compared 409 Common with ston Compar ed 410 Seventy-Five. Opinion of
Who have the Same Goal Compared with Country
Means by which Should Achiev of Childhood . People e that Goal 411 407 .401
Seventy-who Goal Six. have Comp Opi the ared
nion of Means by which Same Goal Should Achie
with Year of Arrival
People ve that
on Mainland
Seventy-Seven. Evaluation of Organizational Potential of the Spanish-Speaking Compared
Country of Childhood . . . . .
with
. 413
Seventy-Eight. Evaluation Potential of the Spani Year of Arrival on Mai
of Organizational
sh-Speaking Compared nland . . .
Seventy-Nine. Assessment of Schools' Effort
for Spanish-Speaking Compared with Evaluation of Organizational Potential of the
Spanish-Speaking . . . . MAP .pnih-p.kngi .s.n24 412 wi th 414 415 Spanish-Speaking in Boston
INTRODUCTION
This thesis is a synthesis of two main threads
in my life--an interest in Latin America and a concern
about contemporary America. My mother claimed that she
wove the first thread when she read me Donald Duck
goes to Latin America, and thus, so began my interest
in Latin America. My first academic work on Latin America was in sixth grade where we made a Latin
American scrapbook. Mine was a diary of an imaginary tour of all the Latin American countries. Since that time the main interest of my academic career has been Latin American studies. Two years in the Peace Corps in Vefezuela was the most personally meaningful extension of this educational process.
After two years in graduate school in Latin American studies I felt the need to develop some kind of skill to complement my interest in Latin America.
So I applied to planning school. I took a course on Model Cities. introduced me to what I feel is
concern about contemporary Ameri
struggle I had become involved i Venezuela was also taking place
T T the ca. ni in he first semester he related field second
thread--I saw that the n my barrio in this country. Ju here work human st as
18
real, and perhaps more immediate, because this is
my country.
When it came time for me to select a thesis topic It wa Spani I dec ob vi h-spe I w effort sho to a group to work wi which woul from which experienc was hopin activist that dne Spanish-s ideal, it thesis on Needless that I ha tions. I efforts--I these edu u t
ided that I should combine these two threads ous that I should write a thesis about the
aking in Boston.
as also committed to the idea that this ld not be wasted. That it should be useful of people involved in the struggle. I hoped h a community group and develop information
be useful to them, tailored -to their needs, I could write a theses. I'had had the
of writing a purely academic thesis and that this thesis would reflect my own
orientation. It did not take long to discover
of the main articulat peaking community was
seemed obvious to me education for the Sp to say, I knew nothin d spent most of my li
was hoping to look a schools, social agenc
have spent the last cational institutions ed concerns education. that I shou ani sh-speaki g about educ fe in educat t various ki ies, jails, year and a h -- the Boston of Fo ld ng ati ion nds and al f Pu th 11 wr in on al 0 w 0 bl e owing my ite my Boston. except i nsti tu-f education hat-have-yo n one of ic Schools. I was unsuccessful in finding
u.
.
work. I do not believe there is a community group in Boston concerned about education which is ready to use information such as I have developed. As it turns out, I believe that the school system itself could use this information.
The format of the thesis reflects where I have been in these last two years. Primarily, it reflects
my concern to develop information which can be used by
others. It also reflects what came to be the most compelling aspects of the topic to me--the issues and dilemmas which shape the education and educational planning for the Spanish-speaking. And, finally, the
thesis is an exploration into the field, a testing of what I would do if I were a planner dealing with these
issues.
The thesis is organized in the following manner: I will first provide you with some information on the context of the education of the Spanish-speaking in
Boston. I will then turn to the programs which have been
developed for the Spanish-speaking, discussing four main aspects of each program: program initiation, initial and program planning, parental and community involvement, and basic education assumptions inherent in the program. I will conclude with the discussion of the newly-formed Department of Bilingual Education, presenting what I see as the central issues of education for the Spanish-speaking
20
and some policy recommendations. I will use the Appendices to include several essays on information
relevant to education of the Spanish-speaking in Boston but tangential to the focus of this thesis.
PART I
There are a few t
which will help y system's response discuss the natur
and migration to
immigrations to t
information about
Spanish-speaking nature of the Bos Spanish-speaking.
opics which I will ou understand the
s to the Spanish-s e of the Spanish-s
Boston, comparing
he city. I will g the general condi in Boston. I will ton Public Schools And, finally, I
presentation of information
the Spanish-speaking in Bos
research on bilingualism an evaluati-on of projects in B
developed on the Spanish-sp educational needs and probl
of this information can be thesis.)
I hope that this co
understanding of some of th studies take place, basic i population and their educat insight into some of the is of the Spanish-speaking pop
relevant ton, i d bili oston, eaki ng ems. found briefly present
setting of the school peaking. I will
peaking immigration
it with previous ive some brief tions of the
briefly describe the
responses to the will make a brief
to the education
ncluding a review of the ngual education, the
and data which has been population, on their
(A more extensive treatment in Appendix A of this
ntext will provide e setting i nformation ional needs sues which ul ati on. you with
n which the case
on the Spanish-speaking
and problems, and relate to education
CHAPTER I
IMMIGRANTS AND MIGRATION
Boston has always impressed me as a city of
immigrants. There are so many communities--the North End, South Boston, East Boston, Chelsea, Chinatown, and
the late West End--where the "old immigrants" have
settled and made their homes. And, there are the Blacks who have come to Boston more recently and settled in the
South End, Roxbury, and now Mattapan.
The Spanish-speakers are the newcomers. They
have come from all over Latin America and Puerto Rico.
The two largest groups are the Puerto Ricans and the Cubans. They have come to Boston for different reasons.
The Puerto Ricans first came to New England as migrant
farm workers after World War II. Some came to Boston
and settled.
In 1960 there were just less than 1000 Puerto Ricans in the city. Since 1960 the number of Puerto Ricans has increased sharply. The 1970 census figures have not been released; the estimate of Puerto Ricans ranges from 10,000 to 22,000. Refugee Cubans have also come to Boston during the sixties, with perhaps up to 5,000 by the end of the decade. Other Latin Americans,
MAP 2
? -
-Puerto Rican
0 Cban and th~>#1,
j\i
-
crn
71 T1 A
A
p s to( ritt s cc P4numbering the total 28,000.
several thousand, have come, too. This makes Spanish-speaking population between 17,000 and
The Spanish-speaking will experience the strains and tensions of their uprooted situation as have other
immigrant groups before them. They will know the conflicts between generations, the strain between the pressures
for assimilation and the maintenance of a separate identity. They will have mixed feelings about their homelands,
lack of self-confidence and problems of self-identity.
The Puerto Ricans share a common experience with other migrants--the Blacks and Appalachian Whites.'
They are citizens of this country, and yet foreigners.
By law they share the duties and rights of every citizen,
but they do not share the majority's life style and culture. The Puerto Rican position in this country is even more removed--he comes from an island separated
from the mainland, and does not even speak the language.
There are unique conditions of the Spanish-speaking population which distinguish it from the "old" immigrant
groups. The previous immigrants arrived in Boston in an era of rapid economic expansion. Unskilled or semi-skilled
'"These Appalachian Whites--of the oldest and
purest U.S. stock--have at least as much initial difficulty adjusting to the city as do the Negroes and the Puerto
Ricans." (Charles E. Silberman, "The City and the Negro,"
in Education of the Disadvantaged, ed. by A. Harry Passow, Miriam Foldberg and Abraham J. Tannebaum (New York:
laborers with little or no could find
did not set
chances for expanding a opportuniti and usuall Their lack from the n found that and that h profession married an the Spanis age, which the popula proportion communit, arrive; seems to y 0 e a d h t nc i hE be
jobs. The lack of experience and education
them too apart from the norm. However, today's employment are slim. The economy is not
s rapidly, there are only limited employment es for unskilled and semi-skilled workers,
there are schooling and language criteria.
of education and experience sets them apart rm. Even the professional from Cuba has his degrees are not acceptable in the States
must learn English before he can pursue his 1 career. Finally, a large number of
women--single--have participated in the influx of
-speaking. Many are young, of child-bearing heightens the possibility of marriages within
ion and means that there will be a sizable
of the population which will be children. ther unique feature of the Spanish-speaking s that many of them are citizens when they y are Puerto Ricans. Yet their citizenship
of little asset to them. They encounter the
same dislocations not speak the lan
as if guage;
they were foreigners: they do their culture is alien; their
2C. Wright Mills, Clarence Senior, and Rose Kohn
Goldson, The Puerto Rican Journey (New York: Russell and Russell, 1950), p. 87.
Engl ish ability education and
social patterns d
against. All the assimilation, pre Yet, ironically,
ifferent; and clues around
ssure them to they are Ameri
they are discriminated them pressure toward
become Americanized.
cans.
The Puerto Rican migration to the mainland is
The decision to re no red tape, n kept on their ar s, they are the f
eral air flights fare is low. Th
with their famil
s frequent exchan to the island is ure, and it is po come to Boston is o qu ri va i rst dai 1 ose ies ge o not ssib otas, no vi 1. And, as airborn im y from the who do come and friends f visits. traumatic; le, politic sas Cl mig i sl .ma on Fin it all not monumental; , and no arence Senior rants--there and to Boston intain close the island; ally, the is not a sign y and economically. Thus the move here is not permanent; many have returned
to the island.
There has not developed in the Spanish-speaking
or Puerto Rican populations a strong sense of mutual
support, common to other immigrants groups such as the Italians and the Irish. There is no community which will
help to buffer the effects of social and personal di
sorienta-tion resulting from the move to Boston. Reasons for the
absence of the sense of community are numerous. Within
the Spanish-speaking community there are many nationalities. The sense of nationalism tends to produce divisions
within the population; traditional antipathies, such as that between Cubans and Puerto Ricans., are not easily
unique. there a records suggest are sev and the contact there i return of fail
28
overcome. Also, within the population there is a wide range of social and economic levels, which tend to be divisive. Some because of their previous status (and
"acceptable" light color) can easily assimilate into the larger society; others face the many barriers to
integration. Finally, there is a high mobility within the population. For the Puerto Ricans there is the mobility between the island and Boston. Also for most, there is mobility within the city. There is no one geographical area which has become the center of the
Spanish-speaking or Puerto Rican community. There is no
one place where enough housing is available. Limited
low-income housing stock, the vast demolition connected
with urban renewal, the scatterization effect of public housing and general decay of the. central city has necessi-tated.the location of the population wherever housing could be found. And there is constant movement of the population within the city in search of'better housing.
The Puerto Ricans are not moving toward
assimila-tion. Glazer and Moynihan recently revised their assessment of the direction the Puerto Ricans in New York City are going.
. when we wrote Beyond the Melting Pot, the alternative seemed to lie between assimilation and
ethnic group status; they now seem to lie somewhere between ethnic group status and separation . .
3Nathan Glazer and Daniel Patrick Moynihan, Beyond the Melting Pot, 2nd ed. (Cambridge: M.I.T. Press, 1910 p. xxiii.
Joshua Fishman, drawing from an extensive
socio-linguistic study of a New York Puerto Rican community, echoed the Glazer and Moynihan position.
maintenance of Spanish is a reality among
New York Puerto Ricans because they do associate language with this most important cluster-family kinship, and ethnic ties . . . Spanish is not only necessary for conversation with aged grandparents,
but also with younger relatives in Puerto Rico
who frequently visit and who are frequently visited. The language, social patterns and culture are being
maintained. However, their perception of the Puerto Rican's status vis-a-vis the larger society is also important.
Puerto Ricans still see themselves in the immigrant-ethnic model; that is they see their
poor economic and political position as reflecting recency of arrival and evil circumstances that can still be overcome. They have an explanation for
their poor circumstances that does not demand revolutionary change . . 5
The Puerto Ricans see themselves as gradually being
assimi-lated into the society. But the future is unclear
if there is no change in their poor economic and political position.
'Joshua Fishman, et. al., "Bilingualism in the
Barrio," August, 1968, ERIC ED 026 546.
(Citations similar to the preceding are references to documents which are available from the Office of
Education, Educational Resources Information Center.
The documents are available from ERIC in hard-back or microfiche. The ones cited in this thesis are available at Longfellow Library, Harvard School of Education.)
CHAPTER II
SPANISH-SPEAKING IN BOSTON
There is little information available on
Spanish-speaking population. This is because of recency of their arrival, their linguistic isola
and high mobility within the city. The most acc data comes from a survey sponsored by the Action Boston Community Development (ABCD) and carried by Dr. David Smith, Institute of Human Sciences Boston College. Five hundred and thirty-five Sp
speaking residents of Boston were interviewed la While the final report has not been released on
study, I was able to use some of the data.1
The majority of the Spanish-speaking hea households in Boston is Puerto Rican (58.7%) Th remainder is 25.3% Cuban, 13.9% from other Latin
countries, and 2.1% born on the mainland. The n
Rican population comes from predominately urban the Puerto Ricans are predominately rural.
the the ti on urate for out of ani sh st su the mme r. ds of e American on-Puerto background;
'An analysis of the educational variables is
included in Appendix B of this thesis. Also, a discussion of the sampling methodology and reliability of the data is presented. In the tables which follow I have used the
weighted sample. This sample was derived from the
unweighted sample (N=535) and is designed to be representa-tive of the total Spanish-speaking population in Boston.
TABLE A
SIZE OF BIRTHPLACE BY COUNTRY OF CHILDHOOD (N=7198)
COUNTRY OF CHILDHOOD SIZE OF COMMUNITY Rural Under 10,000 50,000 Over ,000 ,000 ,000 ,000 Total of all Spanish-Speaking 12.9% 28.9 25.4 13.2 19.6 100.0% U.S. 5.7% 0 0 13.3 80.0 Puerto Rico 20.0% 36.3 29.4 10.0 4.2 Cuba Other 2.8% 20.8 23.0 17.2 36. 1 2.0% 16.3 17.1 19.2 45.4 100.0% 99.9% 99.9% 100.0% (150) (4244) (1826) (1008) TABLE B REASONS CAME TO THE UNITED STATES (N=7 320) COUNTRY BY COUNTRY OF CHILDHOOD OF CHILDHOOD Total of all Spanish-Speaking U.S. REASONS Political . Economic Meet Spouse Meet Relatives Job Intention agriculture other Job Promise agriculture other Other 24.2% 35.6 4.8 9.6 4.4 4.3 .1 .3 16.7 100.0% 0 13.3% 6.7 13.3 0 0 0 0 66. 7 Puerto Rico .2% 50.2 7.1 12.6 .2 .2 15.8 Cuba Other 89.5% 9.1% 5.6 32.3 0 4.0 .5 13.1 0 0 0 0 4.4 3.0 2.0 0 1.0 35.5 100.0% 99.9% 100.0% 100.0% (150) (4294) (1868) (1008)
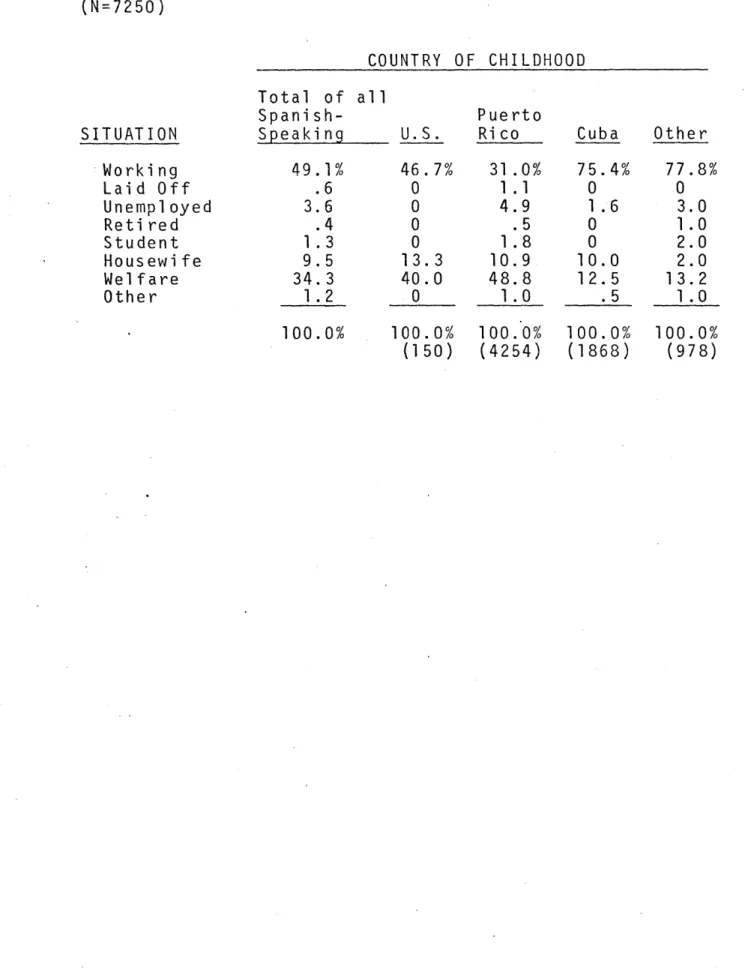
Seventy per in the States since
has come to Boston for Cuba half Lati for than a jo thre Over ti on on w and situ ther here Cuba who wo rs with the lea ns ving came their becaus of the Puerto n Americans cam It would se economic reason a third of the b. In comparis e-fourths of th all, one-third is on welfare; elfare. While mainlanders (66 ation as meager e is a feeling than they were ns were the onl feel that compa
e off here than Spanish and in the Spanish-population can
cent of the population has arrived 1960. And, an even larger percentage
within the last decade. The reasons
omelands vary. Tha majority of the of political reasons. Approximately
Ricans and one-third of the other
e for economic reasons.
em that those Puerto Ricans who came
s would be disappointed, for less
Puerto Ricans have been able to find
on, one-half of the mainlanders and e Cubans and other -Latins are employed. of the total Spanish-speaking
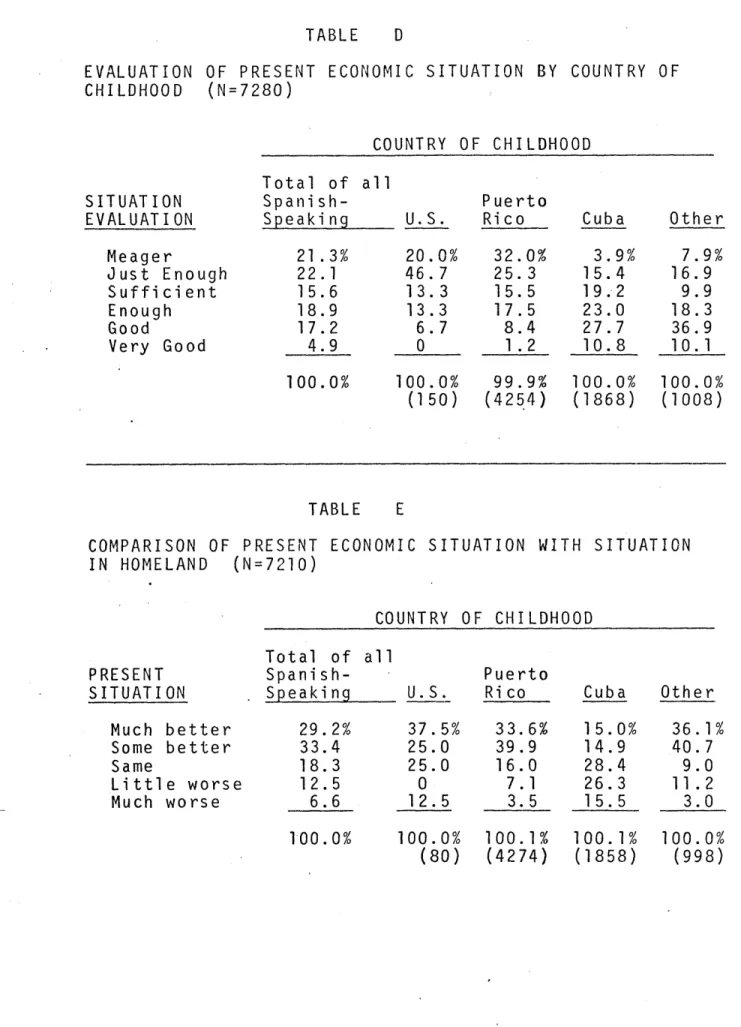
popula-almost half of the Puerto Ricans are most of the Puerto Ricans (57.3%)
.7%) evaluate their own economic
or just barely enough to get by, that things are economically better
or would be in the homeland. The y group with a substantial number (41.8 ratively speaking they are economically
they were in Cuba.
English literacy varies considerably
speaking population in Boston. 76.8% o read Spanish and 75.6% can write it. The Spanish illiteracy is centered in the mainlanders and
%o)
33
TABLE C WORK SITUATION
(N=7250)
OF SPANISH-SPEAKING BY COUNTRY OF CHILDHOOD
COUNTRY OF CHILDHOOD SITUATION Wo r k i n g Laid Off Unemployed Reti red Student Housewife Wel fare Other Total of Spanish-all Speaking U.S. 49.1% .6 3.6 .4 1.3 9.5 34.3 1.2 100.0% 46.7% 0 0 0 0 13.3 40.0 0 100.0% (150) Puerto Rico 31.0% 1.1 4.9 .5 1.8 10.9, 48.8 1.0 100. 0% (4254) Cuba Other 75.4% 0 1.6 0 0 10.0 12.5 .5 100.0% (1868) 77.8% 0 3.0 1.0 2.0 2.0 13.2 1.0 100.0% (978)
TABLE D EVALUATION
CHILDHOOD
OF PRESENT ECONOMIC SITUATION BY COUNTRY
(N = 7280) COUNTRY OF CHILDHOOD SITUATION EVALUATION Meager Just Enough Sufficient Enough Good Very Good Total of Spani sh-all Speaking U.S. 21 .3% 22.1 15.6 18.9 17.2 4.9 100.0% 20.0% 46. 7 13.3 13.3 6.7 0 Puerto Rico 32.0% 25.3 15.5 17.5 8.4 1.2 100.0% 99.9% (150) (4254) Cuba 3.9% 15.4 19.-2 23.0 27.7 10.8 Other 7.9% 16.9 9.9 18.3 36.9 10.1 100.0% 100.0% (1868) (1008) TABLE E COMPARISON OF IN HOMELAND ( PRESENT N = 7210)
ECONOMIC SITUATION WITH SITUATION
COUNTRY OF CHILDHOOD PRESENT SITUATION Much better Some better Same Little worse Much worse Total of Spanish- all . Speaking U.S. 29.2% 33.4 18.3 12.5 6.6 100.0% 37.5% 25.0 25.0 0 12.5 100.0% (80) Puerto Rico 33.6% 39.9 16.0 7.1 3.5 Cuba Other 15.0% 14.9 28.4 26.3 15.5 100.1% 100.1% (4274) (1858) 36.1% 40.7 9.0 11.2 3.0 100.0% (998) OF
TABLE F
ABILITY TO READ SPANISH BY COUNTRY OF CHILDHOOD (N=6662) COUNTRY OF CHILDHOOD Total of Spanish-all Speaking U.S. 76.8% 11.1 12.1 100.0% 28.6% 28.6 42.9 Puerto Rico 67.6% 13.5 18.9 Cuba Other 90.9 9.1 0 96. 7% 2.2 1.1 100.1% 100.0% 100.0% 100.0% (140) (3800) (1714) (908) TABLE G
ABILITY TO WRITE SPANISH BY COUNTRY OF CHILDHOOD COUNTRY OF CHILDHOOD Total of all Spanish-Speaking U.S. 75.6% 10.5 13.9 100.0% 28.6% 21.4 50.0 Puerto Rico 66.1% 12.4 21.5 Cuba Other 90.3% 9.1 .6 95.6% 3.3 1.1 100.0% 100.0% 100.0% 100.0% (140) (3800) (1714) (908) ABILITY Yes Some No ABILITY (N=6662) Yes Some No
Puerto Ricans. The mainlanders show what is probably a loss or atrophy of their first language. 42.9% cannot read Spanish and 50% cannot write Spanish. Of the Puerto Ricans, 18.9% cannot read Spanish and 21.5% cannot write it.
There has been only a limited acquisition of English.
Of the total Spanish-speaking population, 20.4% can speak
English; 28.2% can read it; 23.5% can write it. Predictably the mainland population has the highest English literacy
level. All can speak and read English and 93.3% can write it. On the other hand, the Puerto Ricans are the
least literate in English. Only 24.4% c.an speak English;
only 22% can read it; only 17.2% can write it.
The language barrier of the Spanish-speaking population tends to isolate the community from normal
channels of access to the larger society and its services. One ex-ample of the lack of access is the very low number of contacts made by the 1970 census takers. 33.5% of the total Spanish-speaking population was not contacted by the census. Almost half (44.6%) of the Puerto Ricans were not contacted. Of those who were, less than 15% were
provided a form in Spanish. Given the low level of English literacy in the population, there is little chance that the census data on the population will be reliable.
We have briefly discussed some objective measures of the conditions of the Spanish-speaking in Boston. We have seen that most of the population feels that their
37 TABLE H
ABILITY TO SPEAK ENGLISH BY COUNTRY OF CHILDHOOD (N=7290) COUNTRY OF CHILDHOOD Total of all Spanish-Speaking 30.4% 43.4 26.3 100.0% U.S. 100.0% 0 0 Puerto Rico 24.4% 44.0 31.5 Cuba Other 35.7% 43.7 20.7 35.3% 46.4 18.3 100.0% 99.9% 100.1% 100.0% (150) (4264-) (1868) (1008) TABLE I
ABILITY TO READ ENGLISH BY COUNTRY OF CHILDHOOD (N=7310) COUNTRY OF CHILDHOOD Total of all Spanish-Speaking U.S. 28.2% 30.2 41.6 100.0% 100.0% 0. 0 Puerto Rico 22.0% 27.0 51.0 100.0% 100.0% 100.0% (150) (4294) (1868) TABLE J
ABILITY TO WRITE ENGLISH BY COUNTRY OF CHILDHOOD (N = 7320)
COUNTRY OF CHILDHOOD Total of all Spanish-Speaking U.S. 23.5% 21.0 55.5 100.0% Puerto Rico 93.3% 17.2% 0 15.6 6.7 67.1 100.0% 99.9% (150) (4294) Cuba Other 31.2% 25.4% 29.6 31.2 39.3 43.4 100.1% 100.0% (1868) (1008) ABILITY Yes Some No ABILITY Yes Some. No Cuba 35.4% 37.3 27. 3 Other 30.7% 35.7 33.7 100.1% (998) ABILITY Yes Some No
38
TABLE K
CONTACTED BY 1970 CENSUS BY COUNTRY OF CHILDHOOD (N=7290) COUNTRY OF CHILDHOOD CONTACTED Total of Spanish-all Speaking U.S. Puerto
Rico Cuba Other 73.7% 55.4% 79.6% 88.1% 26.3 44.6 20.4 11.9 100.0% (150) 100.0% (4264) 100.0% (1868) 100.0% (1008) TABLE L OF THOSE SPANISH CONTACTED, (N=5950)
THOSE WHO RECEIVED CENSUS FORMS IN
COUNTRY OF CHILDHOOD FORMS IN SPANISH Total of all Spanish- -Speaking U.S. 20.0% 28.3% 4.5% 12.8% 80.0 71.7 95.5 87.2 100.0% (110) 100.0% (2392) 100.0% (1570) 100.0% (888) Yes 66.5% 33.5 100.0% Yes 14.8% Puerto Rico Cuba 85.2 100.0% Other
economic perspective and general ou ever, there is some dissatisfaction their assessment of American societ were asked if people helped one ano the Puerto Ricans, 12% of the Cuban Latin Americans, and no mainlanders 53.3% of the mainlanders and 38.5% expressed the opinion that the Amer
for themselves only. Mainlanders a report the greatest feelings of dis
tl o ,w y. the s, re of i ca nd cri ok is bright. How-hich stems from
The interviewees r. Only 5.5% of 13.1% of the other sponded positively.
the Puerto Ricans
n people were out
Puerto Ricans also
mination. 53.9% of the mainlanders and 45.5% of
they encounter a lot or very
the Puerto
much discri
Ricans reported
TABLE M BELIEF THAT AMERICANS
CHILDHOOD (N-7278)
HELP ONE ANOTHER BY COUNTRY OF
COUNTRY OF CHILDHOOD HELP Yes Some yes, some no Out for themselves Total of all Spanish-Speaking U.S.. 8.1% 60.6 31.3 100.0% Puerto
Rico Cuba Other 5.5% 12.0% 13.1% 46.7% 56.0 70.6 63.7 53.3 38.5 17.5 23.2 100.0% (150) 100.0% (4252) 100.1% (1868) 100.0% (1008) TABLE N DISCRIMINATION (N=7278)
IN THE UNITED STATES BY COUNTRY OF CHILDHOOD
COUNTRY OF CHILDHOOD AMOUNT OF DISCRIMINATION None Little Some A lot Very much Total of Spanish-all Speaking U.S. 29.0% 9.3 23.3 21 .5 16.9 100.0% 7.7% 15.4 23.1 15.4 38.5 100.0%
(150)
Puerto Rico 19.9% 7.6 26.6 26.0 19.9 100.0% (4252) Cuba Other 52.1% 11.5 16.7 10.4 9.4 100.0% (1868) 46.0% 14.3 15.9 15.9 7.9 100.0% (1008)CHAPTER III
THE SCHOOL SYSTEM RESPONSE
The rapid growth of the Spanish-speaking has taken place within a national context of urgency. In the last decade we have seen the rise of the "urban crisis" and the fall of the "melting pot" myths. The Blacks have drawn attention to the decay
of our cities and the inhumanity of the social conditions in whi-ch they live. They have
the idea of Black power and pri group identity based on shared Blacks have demanded of the Ame make a commitment to the realiz
ideal of cultural pluralism. One focus of the Black schools. In Boston there have
part of the Black community to
struggled and set de, of a struggle culture and experi rican system that ation of the Ameri
struggle has been been many efforts change the public
schools. School boycotts and strikes, electoral efforts, lobbying, pressuring, negotiating and disruptions have all punctuated the decade. And the struggle
forth for ence. it can the on the
42
continues.1 METCO busses Black children to suburban schools, to free them from the chains of the Boston schools. Free schools are growing throughout the city
as educational alternatives.
But the one vital school system model for schools all over the country, and.noted for its pro-gressiveness, has been slow to shape its responses.
The public schools are facing a myriad of problems.
Many of the facilities are old and decaying. There has been an influx of minority groups and departure of
the middle class and the greatly needed tax base. The
bureaucracy of the system has grown
and
is well-entrenched;it is over 90% white.
The administration, the School Committee, the teachers, the city's political ethnic past, its geographical and political situation, its economy, all fit together to produce an attitude and set of
practices that keep the school system functioning and basically undisturbed. 2
Now the Spanish-speaking are making demands on the school system. The Spanish-speaking are sending their children to the schools, with high expectations for their
'For stories of this struggle see William Ryan, "Strategies for Change: A Case Study of the Struggles
to Integrate Boston's Schools," September, 1967 (mimeographed); Barbara Jackson, "Roxbury Alternatives to the Neighborhood
School," revised edition, January, 1969 (mimeographed);
Peter Schrag, Village School Downtown (Boston: Beacon Press, 1967); Jonathan Kozol, Death at an Early Age (New York:
Bantam Books, 1967).
43 success. social a The Span school, able to However, school s doing we children present out in 1 Span noth coul Day i sh-ing. d be Scho
The school is seen as the one source for
nd economic mobility for the immigrant population. ish-speaking feel that if their children go to learn English and graduate, that they will be get a job and get along in American society.
the Spanish-speaking are~realizing that the
ystem is failing them also. The children are not 11 in school, academically nor socially. The
are the brunt of the discriminatory attitudes in the school system. The children are dropping arge numbers.'
The school system has developed programs for the speaking. It had to start from practically
The only program which it was operating which drawn upon for the Spanish-speaking was the ol for Immigrants, recently renamed the English
3This myth has been romanticized. For a critique
see Charles E. Silberman, Crisis in the Classroom (New York: Random House, 1970), pp. 53-61.
4The number of children that drop out each
year is not really known. In a recent statement by the Superintendent of Schools, William Ohrenberger, it was reported that of the 176 Puerto Rican high school
students, 12 freshmen and 5 sophomores (no juniors or seniors) had dropped out in the 1970-1971 school year.
This is questionable and does not include the drop out
of other Latin Americans nor of younger children. (William H. Ohrenberger, "Statement Before the Massachusetts
State Advisory Committee to the U. S. Commission on Civil Rights" (12 May 1971, Mimeographed), p. 6
44
Language Center. An English as a Second Language program was started in September, 1967; Title VII, Bilingual
Education program in September, 1968; and the Bilingual Transitional Clusters in January, 1970. The Department of Bilingual Education was created in September, 1970, to coordinate these responses. It is important to emphasize at this point that the responses, like Topsy, just grew. It was only at the point that there were over
a million dollars and four major programs involved that
the school system developed the Department of Bilingual Education.
These programs have come into existence within
a short period of time. During this time the student population has grown rapidly.
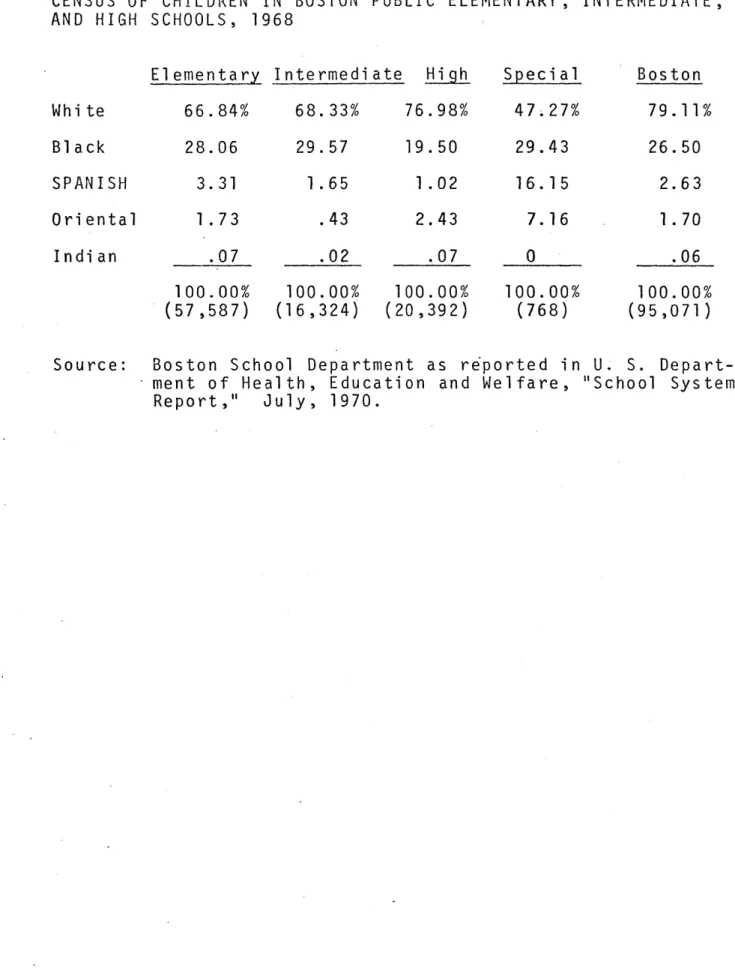
Collection of data on the number of Spanish-speaking children in the Boston Public Schools is very difficult.
On the following pages I have included the most complete
set of data, though it is dated. From the 1968 to the 1969 school year, the Spanish-speaking children increased in number from 2,505 (or 2.63% of the total) to 3,505
(3.8%); this represents a 28% increase in student
population, making them the most rapidly growing minority except the very small number of American Indians. The growth has been primarily in elementary school level. The growth of the number of Spanish-American teachers
TABLE 0
BOSTON SCHOOL SYSTEM RESPONSES TO THE SPANISH-SPEAKING
Program English Language Center English as a Second Language Bilingual Education Bilingual T ransi ti onal Clusters No. of Pupils Started Ages 1970-1 1911 14-18; adults 390 1967 all grades 600 1968 Jan. 1970 6-14 160 No. of Spanish-Speaking Pupils c.100 (30%) 520 160 6-14 250 250 Funding City 1/3 classes from federal via Title I, ESEA; 2/3 city Federal,
Title VII, ESEA
46 TABLE P CENSUS OF SCHOOLS, CHILDREN AND 1968-1969
TEACHERS IN THE BOSTON PUBLIC
STUDENTS 1969 TEACHERS 1969 White Bl ack SPANISH-AMERICAN Oriental American Indians Source: U. S. 'School System 68,703 (69.11%) 25,190 (26.50%) 2,505
(
2.63%) 1,617(
1.70%) 56 ( 95,071 .06%) 62,657 (66.03%) 27,276 (28.75%) 3,205(
3.38%) 1,643(
1.73%) 106 ( 94,887 Department of Health, Report," July, 1970. 4251 (94.6%) 226 ( 5.0%) 10 ( .11%) 0 4495Education, and Welfare, 1968
.2%) .2%)
47
TABLE Q CENSUS OF CHILDREN IN BOSTON AND HIGH SCHOOLS, 1968
PUBLIC ELEMENTARY, INTERMEDIATE,
Whi te Black SPANISH Oriental Indi an Source: Elementary 66.84% 28.06 3.31 1 .73 .07 100.00% (57,587) Boston Sch -ment of He Report," Intermediate High 68.33% 76.98% 29.57 19.50 1.65 1.02 .43 2.43 Special 47.27% 29.43 16.15 7.16 .02 .07 0 100.00% 100.00% (16,324) (20,392) 100.00% (768)
ool Department as reported in alth, Education and Welfare, July, 1970. Boston 79.11% 26.50 2.63 1 .70 .06 100.00% (95,071) U. S. Depart-School System
48
has not kept pace. In 1969 there were only 10 (0.2% of the total) Spanish-American teachers in the schools.'
At present, there is no alliance nor sense of a common ca Blacks and of the Blac the struggl the nature Nevertheles repeat the
use against the school system between the Spanish-speaking ks have probably e that Spanish-s of the responses s, the Spanish-s pattern of prote
has been said, enough
it is widely believed
as militant as the Bl for meetings or atten Bilingual educat
the mobilization
Rican boycott of tions which have all of which pro
the Spanish-spea times that acks. d hear ion, especi It is hard t the schools. been put forth bably have some 1. The Puerto king population
However, the strugg-les had some kind of effect on
peaking are undertaking and that the system will give.
peaking will probably not
st against the schools. It
that even if it is not true the Puerto Ricans are not Puerto Ricans will turn out ings at the State House on
ally if the clergy organize o imagine There are to explai val i di ty. Ricans, th in Boston a mas many n thi e , maj are sive Puerto expl ana-s reaction, ority of colonial peoples. (One can say that Puerto Rico is a commonwealth,
5U. S. Department of Health, Education, and Welfare, "School System Report," July, 1970.
is closest to a colony.) They are not accustomed They do associat Boston a authorit and are social a pattern. are will not mai not i on r y r n hav whi e Lati such el ucta d poli The 1 chal ntai to havi e organ ch prom 2. Pu n peopl as the nt to c tical o eaders enged close nor con
ng control over their own lives. ized intermediate levels of
ote interest articulation. erto Ricans and other Latins
e. They have respect for school teachers and administ hallenge this authority. Th rganizations reflect the sam are respected and followed;
is it tact w expected ith their that the le followers rators e e they dership 0
discover their feelings about particular issues. 3. The Spanish-speaking in Bost a new, extremely diverse population. Cohesion, alone a concerted action, around the schools and tional issues would seem highly improbable.
4. The Latins in Boston have ma only one of which is their children's education. are living from day to day, struggling for survi
Schools and education are very abstract concerns a context. on are let educa-ny concerns, Many val. in such
5. The language barrier between the Spanish-speaking and the majority community probably prevents exchange of information and intimidates the
Spanish-speaking, which in turn inhibits them from action against its institutions.
6. The school system has responded to the Spanish-speaking. They have created a number of programs. This activity would tend to mitigate
organization against the schools, since it seems that
the system is trying.
7. There is a group of what I call the educational leaders. They are well-educated, middle-class, and concerned about the education of the Spanish-speaking. They have been active in the past few years and, through pressuring, they have been instrumental in the creation of the present programs. They are recognized by the
system as the legitimate representati'ves of the community.
The contact between the leadership and the Spanish-speaking community is limited. Their modus operandi is productive
and they are not interested in changing, becoming more
aggressive, or broadening the involvement.
In conclusion, the growth of the Spanish-speaking
in Boston creates a challenge to the school system.
With increasing vehemence members of today's second generation--who in Boston are primarily Neqro,
Puerto Rican and Chinese--say that they will not be treated by the schools as earlier groups have been treated. They are asking, not always clearly, that teachers find ways to help ch.ildren mature according to their respective ethnic standards and still teach them the freedom and strength they will need in
contemporary society. They are asking that schools
open new ways of living without ignoring inherited ones.' The challenge to the School Department is to respond to
and respect the diversity of its pupils.
'Joseph Cronin, Organizing An Urban School System for Diversity (Boston: Massachusetts Advisory Council on