HAL Id: hal-00076665
https://hal.archives-ouvertes.fr/hal-00076665
Submitted on 8 Feb 2009
HAL is a multi-disciplinary open access
archive for the deposit and dissemination of
sci-entific research documents, whether they are
pub-lished or not. The documents may come from
teaching and research institutions in France or
abroad, or from public or private research centers.
L’archive ouverte pluridisciplinaire HAL, est
destinée au dépôt et à la diffusion de documents
scientifiques de niveau recherche, publiés ou non,
émanant des établissements d’enseignement et de
recherche français ou étrangers, des laboratoires
publics ou privés.
Eastern Africa - Western Indian Ocean region, and their
relationship with rainfall
Benjamin Pohl, Pierre Camberlin, Pascal Roucou
To cite this version:
Benjamin Pohl, Pierre Camberlin, Pascal Roucou. Typology of pentad circulation anomalies over the
Eastern Africa - Western Indian Ocean region, and their relationship with rainfall. Climate Research,
Inter Research, 2005, 29, pp.111-127. �hal-00076665�
1. INTRODUCTION
The classification of atmospheric circulation patterns has been for decades a focus in climatology. Most of the attempts have concentrated on the mid-latitudes, while the tropics were neglected. In Equatorial East Africa (EEA) in particular, there is still limited knowl-edge of the way circulation patterns are demarcated from each other, and of the possible clustering of these patterns around a few recurrent types.
Previous studies (Johnson & Mörth 1960, Sissons 1966, Okoola 1999a,b) depicted pentad and daily (syn-optic scale) circulation patterns around EEA, but their approach was mainly based on case studies. Only
Johnson & Mörth (1960) tried to classify empirically the most frequently observed atmospheric configurations; their work was essentially based on their experience in synoptical meteorology. The current availability of new datasets, the reanalyses, at the daily timescale and on a worldwide 2.5°× 2.5° regular grid, makes it possible to apply objective partitioning methods in order to obtain consistent atmospheric configuration types. The determination of the most recurrent atmos-pheric patterns obtained by a systematic process may also help to renew and to complement these empirical studies. This study applied a statistical algorithm, known as dynamical cluster analysis, to atmospheric circulation anomaly patterns, in order to obtain an
© Inter-Research 2005 · www.int-res.com *Email: benjamin.pohl@u-bourgogne.fr
Typology of pentad circulation anomalies over the
Eastern Africa–Western Indian Ocean region, and
their relationship with rainfall
Benjamin Pohl*, Pierre Camberlin, Pascal Roucou
Centre de Recherches de Climatologie, Université de Bourgogne, BP 27877, 21078 Dijon, France
ABSTRACT: The aim of this study was to classify the most frequently observed atmospheric circula-tion anomaly patterns in eastern Africa and the adjacent Indian Ocean. As an example of the useful-ness of such a classification, the second objective was to test whether these patterns account for intraseasonal rainfall anomalies in the region. A partitioning algorithm, known as dynamical cluster analysis, was therefore applied to the zonal (U ) and meridional (V ) components of the wind
anom-alies, obtained from the NCEP-NCAR Reanalysis R-2 at the pentad (5 d) timescale. The 3 geopoten-tial levels 850, 700 and 200 hPa were combined. Focus is on the transition seasons (March to May and October to December), which correspond to the 2 East African rainy seasons. The classification domain is large enough (40° latitude × 40° longitude) to describe large-scale anomaly patterns, but it focuses on equatorial and subequatorial atmospheric dynamics. The results consist of 7 major wind anomaly clusters, for which associated atmospheric fields (geopotential height anomalies, precipita-tion anomalies) and the seasonal distribuprecipita-tion were explored. Among them, 2 clusters strongly resem-ble the anomaly patterns associated with the Madden–Julian Oscillation. The other major configura-tions show similarities with recurrent previously observed patterns involved in wet or dry spells over East or Southern Africa. Statistical tests reveal that this partition is able to significantly discriminate rainfall anomalies over the eastern part of the African continent; 4 of the 7 clusters correspond to abnormally wet or dry events over Equatorial East Africa.
KEY WORDS: Dynamical cluster analysis · Eastern Africa · Intraseasonal rainfall variability · Circulation anomaly patterns · Madden–Julian Oscillation
objective partitioning of pentad circulation for a 20 yr period. This methodology has already been used for several climatological analyses (e.g. Desbois et al. 1982, Michelangeli et al. 1995, Moron & Plaut 2003). However, this study constitutes the first application of such an algorithm to atmospheric fields inside the tropical belt.
Such a typology of wind patterns may present some interest for downscaling applications (e.g. the projec-tion of the simulated wind fields at the end of the 21st century under enhanced greenhouse-effect condi-tions). It is also of major interest for the understanding of rainfall variability.
Large areas in the eastern part of the African conti-nent experience dry climatic conditions. Water resource variability strongly impacts major sectors of the economy, such as agriculture (maize production, cotton, tea and coffee plantations, or extensive cattle breeding), and adequate rainfall amounts are a key requirement for much of the rural population. It is therefore highly important to better understand the meteorological phenomena involved in abnormally high or low precipitation amounts. The EEA region experiences a bimodal annual cycle: the 2 rainy sea-sons correspond to the meridional migrations of the Inter-Tropical Convergence Zone (ITCZ), and extend from March to May (MAM) and from October to December (OND). Each of them is marked by a rela-tively high interannual variability, i.e. the seasonal rainfall amounts may vary highly from one year to another. Large-scale teleconnection patterns are clearly found for the OND season (e.g. Beltrando & Cadet 1990, Black et al. 2003), and recent studies sug-gest that interannual variability is the result of intraseasonal fluctuations occurring during the East African rainy seasons. Each 3 mo long rainy season is generally characterized by the alternation of 3 to 4 marked, 5 to 10 d long rainy spells, liable to bring most of the cumulative precipitations amounts, and rela-tively dry phases occurring between 2 consecutive wet periods (Kabanda & Jury 2000, Mpeta & Jury 2001, Camberlin & Okoola 2003). This suggests that compre-hension of intra-seasonal rainfall variability may help in understanding interannual variability. Moreover, understanding the temporal precipitation distribution inside a season is as fundamentally important for agri-cultural yields as seasonal rainfall totals. Rainfall vari-ability is generally approached through correlation or composite analyses, which are adequate if the relation-ship between rainfall and atmospheric circulation is fairly simple and more or less linear, but less than ade-quate if 2 different circulation patterns lead to similar precipitation anomalies. In order to emphasize the use-fulness of the classification, focus here is given to rain-fall applications. A classification of wind anomaly
pat-terns may help to clarify the recurrent atmospheric configurations observed over the region, and their possible relations with such intraseasonal rainfall fluctuations.
The aim of this study was to identify recurrent large-scale circulation anomaly patterns over the eastern part of the African continent and the adjacent Indian Ocean. The corresponding rainfall anomaly patterns were then analysed. The objective was thus to clarify whether dry and wet anomalies observed in the equa-torial regions located on the East African meridian fit into a limited number of discrete and spatially consis-tent large-scale wind anomaly patterns. The approach is original in that, in contrast to previous studies that usually started with the identification of wet/dry events and then analysed simultaneous large-scale atmospheric anomaly patterns, it first defines the most recurrent patterns of atmospheric variability during the 2 EEA rainy seasons (MAM and OND). The follow-ing section presents the data used for this study. Sec-tion 3 depicts the dynamical cluster analysis algorithm. Section 4 presents the main results, based on maps. Those results are then discussed in Section 5.
2. DATA
This study makes use of the National Centre for Environmental Prediction–Department of Energy (NCEP–DOE) Atmospheric Model Intercomparison Project (AMIP-II) Reanalysis (R-2) fields (Kalnay et al. 1996, Kanamitsu et al. 2002). The spatial resolution is 2.5°× 2.5° horizontally, interpolated on 28 vertical lev-els (from 1000 to 10 hPa), and the period of availability begins in January 1979. The dataset is an update of the NCEP–NCAR reanalysis, featuring newer physics and observed soil-moisture forcing, and eliminates several previous errors. Many researchers, including Mutai & Ward (2000), Camberlin & Philippon (2002), Zorita & Tilya (2002) among others, have used this dataset for studies on the region. This study uses the geopotential height and the zonal (U ), meridional (V ) and vertical
(ω) components of the wind (considered as ‘most reli-able’ variables, except for the latter; Kalnay et al. 1996). Fig. 1 depicts, for the 3 levels 850, 700 and 200 hPa, the maps of mean wind fields for MAM and OND. Though the classification itself is applied on the smaller area of the box in Fig. 1, all maps are plotted for an extended domain (30° N–30° S, 10–70° E) in order to show the larger-scale patterns in which the regional circulation is embedded. Some of the major characteristics of the global circulation of the transition periods between the boreal and austral summer mon-soons clearly appear (Fig. 1), such as the northern and the southern trade winds in the lower levels (850 and
700 hPa) and the mid-latitude westerlies at 200 hPa. On average, a belt of low-latitude westerlies appears over the Central Indian Ocean at 850 hPa. These winds are mostly observed during OND, when the Indian Walker cell is strongly developed over these longi-tudes (Hastenrath 2000). The following cluster analysis will concern anomaly fields, and the real circulation will not be considered. Fig. 1 is then (approximately) the mean situation, with respect to which the anomaly fields are calculated. However, it should be remem-bered that the mean fields significantly evolve during MAM and OND: the reference to the fields presented on Fig. 1 is therefore relative.
The GPCP (Global Precipitation Climatology Pro-ject; Huffman et al. 1995, 1997) dataset was used to approximate 5 d rainfall amounts over the African con-tinent and the nearby Indian Ocean. The GPCP algo-rithm merges satellite data and worldwide rainfall observations to approximate precipitation, on both land and sea areas. The data are available from Janu-ary 1979 until today on a 2.5°× 2.5° regular grid. Their reliability has been controlled and discussed by Gruber et al. (2000).
The intraseasonal oscillation was extracted using the multivariate Madden–Julian Oscillation (MJO) indices developed by Wheeler & Hendon (2004) and based on a principal component analysis (PCA) applied to large-scale daily patterns of 850 and 200 hPa zonal wind and outgoing longwave radiation (OLR) at 15° N to 15° S. A pair of indices was obtained corresponding to the 2 first principal components and describing the MJO-related large-scale circulation and convection east-ward propagation (Madden & Julian 1994, Matthews 2000). The oscillation was finally decomposed into its phases (i.e. an angle measurement depending on the location of the enhanced convection cells within the tropics) and its activity (i.e. a distance measurement indicating the strength of the intraseasonal signal).
3. METHODOLOGY: DYNAMICAL CLUSTER ALGORITHM
The automatic classification of the atmospheric cir-culation anomaly patterns over the eastern part of Africa and the western Indian Ocean was carried out by applying a non-hierarchical sample-partitioning algorithm, hereafter referred to as cluster analysis (Michelangeli et al. 1995).
Cluster analysis has been used in meteorology to classify clouds into coherent types (Desbois et al. 1982) and in climatology to determine the recurrence and the quasi-stationarity of weather regimes over the Atlantic and Pacific Ocean Basins (Michelangeli et al. 1995). It has also been used to investigate the influence
24°N 12°N 0° 12°S 24°S 24°N 12°N 0° 12°S 24°S 24°N 12°N 0° 10 m s 12°S 24°S
12°E 24°E 36°E 48°E 60°E
-1 10 m s-1 20 m s-1
850 hPa
700 hPa
200 hPa
Fig. 1. Mean circulation (m s–1) for March to May (MAM) and October to December (OND), 1979–2002. The classification
of sea-surface temperature (SST) anomalies in the equatorial Pacific basin on the probability of occur-rence of weather regimes over the North Atlantic Ocean (Moron & Plaut 2003). Huth (1996) concluded that the algorithm leads to spatially and temporally quite consistent partitions and to similar size clusters (types) that are well separated from each other.
The cluster analysis algorithm must be applied after a data reduction process, in order to ensure the linear independence of the input data (Huth 1996). If the algorithm is directly applied to at least partially lin-early dependent variables, the final result may be sig-nificantly affected because of the more important influence of the correlated variables on the obtained partitioning. The classification itself is preceded by a PCA based on the correlation matrix (see Section 3.3). The variables are the NCEP zonal (U ) and meridional (V ) components of the wind at each grid point, and the
observations are the pentads (5 d) in MAM and OND for 1979–2002. The PCA converts the initial variables into a series of empirical orthogonal functions (EOFs) statistically independent from each other, which still explain a major part of the initial variance.
3.1. Dynamical cluster algorithm formulation Cheng & Wallace (1993) and Michelangeli et al. (1995) contributed to complete the dynamical cluster algorithm; the presentation of the methodology is therefore essentially inspired by their studies. It is presented here for a better understanding of its specificities.
Given a previously fixed number of clusters, k, the
aim of the cluster analysis algorithm is to obtain a par-tition, P, of the observations (pentads) into k clusters
that minimizes the sum of the intra-cluster variances,
W. The Euclidian distance is used to measure the
sim-ilarity between 2 observations, X and Y. The overall
minimum of the function W(P) corresponds then to the
partition that best separates the different points. When the classification is applied to large samples, climato-logical series for example, this overall minimum cannot be found in practice, because of the huge number of different possibilities to explore. The algorithm defines
n iterative partitions, P(n), for which W(P(n)) decreases
with n and eventually converges to a local minimum of
the function, W(P). The overall minimum of W(P) is
sur-rounded by many local minima that differ from it by only a few observations, exchanged from one cluster to another, and essentially found at the periphery of them. The latter may largely depend on the analysed sample, the algorithm being initialized by a random draw of the k clusters. The reproducibility of the
obtained partitions should therefore be tested.
Initialization of the algorithm. k points are first
ran-domly chosen as initial cluster centres among all data; they are then used as the initial centroids of the k
clus-ters of the first partition P0 in order to initialize the
algorithm.
Iteration i–1 to i. Using the k centroids, Y(i–1), of the
partition P(i –1), each pentad from the original dataset is
assigned to the nearest centroid, Y(i –1), the similarity
between each pentad and each centroid being mea-sured by the Euclidian distance. A new partition, P(i), is
then obtained, for which thek centroids, Y(i), of thek
clusters are recomputed. For each iteration, the sum of the intra-cluster variances, W(P(i)), is calculated.
End criterion. The algorithm stops when W(P(i)) has
converged to a minimum, i.e. when an additional iter-ation does not significantly affect the partition any more. On average, the convergence is obtained before 50 iterations.
3.2. Similarity of two partitions and reproducibility If the distribution of the climatological dataset is uni-form, the final partition is assumed to be largely dependent on the initial randomly chosen seeds. In contrast, when the dataset is distributed into well-defined clusters, 2 different initial draws should theo-retically lead to roughly similar final partitions. The dependence of the final result on the initial random draw may thus be used as an indicator of the degree of classifiability of the dataset intok clusters.
The robustness of the final partition will be deter-mined using 3 criteria: (1) Is this partition the best one that can be found, given a fixed number of clusters k?
(2) What is the most appropriate value for k? (3) Are
the final clusters reproducible from different initial random draws?
Following Michelangeli et al. (1995) and Moron & Plaut (2003), we performed 50 different partitions of the wind anomaly patterns, each time initialized by a different random draw. The most natural way to mea-sure the dependence of the final partition on the initial random draw, and thus the classifiability of the original dataset, consists of comparing several final partitions for a given number of clusters k. We then retain the
partition having the highest mean similarity with the 49 other ones. A classifiability index, c* (Cheng &
Wal-lace 1993), is next defined, which measures the aver-age similarity within the 50 sets of clusters: its value would be exactly 1 if all the partitions were identical. If the wind anomaly patterns gather intok clusters in a
natural way, one would expect the classifiability of the actual maps to be significantly better than that of an ensemble of artificial datasets generated through a first-order Markov process having the same
covari-ance matrix as the true atmospheric data (Moron & Plaut 2003). The red-noise test (applied to Markov-generated red-noise data) operates as follows: 100 samples of the same length as the atmospheric dataset are generated, providing 100 values of the classifiability index, which are ranked to find the 10 and 90% confidence limits. The value of c* for the
atmospheric dataset is then compared with these lim-its: a value above the 90% confidence limit indicates, for the corresponding value of k, a classifiability
signif-icantly higher than that of the red-noise model. The operation is repeated for k varying from 3 to 10: in
most cases the best choice for the number of clusters appears quite unambiguously.
3.3. Application of the dynamical cluster algorithm The atmospheric circulation is described by the U
and V components of the wind fields, obtained from
the NCEP-DOE R-2 reanalysis daily dataset. We first attempted to classify atmospheric configurations based on geopotential height standardized anomalies, but the result was strongly dependent on the large-scale tropospheric heating following El Niño events.
Daily data were averaged to pentad data in order to be compatible with the GPCP time step, which is still fully adequate for intraseasonal variability surveys (Kabanda & Jury 2000, Mpeta & Jury 2001). Finally, the study includes Pentads 13 to 30 (MAM) and 56 to 73 (OND), because they constitute the wettest periods for much of EEA. The consistency of anomaly patterns between MAM and OND was tested by applying sep-arate classifications for the 2 seasons (not shown).
The classification was applied on the circulation anomalies after removal of the annual cycle in order to eliminate the variance associated with the shift of the ITCZ. Besides, the aim was not to classify the observed wind fields themselves but to determine the most recurrent anomaly patterns within the region. The U
and V wind anomalies were standardized (variance = 1
for each grid point of each level for MAM + OND 1979–2002) in order to attribute the same weight to upper-layer and lower-layer anomalies (the former usually concentrate more variance than the latter, the strongest and most spatially coherent signals occurring in the upper troposphere). In the final results, merid-ional anomalies will therefore have the same weight on cluster determination as the zonal fields. Without standardization this situation would not have occurred, because U is generally characterized by larger and
spatially more coherent anomalies.
As stated above, the signals were then captured and synthesized by a single PCA (applied on the 3 levels and on all the grid points), on which the classification
itself was implemented. The circulation-anomaly clas-sified area is delimited by the bounds 20° N–20° S, 20–60° E, using simultaneously the 3 geopotential levels 850, 700 and 200 hPa. The latitudinal extent was chosen in order to exclude purely extra-tropical sig-nals, characterized by a strong variability that could have altered the final partition, and to document atmospheric patterns over a large area around EEA. As a preparatory work, a series of classifications led to a precise delimitation of the retained domain (not shown). Other tentative classifications similarly helped to select the atmospheric levels. The 3 geopotential levels were chosen to synthetically integrate lower, higher and mid-level circulation. These levels also appear adequate in describing the main features of the regional atmospheric circulation (Camberlin & Wairoto 1997, Okoola 1999a,b, Mutai & Ward 2000), including those related to mid-latitude systems (Johnson & Mörth 1960) or to the large-scale zonal anomaly cells along the equator, at both the intraseasonal timescale (MJO; Madden & Julian 1994, Kiladis & Weickmann 1997, Wheeler & Hendon 2004) and the interannual timescale (Indian Walker cell; Hastenrath 2000). The use of the 700 hPa level improved the statistical sig-nificance of the final classification, estimated by computing the classifiability index (Fig. 2); it also deliberately allocates to lower and mid-levels, of great interest with regard to rainfall-inducing processes, a stronger impact on the final partition.
In short, the dynamical cluster analysis was applied to U and V standardized circulation anomalies at 850,
700 and 200 hPa, after removal of the annual cycle for each grid point included in the area 20° N–20° S, 20–60° E. However, the results are presented on an extended domain in order to examine large-scale patterns; the choice of the study area allows one to isolate equatorial and tropical atmospheric signals.
Number of clusters Index value Classif. index 90% conf. limit 10% conf. limit 0.3 0.4 0.5 0.6 0.7 0.8 0.9 3 4 5 6 7 8 9 10
Fig. 2. Series of classifiability indices for a number of clusters, k, varying from 3 to 10; 10 and 90% confidence limits, obtained from the Markov noise-generating process, are
4. RESULTS
4.1. Determination of the number of clusters The best choice for the number of clustersk may be
indicated by the computation of the classifiability index, and its comparison with the same index calculated on the red-noise-generated signal. It appears in Fig. 2 that the values are generally far below the confidence bounds,
indicating a poor degree of reliability. However, values of k between 5 and 7 show the overall best results, and
they reach the 90% confidence bound. Partitions into 5, 6 and 7 clusters were therefore examined more closely, as they led to the most coherent clusters. The anomaly fields obtained fork = 7 were seen to display spatial
patterns closer to some of those described in previous studies (Johnson & Mörth 1960, Okoola 1999a,b). A partition into 7 clusters was thus finally retained.
700 hPa 850 hPa 200 hPa
Cluster 1
a) Wind anomalies (m s )
d) GPCP-estimated rainfall anomalies
e) Seasonal distribution
-0.7
- 0.7
-0.
6
- 0.6
-0.5
0.4
- 0.4
- 0.3
- 0.2
- 0.1
0
0
0.1
0.2
0.3
12°E 24°E 36°E 48°E 60°E
24°E 32°E 40°E 48°E 56°E
12°E 24°E 36°E 48°E 60°E
16°S 8°S 0° 8°N 16°N 24°S 12°S 0° 12°N 24°N 24°S 12°S 0° 12°N 24°N 0° 24°S 12°S 12°N 24°N
-0.3
- 0.2
-0.2
0
0
0.1
0.1
0.2
0.2
0.2
0.3
0.3
0.3
0.4
0.4
0.5
0.5
0.6
0.6
c) Geopotential height anomalies
700 hPa
200 hPa
b) ANOVA between rainfall estimates
–1
Number of cases
7 6 5 4 3 2 1 0Pentads
13 15 17 19 21 23 25 27 29 56 58 60 62 64 66 68 70 720.4
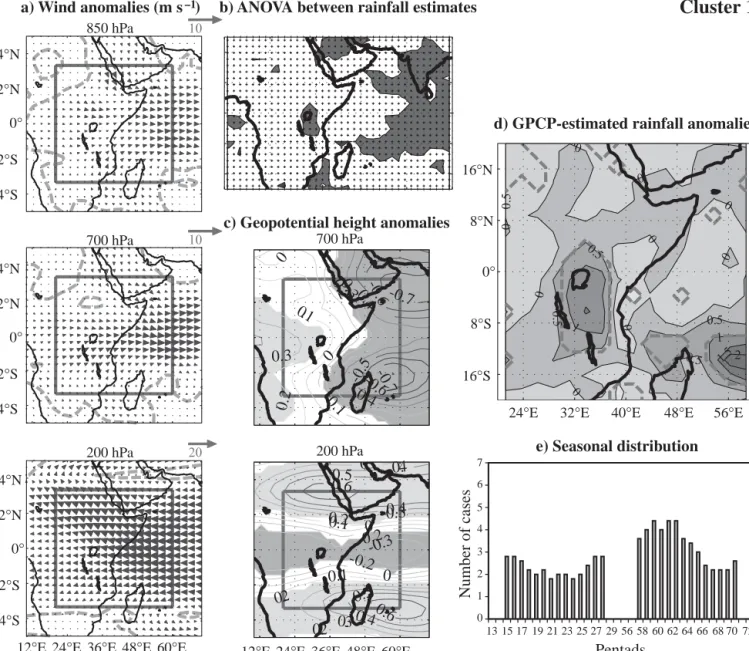
Fig. 3. Cluster 1, wind anomalies. All anomalies are calculated after removal of the annual cycle. (a) Wind anomalies (m s–1); dashed lines encompass significant anomalies (Hotelling t2-test, 95% level). (b) ANOVA between the cluster and GPCP-estimated rainfall anomalies; shaded areas show the regions where the cluster significantly discriminates rainfall (95% level). (c) Geopotential height standardized anomalies; shaded areas show significant anomalies (t-test, 95% level): dark grey — nega-tive, light grey — positive. (d) GPCP-estimated rainfall anomalies (mm d–1); dashed lines encompass significant anomalies (t -test, 95% level). (e) Seasonal distribution; analysed pentads (MAM, pentads 13 to 30; OND, pentads 56 to 73) are on the
4.2. Representation of classification results Figs. 3a to 9a present the circulation anomaly pat-terns, i.e. the deviations from the mean (the latter approximately shown in Fig. 1) averaged on all the pentads that constitute each cluster. The dashed lines on the circulation maps encompass significant anom-alies according to the Hotelling t2-test, at the 95%
con-fidence level. The Hotelling test is the multivariate generalization of the t-test; in the present case it is
applied to U and V (for details, see Sud et al. 1991, Von
Storch & Zwiers 1999). Intra-cluster homogeneity was empirically verified by extracting the 2 most dissimilar
pentads of each cluster. The results seem quite robust and consistent for each of the obtained clusters, even if a large intra-cluster variance necessarily remains because of the small number of clusters. In order to further document the atmospheric configurations asso-ciated with each of the 7 clusters, the geopotential height standardized anomalies (not used in the cluster analysis) were also plotted (Figs. 3c to 9c) for the 2 levels 700 and 200 hPa. The 850 hPa level is not shown because of its strong similarity with 700 hPa. The esti-mated-rainfall anomalies (GPCP dataset) associated with the clusters are also displayed (Figs. 3d to 9d); for each cluster an ANOVA was computed in order to
850 hPa 700 hPa 200 hPa
-0.4
-0.3
- 0.3
- 0.2 0.1
0 0.1
0.1
0.2
0.3
0.4
0.5
0.6
0.6 0.7
0.8
0.7
-0.6
0.6
0.5
-
- 0.4
0.3
- 0.3
- 0.2
1
- 0.
1
0.1
0
0
0
0.1
0.2
0.2
0.3
0.3
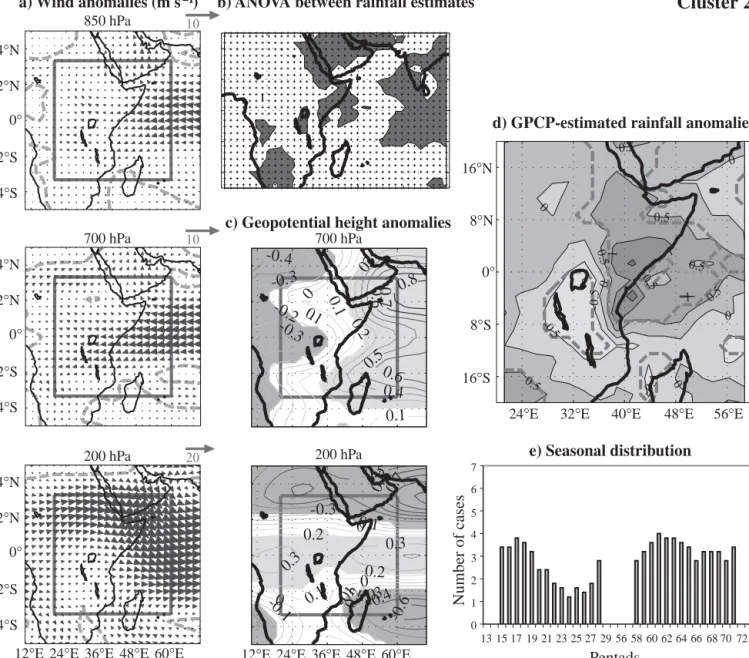
700 hPa 200 hPa
Cluster 2
a) Wind anomalies (m s )
–1b) ANOVA between rainfall estimates
24°S 12°S 0° 12°N 24°N 24°S 12°S 0° 12°N 24°N 24°S 12°S 0° 12°N 24°N
12°E 24°E 36°E 48°E 60°E 12°E 24°E 36°E 48°E 60°E
d) GPCP-estimated rainfall anomalies
c) Geopotential height anomalies
e) Seasonal distribution
24°E 32°E 40°E 48°E 56°E 16°S 8°S 0° 8°N 16°N
Pentads
13 15 17 19 21 23 25 27 29 56 58 60 62 64 66 68 70 72Number of cases
7 6 5 4 3 2 1 0-0.
determine the regions where rainfall anomalies are significantly discriminated by their affiliation to the cluster (Figs. 3b to 9b). The frequency distribution of each cluster during the 2 seasons is also provided (Figs. 3e to 9e); for better readability, the results were filtered using a 3-pentad moving average.
Table 1 gives the size of each cluster; as noted in Huth (1996), the dynamical cluster analysis always tends to lead to approximately equal-size clusters. The temporal transitions between the different clusters were considered: for each occurrence of one cluster at one given pentad (referred to as Pentad P1), the cluster
to which the immediately-preceding pentad has been affected is recorded (Pentad P0). The persistence of the
anomaly patterns may be seen on the shaded diagonal (interpreted as P0and P1belong to the same cluster).
850 hPa 700 hPa 200 hPa
0.1
0.1
0.1
0.2
0.2
0.2
0.3
0.3
0.4
0.4
0.5
0.6
0.7
0.8
- 0.5
- -
0.4
- 0.3
0.3
-0.2
-0.2
- 0.1
0.1
0
0
0
0.1
0.1
0.1
0.2
0.2
0.2
0.3
0.3 0.3
Cluster 3
700 hPa 200 hPaa) Wind anomalies (m s )
–1b) ANOVA between rainfall estimates
d) GPCP-estimated rainfall anomalies
c) Geopotential height anomalies
e) Seasonal distribution
24°S 12°S 0° 12°N 24°N 24°S 12°S 0° 12°N 24°N 24°S 12°S 0° 12°N 24°N12°E 24°E 36°E 48°E 60°E 12°E 24°E 36°E 48°E 60°E
16°S 8°S 0° 8°N 16°N
24°E 32°E 40°E 48°E 56°E
Number of cases
7 6 5 4 3 2 1 0Pentads
13 15 17 19 21 23 25 27 29 56 58 60 62 64 66 68 70 72Fig. 5. Cluster 3, wind anomalies. All anomalies are calculated after removal of the annual cycle. See Fig. 3 for details
Pentad Size Pentad P0
P1 1 2 3 4 5 6 7 1 105 38.9 1.0 10.2 5.5 18.0 16.4 5.3 2 106 2.0 40.6 8.3 17.2 6.3 2.1 6.2 3 115 7.1 14.8 25.1 10.3 9.9 7.9 11.5 4 151 12.2 17.8 14.8 34.6 15.3 13.6 15.0 5 119 17.4 5.0 15.7 10.3 31.6 6.4 13.3 6 146 16.3 4.0 14.8 9.7 12.6 34.3 21.2 7 122 6.1 16.8 11.1 12.4 6.3 19.3 27.5 Total 864 100 100 100 100 100 100 100 Table 1. Size of the clusters and transitions between the
4.3. Interpretation of the clusters
The different clusters are well separated from each other: for all clusters and levels taken together, 78.61% of the grid points display significant circula-tion anomalies (t2-test, 95%). The significance
in-creases in upper layers (87% at 200 hPa, 76% at 850 Pa and 73% at 700 hPa), but it also varies from one cluster to another (68% for Cluster 3 vs 84% for Cluster 4). The efficiency of the dynamical cluster analysis is demonstrated, in agreement with Huth (1996), who compared different automatic classifica-tion processes.
Two clusters (1 and 2) display almost symmetrical patterns, as shown by the circulation anomaly maps
(Figs. 3a & 4a) and the associated geopotential standardized anomalies (Figs. 3c & 4c). These 2 clus-ters exhibit zonal wind anomalies over the Indian Ocean of opposite signs between the lower and mid-levels, on the one hand, and the upper mid-levels, on the other hand. For instance, Cluster 1 displays low- to midtropospheric westerly anomalies, and upper-tropospheric easterly anomalies, both centred on the equatorial Indian Ocean. Abnormally low (high) geopotential heights are found at 700 (200) hPa over the NW and SW Indian Ocean. Such patterns are reminiscent of those associated with equatorial zonal circulation cells, suggesting subsiding/ascending motions between higher and lower levels (confirming the principle of conservation of atmospheric mass).
850 hPa 700 hPa 200 hPa
-0.6
-0.5
0.5
- 0.4
- 0.4
- 0.3
- 0.3
0.2
-0.2
0.1
- 0.1
0
0
0.1
0.2
0.3
-0.3
-0.2
- 0.2
- 0.1
0
0
0
0
0.1
0.1
0.2
0.3
0.4
-700 hPa 200 hPa
Cluster 4
a) Wind anomalies (m s ) b) ANOVA between rainfall estimates
–1d) GPCP-estimated rainfall anomalies
16°S 8°S 0° 8°N 16°N
24°E 32°E 40°E 48°E 56°E
Number of cases
7 6 5 4 3 2 1 0Pentads
13 15 17 19 21 23 25 27 29 56 58 60 62 64 66 68 70 72c) Geopotential height anomalies
24°S 12°S 0° 12°N 24°N 24°S 12°S 0° 12°N 24°N 24°S 12°S 0° 12°N 24°N
12°E 24°E 36°E 48°E 60°E 12°E 24°E 36°E 48°E 60°E
e) Seasonal distribution
In order to ascertain the presence of ascending or subsiding anomalies and the role of East-African topography, Fig. 10 presents vertical sections of the atmosphere along the equator, depicting the mean sit-uation and the anomalies associated with these 2 clus-ters. Fig. 10a shows the mid- to uppertropospheric sub-sidence observed on average over EEA. The surface topography is also seen to strongly impact the lower-level circulation, by forcing the ascent of the low-lower-level easterlies on the eastern slopes. Considering the 2 clusters (Fig. 10b,c), the anomaly patterns appear once again almost perfectly symmetrical. Over the East-African Highlands the vertical motion appears sym-metric with the flows observed over the Congo Basin, thus forming a consistent African cell apparently well
identified and adjoining the large-scale circulation patterns located over the equatorial Indian Ocean. Even if the local dynamics and/or the topography complicate the atmospheric configurations, Cluster 1 (Cluster 2) seems to characterize an atmospheric cell exhibiting a downward (upward) motion over the East-African and west-Indian Ocean longitudes.
The rainfall fields over the Indian Ocean are spa-tially coherent (Figs. 3d & 4d) and consistent with the observed large-scale vertical motion anomalies (Fig. 10). In contrast, the precipitation response over the EEA region appears spatially more contrasted, probably due to the local topography.
Cluster 1 exhibits significant positive rainfall anom-alies over the East-African Highlands (Fig. 3d), which
850 hPa 700 hPa 200 hPa
-1.1
-1
-0.8
-0.6
-0.5
-0.3
0.1
0
0
0.1
0.1
0.2
-0.3
-0.2
- 0.1
0.1
0.1
0
0
0
0
0.1
0.1
0.2 0.3
700 hPa 200 hPa
Cluster 5
a) Wind anomalies (m s ) b) ANOVA between rainfall estimates
–1c) Geopotential height anomalies
24°S 12°S 0° 12°N 24°N 24°S 12°S 0° 12°N 24°N 24°S 12°S 0° 12°N 24°N
12°E 24°E 36°E 48°E 60°E 12°E 24°E 36°E 48°E 60°E
d) GPCP-estimated rainfall anomalies
e) Seasonal distribution
16°S 8°S 0° 8°N 16°N24°E 32°E 40°E 48°E 56°E
Number of cases
7 6 5 4 3 2 1 0Pentads
13 15 17 19 21 23 25 27 29 56 58 60 62 64 66 68 70 72is consistent with the ascending motion observed in the troposphere, whereas coastal plains experience weak negative rainfall anomalies. Rainfall amounts thus appear to be closely related to the vertical atmos-pheric circulation. Cluster 2 (Fig. 4d) clearly exhibits a symmetrical zonal dipole centred on the EEA region that is also consistent with the vertical circulation anomalies (Fig. 10c). Clusters 1 and 2 also discriminate the precipitation amounts over the major parts of the Indian Ocean Basin (Figs. 3b & 4b).
Zonal circulation anomalies over Equatorial Africa present contrasted impacts on EEA rainfall, whereby the coastal region wet/dry spells seem to be out-of-phase with those of the Highlands. These results are consistent with Pohl & Camberlin (unpubl.). In addition,
the circulation maps associated with Clusters 1 and 2 (Figs. 3a & 4a) resemble the circulation patterns asso-ciated at the intraseasonal timescales with the MJO (Madden & Julian 1994, Wheeler & Hendon 2004). The relationships between the 2 clusters and the MJO will therefore be examined in detail in Section 4.4.
Clusters 1 and 2 present the strongest persistence (Table 1) and these 2 opposite configurations in prac-tise never succeed each other. Their seasonal distribu-tion is relatively similar, peaking (especially for Clus-ter 1) in October and early November.
Cluster 3 (Fig. 5) exhibits weak circulation anomalies at 850 and 700 hPa. A reinforcement of the southern trade winds over Zambia and the southern Congo Basin is perceptible. In return, a pair of cyclonic
850 hPa 700 hPa 200 hPa
- 0.4
-0.3
-0.2
0
0
0
0.1
0.1
0.2
0.30.4
0.5
0.6
- 0.2
- 0.2
- 0.1
- 0.1
0
0
0.
1
0.1
0.2
0.2
0.3
0.3
0.3
700 hPa 200 hPa
Cluster 6
a) Wind anomalies (m s ) b) ANOVA between rainfall estimates
–1d) GPCP-estimated rainfall anomalies
c) Geopotential height anomalies
e) Seasonal distribution
16°S 8°S 0° 8°N 16°N24°E 32°E 40°E 48°E 56°E
Number of cases
7 6 5 4 3 2 1 0Pentads
13 15 17 19 21 23 25 27 29 56 58 60 62 64 66 68 70 72 24°S 12°S 0° 12°N 24°N 24°S 12°S 0° 12°N 24°N 24°S 12°S 0° 12°N 24°N12°E 24°E 36°E 48°E 60°E 12°E 24°E 36°E 48°E 60°E
alies corresponding to negative geopotential anom-alies appears in upper layers in each hemisphere, approximately at 25° latitude on the 30° E meridian. This pattern has already been empirically observed by Johnson & Mörth (1960), and it corresponds in their simplified classification of the most common circula-tion patterns to the ‘bridge’ model, i.e. a pair of troughs on each side of the Equator and quasi-geostrophic winds in each meteorological hemisphere. Their theo-retical model is, however, not restricted to the upper layers. Associated rainfall anomalies (Fig. 5d) are weak over EEA. Enhanced rainfall is found over the Congo Basin, whereas dry conditions prevail over southern Africa and Madagascar. Both are significantly discrim-inated by the cluster (Fig. 5b). In contrast to the first 2 clusters, Cluster 3 presents the lowest persistence
(Table 1), and its temporal distribution is quite uniform through the seasonal cycle.
The Cluster 4 pattern (Fig. 6) consists of a lower-layer, east-to-west juxtaposition of a cyclonic cell and an anticyclonic cell in the southern hemisphere, sepa-rated from each other by northwesterly anomalies extending from the Great Lakes to Madagascar. In the upper layers an anticyclonic cell centred over Mozam-bique and a cyclonic cell over the Arabian Peninsula face each other on each side of the Equator. This con-figuration is close, in the upper layers, to the ‘cross-equatorial drift’ described by Johnson & Mörth (1960) as the opposition of a high-pressure cell and a low-pressure cell in each hemisphere, generating a trans-equatorial flow. However, the drift model more partic-ularly refers to lower-level circulation patterns, and it
850 hPa 700 hPa 200 hPa
- 0.4
-0.3
-0.2
0.1
- 0.1
0
0
0.1
0.1
0.2
0.5
0.8
0.9
- 0.8
- 0.7
- 0.
5
- 0.4
0.3
- 0.3
-0.2
- 0.2
- 0.2
- 0.1
0
0
0.1
0.1
0.3
0.7
0.7
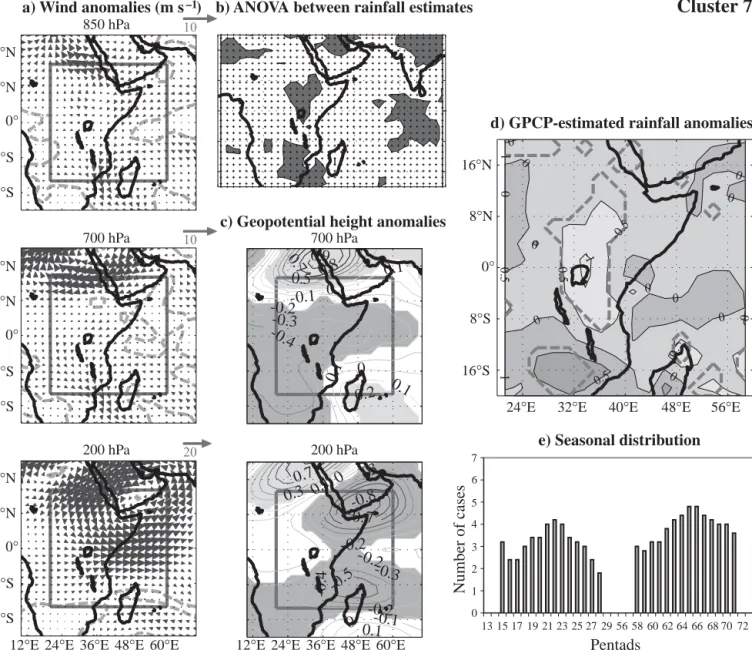
700 hPa 200 hPaCluster 7
a) Wind anomalies (m s ) b) ANOVA between rainfall estimates
–1c) Geopotential height anomalies
d) GPCP-estimated rainfall anomalies
e) Seasonal distribution
16°S 8°S 0° 8°N 16°N24°E 32°E 40°E 48°E 56°E
Number of cases
7 6 5 4 3 2 1 0Pentads
13 15 17 19 21 23 25 27 29 56 58 60 62 64 66 68 70 72 24°S 12°S 0° 12°N 24°N 24°S 12°S 0° 12°N 24°N 24°S 12°S 0° 12°N 24°N12°E 24°E 36°E 48°E 60°E 12°E 24°E 36°E 48°E 60°E
is a characteristic feature of the summer monsoon, which is not the topic of the present study. Associated rainfall anomalies concern mainly southern Africa and secondarily Ethiopia (both abnormally wet; Fig. 6d). The cluster appears able to significantly discriminate these rainfall anomalies. These results are consistent with Todd & Washington (1999), who identified north-westerly anomalies running from the Congo Basin to Madagascar as a recurrent pattern associated with abnormally wet spells over southern Africa. Cluster 4 is also characterized by a strong persistence (Table 1) and by a higher number of cases in MAM.
Cluster 5 (Fig. 7) essentially exhibits a strong lower-layer westerly signal in the low southern lati-tudes, corresponding to a weakening of the southern hemisphere trade winds. It is related to the develop-ment of a deep trough over Madagascar. A moderate reinforcement of the northern trade winds, especially over the Horn of Africa, is also observed. Upper-layer anomalies are from the east or SE in a major part of the domain, concomitant with 2 anticyclonic anomaly cells centred on the south of Mozambique and on the SE of the Arabian Peninsula. Associated precipitation anomalies are positive on a SE–NW diagonal running from Madagascar to Lake Victoria, and are negative over the Horn of Africa, the Kenyan coast region and the western equatorial Indian Ocean. Such a pattern is recurrently associated with wet spells over south-ern Africa and Madagascar (Washington & Todd 1999). It may also be in close interaction with the mid-latitude lows (Todd & Washington 1999), which would be consistent with the negative geopotential height anomalies observed on the austral margin of the domain (Fig. 7c). Concerning rainfall anomalies, moisture advections from the Congo Basin air mass, in connection with the weakening of the southern trade winds, seem to largely explain the wet anom-alies observed over SE Africa. Similarly, dry air advections may occur over the Horn of Africa from the Asiatic land mass, in relation to the moderate strengthening of the diffluent northern trades. On both the African landmass and Madagascar the areas experiencing wet conditions correspond to regions with marked topography, and orographic ascents are likely to be involved in the condensation of lower-level moisture. The circulation anomalies at the 3 lev-els, the associated rainfall anomalies and the transi-tions between the clusters (Table 1) reveal similarities with Cluster 1. The 2 clusters preferentially succeed each other. However, they present a dissimilar sea-sonal distribution, Cluster 5 being uniformly recorded across the 2 seasons.
Clusters 6 and 7 are related to each other, as shown by their preferred temporal transition (Table 1), and their out-of-phase distribution through the seasonal cycle (Figs. 8d & 9d). In lower and mid-layers, circula-tion anomalies associated with Cluster 6 (Fig. 8a) are reminiscent of the boreal summer monsoon flow estab-lished over the region during July–September. The seasonal distribution is consistent with this point, more cases occurring just before and just after the boreal summer. At these times of the year, this cluster corre-sponds to enhanced monsoon circulation. The signal, in fact, displays a weakening of the northern trades and a strengthening of the southern trades, and thus appears as quite symmetrical to the patterns associated with Cluster 5. In upper layers easterly anomalies
pre-Le
v
el (hP
a)
Le
v
el (hP
a)
East longitude
Le
v
el (hP
a)
10
20
30
40
50
60
70
a)
b)
c)
2 m s
–15 m s
–12 m s
–1Fig. 10. Atmospheric cross-sections of the zonal and vertical components of the wind at the equator. The topography is represented such as it appears in the NCEP–NCAR spectral model. (a) Mean circulation. (b) Circulation anomalies associ-ated with Cluster 1; shaded areas show significant anomalies according to the Hotelling test applied to the zonal (U ) and vertical (ω) components of the wind at the 95% confidence
vail in the north and the south, and a cyclonic pattern located over Lake Malawi reinforces these anomalies on their southern rim, near southern Mozambique. Associated rainfall anomalies (Fig. 8d) are significantly negative over a large area, especially on a SW–NE diagonal extending from southern Africa to Arabia via EEA. Divergence anomalies observed over the eastern part of the continent, as well as a possible role for the East African topography as a barrier, may be involved in explaining these patterns. A separate analysis of the 2 rainy seasons reveals quite dissimilar structures, the dry areas affecting only the northern part of the diago-nal in MAM and only its southern part in OND. The lower hygrometric capacity of the air masses, gener-ated by the lower temperatures after the southern hemisphere winter season, may largely contribute to causing these differences.
Cluster 7 (Fig. 9) is essentially dominated by an upper-tropospheric signal consisting of an anticyclonic flow (positive geopotential anomalies) over Egypt and a cyclonic flow (negative geopotential anomalies) over southern Arabia. Some lower-layer divergence is also observed around EEA. Associated rainfall anomalies are negative and significant over the Highland region, as a possible result of upper-layer confluence and lower-layer diffluence. The positive rainfall anomalies in the Kalahari Desert region may be related to the lower-layer northwesterly anomalies, seen to cause above-normal precipitations in the southern part of Africa by advecting moisture from the Congo Basin (Todd & Washington 1999).
4.4. Intraseasonal and interannual modulations of the clusters
Even though the clusters are approximately equally sized (Table 1), leading to similar frequencies of appearance over the overall period, the cluster occur-rences exhibit substantial intraseasonal and inter-annual variabilities. Their possible association with the dominant modes of climate variability at these time scales thus deserves to be explored.
At the intraseasonal timescale, the dominant mode of atmospheric variability within the tropical belt is char-acterized by an eastward migration of zonal cells along the Equator. It is mainly found over the Indian and the western Pacific basins (Madden & Julian 1971, 1972, 1994). Consequently, convective cloud clusters (cloud-free areas) also migrate eastward, their location ap-proximately corresponding with ascending (subsiding) motion. This phenomenon appears as a pseudo-cycle with a period varying from 30 to 60 d, known as the Madden–Julian Oscillation (MJO). The signal is very consistent spatially and significant anomalies are
found in zonal wind (at both upper and lower levels), OLR and sea-level pressure.
The modulation of the frequency of the different clusters by the MJO is evaluated using the indices developed by Wheeler & Hendon (2004). The intra-seasonal cycle is decomposed into phase (α, varying from 0 to 2π radians) and amplitude measurements, which offers the advantage of suppressing the non-stationarity of the period (30 to 60 d). The present study makes use of the phase values in order to locate the main MJO-related convective cells along the equator. For example, for α = π, enhanced convection is ob-served over western Africa; for α = 3π/2 it takes place over the eastern Indian Ocean; and at 2π, it has reached the Maritime Continent/Western Pacific.
Fig. 11 presents the frequency of the 7 clusters as a function of the MJO phase. The circulation anomaly patterns describe recurrent configurations that are preferentially observed at given phases of the intrasea-sonal cycle. Almost 40% of the occurrences of Cluster 1 are observed during the MJO phase 3π/2, during which easterly (westerly) anomalies are observed over the Indian Ocean in the lower (upper) layers of the
tro-Cluster #1 Cluster #3 Cluster #5 Cluster #7 Cluster #6 Cluster #4 Cluster #2
Fig. 11. Frequency of occurrences of the clusters over the intraseasonal oscillation, expressed as a percentage of the
posphere (Wheeler & Hendon 2004). Enhanced con-vection is located at this phase over Indian longitudes, and positive rainfall anomalies are then found over the eastern Indian Ocean. Fig. 3b actually shows precipita-tion significantly discriminated over this area (Fig. 3b). The cluster is never observed during the opposite phase of the MJO (from π/2 to π). The similarities noted between Clusters 1 and 5 are also observed as far as their distribution over the MJO cycle is concerned. The positive rainfall anomalies observed over the High-lands during the occurrences of the cluster have to be interpreted as a delay of the East African convection, consistent with Pohl & Camberlin (unpubl.). Such a hypothesis is reinforced by the vertical component of the wind pattern (Fig. 10b).
In contrast, Cluster 2 is most often found during the MJO phase π (westerly lower-layer and easterly upper-layer anomalies over the Indian Ocean and convection over western Africa). More than 45% of its occurrences are recorded during this phase of the cycle. The east-ern Indian Ocean then experiences dry conditions (not shown), also significantly discriminated by the cluster (Fig. 4b). Cluster 2, found to be symmetric with Cluster 1, appears to characterize another phase of the MJO, which explains why the 2 patterns, in practice, never succeed each other (Table 1). Clusters 3 and 7 are also recurrently recorded at this phase of the MJO. The 2 remaining clusters (4 and 6) are distributed more homogeneously over the intraseasonal cycle. The ob-tained partitioning is then strongly constrained by the circulation anomalies induced or at least in relation-ship with the MJO over the Eastern Africa–Western Indian Ocean region.
At the interannual timescale, the dominant mode of atmospheric and oceanic variability in the Indian Ocean Basin is the El Niño–Southern Oscillation (ENSO). The Southern Oscillation Index (SOI) was used as an indicator for this phenomenon. The Dipole Mode Index (DMI; Saji et al. 1999) was also used as an indicator of the zonal SST gradient in the equatorial Indian Ocean. Correlations between the number of occurrences of each cluster and these indices were applied to evaluate the effects of the El Niño/Dipole Mode Event years on the intraseasonal variability of the atmospheric patterns (Table 2).
For the OND season, the interannual fluctuations in the number of occurrences of the different clusters were not related to these dominant modes of variabil-ity. For the MAM season the DMI interannual fluctua-tions do not significantly affect the number of occur-rences of the clusters, but the results with the SOI exhibit significant results. Clusters 2 and 5 occur more frequently during El Niño events, while Clusters 1 and 6 are more often recorded during La Niña years. East-erly anomalies seem to be more often recorded over
the equatorial Indian Ocean during the northern springs following immediately after a La Niña event, which is consistent with the negative (positive) SST anomalies off the Kenyan (Indonesian) coast usually associated with this phase of ENSO. However, the interpretation of the results remains ambiguous, be-cause the 2 pairs of clusters only present limited simi-larities in terms of wind and rainfall anomaly patterns. Moreover, the statistical independence found for the OND season remains startling.
4.5. Rainfall anomaly discrimination
The typology of the circulation anomaly patterns obtained by dynamical cluster analysis seems quite suitable for discriminating both rainfall anomalies and atmospheric configurations, as some of the results resemble previously known patterns. In order to con-firm the ability of the classification to discriminate wet and dry events at the intraseasonal timescale, the vari-ance of the pentad rainfall anomalies explained by the clusters was compared with the residual (intra-cluster) variance. Fig. 12 shows the results of an ANOVA applied on rainfall at each grid point of the GPCP grid, to test the ratio between within-cluster variance and centroid-variance. All the 864 pentads included in MAM + OND 1979–2002 are considered.
Over a major part of the African continent (especially EEA and southern Africa), rainfall amounts are signifi-cantly discriminated by the clusters. However, the pre-cipitation in the Sahara Desert (where rainfall amounts are low) and the eastern Congo Basin are poorly dis-criminated by the 7 clusters. For the latter, better results might have been obtained by extending the domain westwards, to encompass the West African monsoon area.
A clear distinction between the African land mass and the western Indian Ocean also appears. The
non-MAM OND
DMI SOI DMI SOI
1 –0.05 0.44 –0.25 0.06 2 –0.21 –0.58 0.26 –0.39 3 0.12 –0.30 0.30 –0.23 4 –0.08 –0.23 0.44 –0.26 5 0.62 –0.58 0.08 –0.29 6 –0.23 0.65 –0.39 0.60 7 –0.08 0.33 –0.41 0.43
Table 2. Correlations between the the Southern Oscillation Index (SOI)/Dipole Mode Index (DMI) and the number of occurrences of the clusters for MAM and OND. Significant correlations (Bravais–Pearson test, 95% confidence limit)
significant results obtained for the latter area could result from either the fact that intra-seasonal variabil-ity of rainfall amounts bears little relationship with local wind anomalies or the fact that the GPCP data over the Indian Ocean are not fully reliable (since rain-fall estimates over the ocean are derived from satellite data such as microwave SSM/I, or OLR). However, over the whole domain, 57.7% of the GPCP grid points are significantly discriminated by the partition at the 95% confidence limit, and 42.6% at the 99% confi-dence limit. This demonstrates the validity and use-fulness of the partition, though it should be noted that it is not necessarily the best tool for differentiating rainfall patterns over the region.
5. CONCLUSIONS
A dynamical cluster analysis was applied to the NCEP-2 zonal (U ) and meridional (V ) circulation
anomaly fields, averaged on a pentad (5 d) timescale, for a domain extending from 20° N to 20° S and 20 to 60° E, centred on equatorial East Africa. For the East African MAM and OND rainy seasons in 1979–2002, the analysis led to a partition into 7 clusters.
The partition significantly discriminates wind anom-alies over a major part of the domain (Hotelling test, 95% confidence level) but also precipitation anom-alies, essentially on the eastern and SE parts of the African continent (ANOVA, 95% confidence limit). Four of the 7 clusters obtained are involved in particu-larly wet or dry spells over eastern Africa.
On the one hand, some of the clusters correspond more or less to previously known patterns such as the ‘bridge’ and the ‘drift’ models, empirically described by Johnson & Mörth (1960). Others strongly resemble the patterns associated with abnormally wet spells over southern Africa and Madagascar, interacting with the mid-latitude lows (Todd & Washington 1999). Of interest here is that an objective and systematic parti-tioning has pointed out atmospheric configurations that had been recurrently observed by synoptical meteorol-ogists, or identified by previous studies. On the other hand, 2 clusters clearly resemble the cellular patterns that are usually associated with opposite phases of the Madden–Julian Oscillation; their phase-locking to the intraseasonal cycle reinforces this conclusion. The rain-fall anomalies associated with these clusters suggest that the East African relief complicates the local re-sponse of the rains to these circulation patterns. More generally, 5 of the 7 clusters are closely related to given phases of the Madden–Julian Oscillation, confirming that it is the dominant mode of variability at the intraseasonal timescale over the region. The El Niño–Southern Oscillation also partly controls the frequency of the clusters during the northern spring season.
Nevertheless, partition remains a simplifying ap-proach to the variability of atmospheric configu-rations. Of course, it objectively describes the most frequent patterns, but it does not pretend to capture or to accurately approximate their whole spatial and temporal diversity. Atmospheric fields such as geo-potential height or wind flows are indeed continuous functions of time, and such a classification artificially makes analysed variables discrete. However, parti-tioning algorithms, such as dynamical cluster analy-sis, have already shown their utility in climatology and meteorology in several studies. The fundamental aim of such approaches is to explain a maximum of variance (by describing as accurately as possible the atmospheric fields) with a minimum number of clus-ters.
The physical nature of the rain-causing processes is still to be explored. Beyond the influence of the Madden–Julian Oscillation on East African rainfall (B. Pohl & P. Camberlin unpubl.), the obtained patterns suggest a probable contribution of the mid-latitude disturbances on regional circulation and precipitation anomalies. The latter aspect may constitute the object of forthcoming studies.
Acknowledgements. The authors thank the ‘Climate Variabil-ity Analysis Group’ (CNRS INLN, Nice, and CNRS LMD, Paris), who computed the red-noise tests in the ANAXV soft-ware package. This work was carried out as a part of the LOTI project funded by the French Programme National d’Etudes de la Dynamique du Climat (PNEDC).
24°N
12°N
0°
12°S
24°S
10°E 25°E 40°E 55°E 70°E Fig. 12. ANOVA between the classification and GPCP-estimated precipitations. Shaded areas delimit significantly discriminated pentad rainfall anomalies (light grey: 95% con-fidence level, dark grey: 99% concon-fidence level) in MAM + OND 1979–2002. The classification domain is shown as a box
LITERATURE CITED
Beltrando G, Cadet DL (1990) Interannual variability of the short rain season in East Africa: relationships with general atmospheric circulation. Veille Clim Satellitaire 33:19–36 Black E, Slingo J, Sperber KR (2003) An observational study of the relationship between excessively strong short rains in Coastal East Africa and Indian Ocean SST. Mon Weather Rev 131:74–94
Camberlin P, Okoola RE (2003) The onset and cessation of the ‘long rains’ in eastern Africa and their interannual vari-ability. Theor Appl Climatol 75:43–54
Camberlin P, Philippon N (2002) The East African March–May rainy season: associated atmospheric dynam-ics and predictability over the 1968–1997 period. J Clim 15:1002–1019
Camberlin P, Wairoto J (1997) Intraseasonal wind anomalies related to wet and dry spells during the ‘long’ and ‘short’ rainy seasons in Kenya. Theor Appl Climatol 58:57–69 Cheng X, Wallace JM (1993) Cluster analysis of the northern
hemisphere wintertime 500-hPa height field: spatial pat-terns. J Atmos Sci 50:2674–2696
Desbois M, Sèze G, Szejwach G (1982) Automatic classifica-tion of clouds on METEOSAT imagery: applicaclassifica-tion to high level clouds. J Appl Meteorol 21:401–412
Gruber A, Su X, Kanamitsu M, Schemm J (2000) The compar-ison of two merged rain gauge-satellite precipitation datasets. Bull Am Meteorol Soc 81:2631–2644
Hastenrath S (2000) Zonal circulations over the equatorial Indian Ocean. J Clim 13:2746–2756
Huffman GJ, Adler RF, Rudolf B, Schneider U, Keehn PR (1995) Global precipitation estimates based on a tech-nique for combining satellite-based estimates, rain gauge analysis, and NWP model precipitation information. J Clim 8:2810–2823
Huffman GJ, Adler RF, Rudolf B, Schneider U, Keehn PR (1997) The Global Precipitation Climatology Project (GPCP) com-bined precipitation dataset. Bull Am Meteorol Soc 78:5–20 Huth R (1996) An intercomparison of computer-assisted
circu-lation classification methods. Int J Climatol 16:893–922 Johnson DH, Mörth HT (1960) Forecasting research in East
Africa. In: Bargman DJ (ed) Tropical meteorology in Africa. Munitalp Foundation, Nairobi, p 56–137
Kabanda TA, Jury MR (2000) Synoptic evolution of composite wet spells over Northern Tanzania. Clim Res 15:239–248 Kalnay E, Kanamitsu M, Kistler R, Collins W and 18 others (1996) The NCEP–NCAR 40 year reanalyses project. Bull Am Meteorol Soc 77:437–471
Kanamitsu M, Ebisuzaki W, Woollen J, Yang SK, Hnilo JJ, Fiorino M, Potter GL (2002) NCEP-DOE AMIP II reanaly-sis (R-2). Bull Am Meteorol Soc 83:1631–1643
Kiladis GN, Weickmann KM (1997) Horizontal structure and seasonality of large-scale circulations associated with sub-monthly tropical convection. Mon Weather Rev 125:
1997–2013
Madden RA, Julian PR (1971) Description of a 40–50 day oscillation in the zonal wind in the tropical Pacific. J Atmos Sci 28:702–708
Madden RA, Julian PR (1972) Description of global-scale circulation cells in the tropics with a 40–50 day period. J Atmos Sci 29:1109–1123
Madden RA, Julian PR (1994) Observations of the 40–50 day tropical oscillation — a review. Mon Weather Rev 122: 814–837
Matthews AJ (2000) Propagating mechanisms for the Madden–Julian oscillation. Q J R Meteorol Soc 126: 2637–2652
Michelangeli PA, Vautard R, Legras B (1995) Weather regimes: recurrence and quasi stationarity. J Atmos Sci 52: 1237–1256
Moron V, Plaut G (2003) The impact of El Niño Southern Oscil-lation upon weather regimes over Europe and the North Atlantic during boreal winter. Int J Climatol 23:363–379 Mpeta EJ, Jury MR (2001) Intra-seasonal convective structure
and evolution over tropical East Africa. Clim Res 17:83–92 Mutai CC, Ward MN (2000) East African rainfall and the trop-ical circulation/convection on intraseasonal to interannual timescales. J Clim 13:3915–3939
Okoola RE (1999a) A diagnostic study of the eastern Africa monsoon circulation during the northern hemisphere spring season. Int J Climatol 19:143–168
Okoola RE (1999b) Midtropospheric circulation patterns asso-ciated with extreme dry and wet episodes over equatorial Eastern Africa during the Northern Hemisphere spring. J Appl Meteorol 38:1161–1169
Saji NH, Goswami BN, Vinayachandran P, Toshio Y (1999) The dipole mode event: Indian Ocean’s coupled instability phenomenon. Nature 401:360–363
Sissons J (1966) Some examples of synoptic situations that affect East Africa. Weather 21:228–231, 260–262, 298–300 Sud YC, Walker GK, Smith WE (1991) Analysis of a general circulation model simulation of the atmospheric response to the observed sea surface temperatures anomalies of January and February 1983. J Clim 4:107–115
Todd M, Washington R (1999) Circulation anomalies associ-ated with tropical-temperate troughs in southern Africa and the southwest Indian Ocean. Clim Dyn 15:937–951 Von Storch H, Zwiers FW (1999) Statistical analysis in climate
research. Cambridge University Press, Cambridge Washington R, Todd M (1999) Tropical–temperate links in
southern Africa and southwest Indian Ocean satellite-derived daily rainfall. Int J Climatol 19:1601–1616 Wheeler MC, Hendon HH (2004) An all-season real-time
mul-tivariate MJO index: development of an index for monitor-ing and prediction. Mon Weather Rev 132:1917–1932 Zorita E, Tilya FF (2002) Rainfall variability in northern
Tanzania in the March to May season (long rains) and its links to large-scale climate forcing. Clim Res 20:31–40 Editorial responsibility: Otto Kinne,
Oldendorf/Luhe, Germany
Submitted: February 7, 2005; Accepted: May 12, 2005 Proofs received from author(s): July 15, 2005