HAL Id: hal-00317037
https://hal.archives-ouvertes.fr/hal-00317037
Submitted on 1 Jan 2002
HAL is a multi-disciplinary open access
archive for the deposit and dissemination of
sci-entific research documents, whether they are
pub-lished or not. The documents may come from
teaching and research institutions in France or
abroad, or from public or private research centers.
L’archive ouverte pluridisciplinaire HAL, est
destinée au dépôt et à la diffusion de documents
scientifiques de niveau recherche, publiés ou non,
émanant des établissements d’enseignement et de
recherche français ou étrangers, des laboratoires
publics ou privés.
potential vorticity anomalies in the Northern
Hemisphere
P. M. James, D. Peters
To cite this version:
P. M. James, D. Peters. The Lagrangian structure of ozone mini-holes and potential vorticity anomalies
in the Northern Hemisphere. Annales Geophysicae, European Geosciences Union, 2002, 20 (6),
pp.835-846. �hal-00317037�
Annales Geophysicae (2002) 20: 835–846 c European Geophysical Society 2002
Annales
Geophysicae
The Lagrangian structure of ozone mini-holes and potential
vorticity anomalies in the Northern Hemisphere
P. M. James1,2and D. Peters1
1Leibniz-Institut f¨ur Atmosph¨arenphysik, K¨uhlungsborn, Germany
2Lehrstuhl f¨ur Bioklimatologie und Immissionsforschung, Technische Universit¨at M¨unchen, Am Hochanger 13, D-85354
Freising-Weihenstephan, Germany
Received: 12 March 2001 – Revised: 21 November 2001 – Accepted: 18 December 2001
Abstract. An ozone mini-hole is a synoptic-scale area of
strongly reduced column total ozone, which undergoes a growth-decay cycle in association with baroclinic weather systems. The tracks of mini-hole events recorded during the TOMS observation period over the Northern Hemisphere provide a database for building anomaly fields of various meteorological parameters, following each mini-hole cen-ter in a Lagrangian sense. The resulting fields provide, for the first time, a complete mean Lagrangian picture of the three-dimensional structure of typical ozone mini-holes in the Northern Hemisphere. Mini-holes are shown to be as-sociated with anomalous warm anticyclonic flow in the up-per troposphere and cold cyclonic anomalies in the middle stratosphere. Ascending air columns occur upstream and de-scent downstream of the mini-hole centers. Band-pass filter-ing is used to reveal the transient synoptic nature of mini-holes embedded within larger scale circulation anomalies. Significant correlations between ozone and Ertel’s potential vorticity on isentropes (IPV) both near the tropopause and in the middle stratosphere are shown and then utilized by reconstructing the Lagrangian analysis to follow local IPV anomalies instead of ozone minima. By using IPV as a proxy for ozone, the geopotential anomaly dipolar structure in the vertical characteristic of mini-holes is shown to result from a superposition of two largely independent dynamical com-ponents, stratospheric and tropospheric, typically operating on different time scales. Hence, ozone mini-holes may be viewed primarily as phenomena of coincidence.
Key words. Meteorology and atmospheric dynamics
(mid-dle atmosphere dynamics; synoptic-scale meteorology)
1 Introduction
Ever since the pioneering work of Dobson et al. (1929), the variability of column total ozone levels and its association
Correspondence to: P. M. James
(paul@meteo.physik.uni-muenchen.de)
with the passage of weather systems has been a subject of fascinating study. Reed (1950) investigated cases where lo-cally strong ozone decrease occurred, and showed that these synoptic-scale regions lasted typically only a few days. Such events were christened “ozone mini-holes” by Newman et al. (1988). Mini-holes forming on the edge of the Antarc-tic region were investigated by McKenna et al. (1989), while Orsolini et al. (1998) studied the signature of the Northern Hemispheric storm tracks on the ozone field. Indeed, they occur frequently over mid- and high-latitudes of both hemi-spheres during the winter half-year (James 1998a, McCor-mack and Hood, 1997).
The basic dynamics behind mini-hole development have been discussed, for example, by James et al. (1997), who showed the crucial role played by the vertical motion and di-vergence fields. That mini-holes typically form as transient features over warm air masses in regions of anticyclonic ridg-ing in the troposphere was already known by Reed (1950). As a result, local relative vorticity anomalies show strong positive correlations with total ozone (Vaughan and Price, 1991). This was utilized by Peters et al. (1995), who showed that the dynamics of vorticity and indeed isentropic poten-tial vorticity (IPV) development could be used as a proxy for ozone mini-holes. On the other hand, Petzoldt et al. (1994) have shown that anomalously cold air in the stratosphere is a further prerequisite for the formation of strong mini-holes, as confirmed in the modelling study of James et al. (2000). An extreme example of such a case, recorded over Europe at the end of November 1999, was examined by Allaart et al. (2000). Thus, in the middle atmosphere, in contrast to the troposphere, IPV exhibits negative correlations with to-tal ozone. Aspects of the vertical structure of ozone min-ima have also recently been studied by Reid et al. (2000), who showed, for example, that backward trajectories ending at ozone minima over Europe typically have very different source latitudes depending on the isentropic level at the end: minima near the tropopause height typically have trajectories out of the sub-tropics, whereas lower stratospheric minima have trajectories coming from further polewards.
Hence, mini-holes are phenomena which involve the in-terplay between various dynamical factors at different alti-tudes, encompassing a range of spatial and temporal scales. However, except in a limited sense, in some single case stud-ies, a summary description of the general dynamical structure of mini-holes has never been provided observationally until now.
In this paper, the mean three-dimensional structure of var-ious meteorological parameters close to ozone mini-holes is presented in a Lagrangian sense, following the centers of all wintertime mini-holes tracked in a recently produced clima-tology for the Northern Hemisphere (James, 1998b), based on TOMS satellite observations. The data and the analysis method used are described in Sect. 2, and the primary results follow in Sect. 3. In Sect. 4, the correlation between ozone and IPV on different isentropes is investigated in depth for the special case of mini-holes, and the implications are dis-cussed. A summary is given in Sect. 5.
2 Data and methodology
ECMWF reanalysis data for ten winters (DJF), 1982–83 to 1991–92 inclusive, is employed to provide the daily mete-orological fields for this study. The quantities used are the geopotential, temperature and the full wind field in three-dimensions (zonal, meridional and vertical), each interpo-lated to a reduced resolution grid of 6◦ latitude × 5◦ lon-gitude, adequate for the study of mean synoptic-scale at-mospheric structures. In the vertical, the data are available for 17 pressure levels: approximately 11 in the troposphere and 6 in the stratosphere, the highest being at 10 hPa. The Ertel’s IPV data used in the study was calculated at LIAP-K¨uhlungsborn from the ECMWF data using a methodology described by Bartels et al. (1998).
The Northern Hemisphere mini-hole climatology of James (1998b) is based on detrended daily total column ozone ob-servations from the Nimbus-7 TOMS instrument, version 7. Over 500 mini-hole events, defined as synoptic-scale ozone minima at least 70 DU below climate mean levels for the respective location and season, were recorded over the mid-latitudes during the 10 winters. Since many are trackable for a number of days, the above mini-holes contribute a total of some 1400 hole days. The daily locations and mini-mum ozone values of their centers were logged and, for this study, interpolated onto the same grid as above.
To build up a set of Lagrangian anomaly fields describ-ing the mean structure of ozone mini-holes, the exact loca-tion of the center of each mini-hole on each day is noted. A large grid array, of hemispheric-spanning dimensions in the horizontal that uses all 17 vertical levels, upon which the Lagrangian fields were accumulated, is centered over this lo-cation. Spherical geometry is taken into account by expand-ing or contractexpand-ing the zonal direction as a function of the cosine of latitude, since grid-lines of longitude converge to-wards the pole in the original data. Hence, a geometrical adjustment is required to ensure that the longitudinal scale
of the Lagrangian grid is constant and not a function of lat-itude, which is different for each mini-hole. The reference latitude for this adjustment was chosen to be 52.5◦N, since
the majority of mini-holes occur between 45◦N and 60◦N. The choice of a reference latitude is somewhat arbitrary and has no qualitative effect on the results. Its purpose is simply to provide a reference spatial scale in the zonal direction for all figures that follow in this paper.
The original data is thus interpolated onto the geometri-cally adjusted Lagrangian grid. Respective climatological mean fields, relative to geographical location, are subtracted in each case so that anomaly fields can be consistently ac-cumulated. A simple linear weighting scheme, with weights proportional to “mini-hole intensity in DU minus 70 DU”, is also applied to give more weight to strong mini-holes and less to weaker events, the latter being inevitably more fre-quent. A set of three-dimensional Lagrangian anomaly fields are thus built up utilizing all of the available daily mini-hole events.
To separate the superimposed effects of large-scale waves and baroclinic transients associated with mini-holes, the re-analysis fields are also subjected to a 2.5 to 6 day band-pass filter, allowing only typical synoptic-scale disturbances through. This band-pass filter has also been applied to the TOMS ozone data to build up a second climatology data set of mini-holes, based in this case on band-pass filtered ozone. This new mini-hole data set is employed in parallel with the filtered reanalysis data, forming a consistent pairing to compliment the primary analysis pair: non-filtered reanal-ysis data with non-filtered ozone mini-holes. Hence, addi-tional Lagrangian anomaly fields are built up for the synop-tic band-pass filtered data and compared with the full field cases.
It is also necessary to synchronize the ozone data sets to the reanalysis data, since the latter is available to us daily at 00:00 UTC, whereas the TOMS instrument logs ozone val-ues close to local noon. Since mini-holes move at a simi-lar speed to baroclinic waves, there could be discrepancies between a mini-hole’s apparent location and its associated anomaly fields, as seen in the reanalysis data. To solve this problem, the tracking information available in the mini-hole climatology is employed to estimate the positions of each mini-hole at 00:00 UTC, both before (backwards synchro-nization) and after (forwards synchrosynchro-nization) the local noon. Both estimates are used in the analysis, weighted according to which 00:00 UTC reanalysis field is closest in time to the local noon in each case. Tests have shown that synchroniza-tion increases the amplitudes of the resulting anomaly pat-terns by some 20% to 30% and produces a more consistent dynamical picture compared with non-synchronized results.
3 The Lagrangian structure of ozone mini-holes
The anomalous Lagrangian distribution of ozone itself around ozone mini-holes is illustrated in Fig. 1. The mean total column ozone anomaly (Fig. 1a) exceeds 100 DU in the
P. M. James and D. Peters: The Lagrangian structure of ozone mini-holes and potential vorticity anomalies 837
Fig. 1. Horizontal cross sections of the Lagrangian mean total column ozone anomaly patterns associated with ozone mini-holes, using (a)
non-filtered ozone, contour interval 10 DU, and (b) 2.5 to 6 day band-pass filtered ozone, contour interval 5 DU. Negative contours dashed. The panels span some 60◦west and east, 25◦south and north, respectively, of the mini-hole centers (‘C’). The east-west scale is based on a reference latitude of 52.5◦N.
centers of the mini-holes logged in the James’ climatology. The pattern is broadly circular, with the region of negative ozone anomalies encompassing roughly 3000 km, although the line of maximum negative anomaly exhibits a definitive eastward tilt from south to north. When the band-pass filter-ing is applied (Fig. 1b), a classic synoptic-scale wave train is revealed. The negative anomaly of around −45 DU asso-ciated with the mini-hole itself is flanked by weak positive anomalies roughly 30◦to the west and east, thus building a pattern of approximate scale wave number 6. Again, a slight eastward tilt from south to north of the whole pattern is sug-gested.
The anticyclonicity in the troposphere associated with mini-holes is clearly seen in the Lagrangian unfiltered wind flow anomaly fields of Fig. 2. In the upper troposphere, a quasi-circular anticyclonic anomaly exists around the mini-hole, with mean horizontal wind anomalies of up to 15 m/s. These anomalies result in a strong ridge in the mean west-erly flow around mini-holes (not shown), while a closed an-ticyclonic cell exists in the lower troposphere. The anticy-clonic anomaly is a deep feature and exists well into the lower stratosphere. A remnant can be seen even at 70 hPa. At this level, a cyclonic anomaly is seen northeast of the mini-hole. Higher still, this becomes strongly dominant, with its amplitude exceeding that in the upper troposphere. Its center tilts westwards with height, eventually sitting over the mini-hole center above 10 hPa.
We note that the statistical significance of these anomaly patterns, and also of most of those that follow in which a recognizable pattern is discussed, is exceptionally high. Re-gions of the patterns that exceed the 99% confidence level,
for example, are not shaded here since if they were, shading would cover most of the areas involved, except the near zero lines, of course, thereby detracting from the visual impact of the diagrams by becoming monotonous in the literal sense of the word.
A set of height-longitude Lagrangian sections of mean anomaly fields are shown pairwise in Fig. 3, using full non-filtered data and the synoptic band-pass non-filtered data.
The full geopotential field anomalies, Fig. 3a, compli-ment the wind flow results above. A positive tropospheric geopotential anomaly, indicating anticyclonicity, coincides with the mini-hole center. It extends well into the lower stratosphere, with maximum amplitudes of about +25 dam around 300 hPa, typically just below the local tropopause (note that the Lagrangian averaging procedure yields a mean tropopause of all events; typically around 200 hPa in mini-holes, higher than otherwise usual in mid-latitudes). A west-ward tilt with height, a characteristic signature of baroclinic waves, is evidenced. The equivalent cross section for the north-south direction (not shown) also shows a northward tilt with height, such that the surface anticyclone is typically some 10◦east and 6◦south of the mini-hole. This correlates well with the common observation that mini-holes tend to form in the warm sectors of surface cyclones in air masses streaming northeastwards around a high pressure ridge.
In the middle stratosphere, a strong negative anomaly is seen, approaching −60 dam around 10 hPa (30–35 km alti-tude). This is centered some 5◦to 10◦east and 3◦north of the mini-hole center and has a far larger zonal scale, between wave numbers 1 and 2, than do the anomalies lower down. This dominant planetary-scale cyclonic flow in the middle
Fig. 2. Horizontal cross sections of the Lagrangian mean horizontal wind vector anomaly patterns associated with ozone mini-holes on
pressure surfaces at (a) 10 hPa, (b) 30 hPa, (c) 70 hPa and (d) 300 hPa. The length of an equivalent 10 m/s vector is indicated. The panels are scaled as in Fig. 1.
stratosphere is probably an indication that many strong mini-holes reach peak intensity under the edge of the stratospheric polar vortex, especially at times when the latter is displaced from the pole (James et al., 2000).
This is confirmed by comparison with the patterns associ-ated with band-pass filtered geopotential data, Fig. 3b. Syn-optic mid-stratospheric anomalies are almost nonexistent, showing that the cyclonic flow indicated in Fig. 3a must be of a relatively long time scale. In the troposphere, the synoptic anomalies have tightened to a wave number 6 pattern, typi-cal for baroclinic systems. This is in good agreement with the findings of Mote et al. (1991), who computed point cor-relation maps of ozone with baroclinic disturbances, albeit essentially an Eulerian approach.
The temperature anomaly field shown in Fig. 3c is con-sistent with the geopotential field. A warm anomaly of up to +7 K fills the mid- to lower troposphere, centered some 5◦west of the mini-hole at the surface, again adding weight
to the warm sector observation earlier. The anticyclonic-ity typically leads to a locally high tropopause such that a sharp reversal in temperature anomalies is seen. At the mean tropopause, a local cold anomaly of about −7 K is formed, but centered somewhat east of the mini-hole. Cold anoma-lies then dominate the stratosphere, exceeding −12 K at near 25 hPa. In contrast to geopotential, the temperature anoma-lies show little meridional displacement away from the mini-hole center. However, as with geopotential, the band-pass filtered temperature data yields a similar tightening of zonal-scales in the Lagrangian anomaly pattern, Fig. 3d, and a vir-tual absence of anomalies in the middle stratosphere.
The vertical wind anomaly field, shown in Fig. 3e, reveals a dipole pattern in the east-west direction. On the western flank of the mini-hole, an anomalous air mass ascent extends throughout all regions of the atmosphere visible in this study. Local maxima are seen in the upper troposphere and the middle stratosphere, where speeds approach +1 cm/s. The
P. M. James and D. Peters: The Lagrangian structure of ozone mini-holes and potential vorticity anomalies 839
Fig. 3. Longitude-height sections of the Lagrangian mean anomaly patterns associated with ozone mini-holes of (a) geopotential, φ, contour
interval 4 dam, and (b) 2.5 to 6 day band-pass filtered geopotential, contour interval 2 dam, (c) temperature, T , contour interval 1 K, and (d) 2.5 to 6 day pass filtered temperature, contour interval 0.5 K, (e) vertical wind, w, contour interval 0.2 cm/s, and (f) 2.5 to 6 day band-pass filtered vertical wind, contour interval 0.2 cm/s, negative contours dashed. The panels span some 60◦west and east of the respective mini-hole centers (‘C’); the horizontal scale based on a reference latitude of 52.5◦N. SFC refers to the 1000 hPa surface.
ascending columns are mirrored downstream of the mini-hole, where an extensive column of air mass descent is seen. In the north-south direction (not shown), the region of anomalous ascent west of the mini-hole is displaced slightly polewards of the central latitude, by about 3◦, and exhibits a polewards tilt with height such that maximum stratospheric ascent is typically about 6◦polewards of the maximum tro-pospheric ascent. In contrast, east of the mini-hole, regions of descent are centered typically around 6◦equatorwards of the central latitude, while the patterns only show a minimal tilt with height.
In the case of band-pass filtered vertical motion, the La-grangian pattern is concentrated in the troposphere. How-ever, qualitative differences here are minimal, since vertical motion energy is particularly concentrated around synoptic time scales anyway. Quantitatively, the band-pass filtered vertical wind amplitudes are actually greater, by 2 to 3 times, than those of the non-filtered data. This implies that the slowly changing components of the vertical wind fields as-sociated with mini-holes must act contrary to those on short time scales, thus tending to dissipate the total column ozone anomalies generated by synoptic disturbances. In the mid-dle stratosphere, above the ozone maximum layer, descent occurs on synoptic time scales directly above the mini-hole centers, encouraging a divergent flow in the lower strato-sphere. This leads to a net ozone loss out of the column, since ozone mixing ratios in the divergence layer are much higher than lower down, supporting the supposition of James (1997) that such a divergence field must play a significant role in the generation of mini-holes. However, since mix-ing ratios typically continue to increase slightly immediately above the divergence layer, the role of the stratospheric com-ponent in generating mini-holes is not directly due to the de-scending air masses, but rather due to equatorward advection in the stratosphere above the mini-hole, as seen in Fig. 2, es-pecially around the 30 hPa level. Since the ozone mixing ra-tio decreases towards the pole at this level, this northwesterly component of the wind advects ozone-poor polar air masses into the stratospheric region above the ozone mini-hole.
In all cases, the vertical wind anomalies are rather weak close to the 100 hPa level, indicating that the stratospheric and tropospheric dynamical components relevant for mini-holes are somewhat detached from each other. Note also that the columns of ascent are typically centered to the west but not at the mini-hole center, where they might be expected. This indicates that the eddies on both synoptic and longer time scales must be adding a significant horizontal advection component to the total advective changes to the ozone col-umn, presumably via the mean southwesterly flow into the mini-hole center.
4 Ertel’s isentropic potential vorticity anomalies and ozone mini-holes
The Lagrangian structure of Ertel’s IPV anomalies associ-ated with ozone mini-holes is presented on three isentropic
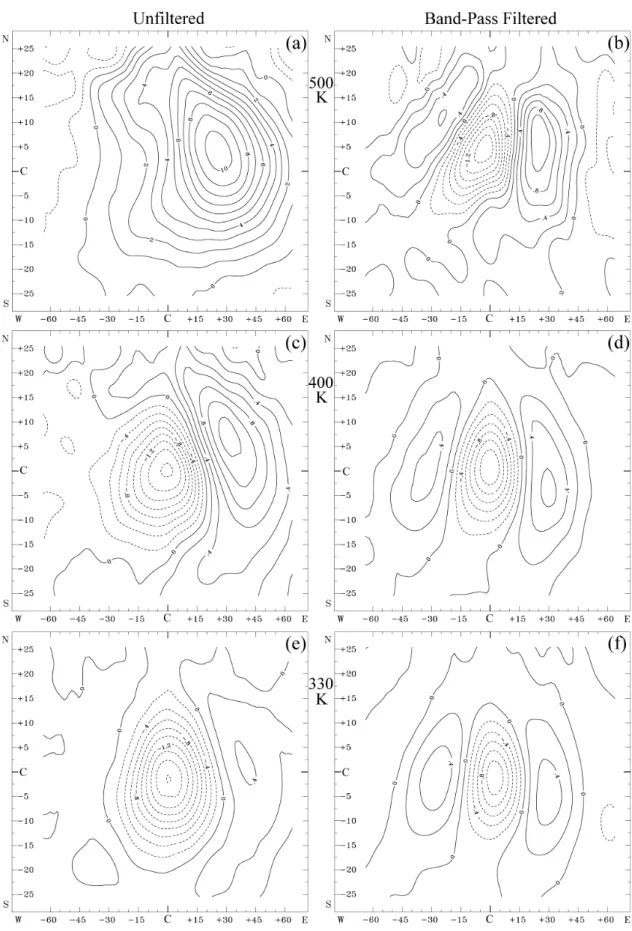
surfaces in Fig. 4. Again, non-filtered results are paired with synoptic band-pass filtered results. At 330 K (Fig. 4e), repre-senting the uppermost troposphere and near the tropopause, IPV shows a strong positive pattern correlation with total col-umn ozone. The negative IPV anomaly center coincides with the mini-hole centers, the former being just fractionally fur-ther south, by about 3◦. The IPV anomaly also has a slightly shorter zonal scale, but this may simply reflect that the ozone pattern is derived from an integration over the total column, inevitably producing a scale-smoothing effect relative to any single level. The band-pass filtered IPV anomalies at 330 K (Fig. 4f) also correlate very well with the equivalent ozone anomalies. The IPV pattern is slightly displaced to the east and south of the ozone pattern, but exhibits a very similar tilting, with the wave train centered further south to the east. At 400 K, now in the lower stratosphere, the band-pass fil-tered IPV anomalies (Fig. 4d) correlate even more accurately with the ozone anomalies. This is perhaps to be expected, since the greatest ozone changes on synoptic time scales oc-cur at around this altitude, where vertical ozone gradients are largest (James et al., 2000). The non-filtered full IPV anomalies at this altitude (Fig. 4c) show an increased posi-tive IPV region to the northeast of the mini-holes. At 500 K (Fig. 4a), in the middle stratosphere, this region becomes strongly dominant and expands over the mini-hole, although it remains centered some 25◦east and up to 6◦north of the mini-hole centers. As with geopotential, this is probably a signature of the stratospheric polar vortex. Band-pass filter-ing reveals that the synoptic wave train signal is still present and in-phase at 500 K (Fig. 4b), although it has become dis-placed northwards by 5◦to 10◦.
One of the summarizing features of the non-filtered IPV structures is the reversal of the sign of the IPV-ozone cor-relation between 330 K and 500 K. At 330 K, negative IPV anomalies would be expected to coincide well spatially with total ozone minima. At 500 K, positive IPV anomalies should coincide with ozone minima, albeit with a possible spatial phase-shift, as suggested from Fig. 4a. Hence, it is feasible to replace the tracking data of ozone mini-holes with similar data for local IPV minima at 330 K or local IPV max-ima at 500 K, and construct new Lagrangian anomaly fields, now centered on respective IPV anomalies, referred to here as IPV-blobs. The IPV-blob tracking is based closely on the algorithms used for mini-hole tracking. An arbitrary IPV threshold is also set to determine which blobs have sufficient amplitude worth tracking, but optimized to yield roughly the same total number of trackable events as the mini-holes had yielded previously. In constructing Lagrangian fields based on these IPV-blobs, we note that the synchronization module must either be switched off (for IPV is naturally already syn-chronized to the reanalysis data) or even inverted, in a sense, when Lagrangian ozone fields are constructed.
To secure the scientific quality of the conclusions that fol-low in this section, only non-filtered IPV-blob analyzes will be discussed here. This limitation is necessary, since the vari-ability of IPV at 330 K has a different typical time scale to that at 500 K. As illustrated in Fig. 5, the 330 K IPV
spec-P. M. James and D. Peters: The Lagrangian structure of ozone mini-holes and potential vorticity anomalies 841
Fig. 4. Horizontal cross sections of the Lagrangian mean potential vorticity (IPV) anomaly patterns associated with ozone mini-holes on
isentropic surfaces at (a, d) 500 K, (b, e) 400 K and (c, f) 330 K. The left-hand panels (a, c, e) use non-filtered data, the right-hand panels (b, d, f) use 2.5 to 6 day band-pass filtered data. Contour interval is 1 IPV unit (1 IPVU = 10−6Km2/kg s) in panel (a) and 0.2 IPV units in all remaining panels. The panels are scaled as in Fig. 1.
Fig. 5. Mean relative frequency spectra (central thickened lines) of IPV at (a) 330 K and (b) 500 K over the ten 90-day winter seasons (DJF),
1982–83 to 1991–92. The amplitudes (×10) have been normalized by the respective mean amplitude over the 45 frequency bands. The thin upper and lower curves show the absolute maximum and minimum amplitudes, respectively, at each frequency observed in any single winter.
trum is only weakly red; energy levels of low frequency vari-ability on time scales of 10 to 30 days, for example, are hardly more than 50% greater than those of baroclinic time scales. However, IPV at 500 K has a strongly red spectrum; energy levels of low frequency variability exceed those of baroclinic variability by as much as 3 times or more. Thus, the middle stratosphere is dominated by slow fluctuations on intraseasonal time scales, whereas baroclinic structures have a far more significant contribution in the upper troposphere. In view of this difference, pre-emptive time-filtering is thus avoided in the IPV-blob analyses since it would otherwise complicate the description of the results.
The Lagrangian mean total ozone anomalies associated with negative IPV-blobs at 330 K is shown in Fig. 6a. As expected, a broadly circular negative ozone anomaly, with an amplitude of about 40 DU, is centered over the IPV-blobs, al-beit with a shorter zonal scale than that associated with mini-holes themselves. To produce a Lagrangian mean ozone min-imum from IPV-blobs at 500 K, positive IPV-blobs must be tracked. Given the displacement of the 500 K IPV anomaly to the east of mini-holes, Fig. 4a, one would expect the equiv-alent ozone minimum to be west of the 500 K IPV-blob cen-ters. This is indeed the case, as seen in Fig. 6b. Here, the ozone anomaly reaches −25 DU, a smaller maximum ampli-tude than the 330-K-derived anomaly, but with a greater hor-izontal scale. Hence, the relative importance of upper tropo-spheric dynamics compared to middle stratotropo-spheric dynam-ics for total ozone changes appears to be quite similar.
On studying further aspects of the Lagrangian structures of the two sets of IPV-blob analyzes, significant and important
differences to the mini-hole analysis are revealed. In Fig. 7, vertical cross sections of the IPV-blob geopotential, temper-ature and vertical wind anomaly fields are shown, to be com-pared with Fig. 3, which shows equivalent mini-hole-based structures. The 330 K IPV-blob signal is noticeably stronger than the mini-hole signal in the troposphere, especially in geopotential (Fig. 7a) and vertical wind (Fig. 7e). However, it decays rapidly into the stratosphere and completely fails to display the strong reversed-sign temperature and geopo-tential signature in the middle stratosphere that is so charac-teristic of mini-holes. Similarly, the 500 K positive IPV-blob signal is strong in the middle stratosphere, but decays into the troposphere without local sign-reversal. These differ-ences are probably due to the typically different time scales of variability of the troposphere and stratosphere, as shown in Fig. 5. In other words, as is well-known, there is little di-rect synchronous correlation between the 330 K layer and the middle stratosphere. The IPV-blob analyzes show only either faster baroclinic fluctuations (330 K) or the slower fluctua-tions in the stratosphere (500 K), whereas ozone mini-holes are intrinsically an integral product of the respective dynam-ics at both time scales.
Looking at the 500 K IPV-blob analysis in more detail, the Lagrangian structure in the middle stratosphere is very sim-ilar to that associated with, but to the east of the mini-holes; the geopotential pattern tilts westward with height (Fig. 7b), the cold anomaly center (Fig. 7d) is lower than the cyclonic anomaly center and descent (Fig. 7f) dominates the region. A very weak, but nevertheless statistically significant anticy-clonic geopotential anomaly does exist well to the west of the
P. M. James and D. Peters: The Lagrangian structure of ozone mini-holes and potential vorticity anomalies 843
Fig. 6. Horizontal cross sections of the Lagrangian mean total column ozone anomaly patterns associated with (a) negative IPV-blobs on the
330 K isentrope, contour interval 5 DU, and (b) positive IPV blobs on the 500 K isentrope, contour interval 2 DU. Negative contours dashed. The panels are scaled as in Fig. 1.
IPV-blob centers. This suggests that some reversed coupling of the stratosphere onto the troposphere exists, probably on longer time scales. The nature and horizontal scale of this geopotential mode (Fig. 7b) is in close agreement with the coupled mode found over the European region in an Eulerian analysis by James et al. (2000). In their analysis, the tro-pospheric anticyclone was relatively a stronger feature, sug-gesting that the general Lagrangian mode may be enhanced when mapped onto certain geographical regions, especially over Europe, or attenuated in certain other regions.
The synchronous detachment of the stratosphere from the troposphere, as viewed from IPV-blobs, is emphasized in Fig. 8, which shows the associated Lagrangian IPV struc-tures themselves at 330 K, 400 K and 500 K, to be compared with the mini-hole IPV structures on the left-hand side of Fig. 4. For 330 K IPV-blobs, the negative anomaly center at 330 K itself (Fig. 8e) is strong and more compact than that associated with vertically integrated total ozone. But the pat-tern remains phase-locked and sign-invariant with height, be-coming embedded in positive IPV anomaly surroundings at 500 K (Fig. 8a). Indeed, relative to mean IPV amplitudes on each respective isentrope, the signal in fact decays rapidly with height. At 330 K, the peak signal is about 82% of the local climatological mean IPV, thus reducing absolute IPV values from about 6 PVU to just 1 PVU at the anomaly cen-ter. At 500 K, the peak signal, also around −5 PVU, is here only about 12% of the local climatological mean IPV, which is thus reduced from about 38 PVU to 33 PVU.
For 500 K IPV-blobs, the signal decay on descent towards the troposphere (Figs. 8b, d, and f) is especially obvious. At 500 K, the peak positive IPV anomaly increases local mean IPV values by some 85%, from 45 PVU to 82 PVU, while
at 330 K the peak positive IPV anomaly is just 0.5 PVU, the addition of just 8% to local mean IPV values. Thus, the result is qualitatively the same as above: IPV-blobs have structures that simply decay with vertical distance from their centers.
5 Summary
A first statistically significant picture of the mean three-dimensional Lagrangian structure of typical mid-latitude wintertime ozone mini-holes has been presented in this pa-per. Band-pass filtering reveals the transient nature of mini-holes, whose synoptic-scale Lagrangian structures are seen to be embedded within significant larger scale anomaly fea-tures. Mini-holes are shown to form in transient waves run-ning over tropospheric anticyclonic ridges, with rising warm air masses on their western flanks and descent to the east, underneath a quasi-stationary region of anomalously cold stratosphere on the cyclonic flanks of the polar vortex. As a result, mini-holes correlate with negative IPV anomalies close to the height of the tropopause and to positive IPV anomalies in the middle stratosphere.
The comparative Lagrangian structures of blobs of nega-tive IPV at 330 K and posinega-tive IPV at 500 K show that dy-namical features in the troposphere have little mean syn-chronous correlation with those in the stratosphere. Anoma-lous blobs of IPV are primarily associated with structures that decay with distance in the vertical and whose charac-teristic time scales are typically greater in the middle strato-sphere than at lower levels. In contrast, ozone mini-holes have geopotential structures with strongly characteristic sign
Fig. 7. Longitude-height sections of Lagrangian mean anomaly patterns associated with (a, c, e) negative IPV-blobs on the 330 K isentrope
and (b, d, f) positive IPV-blobs on the 500 K isentrope. Shown are (a, b) geopotential, contour interval 4 dam, (c, d) temperature, contour intervals 2 K and 1 K, respectively, and (e, f) vertical wind, contour intervals 0.2 cm/s and 0.1 cm/s, respectively, negative contours dashed. The panels are scaled as in Fig. 3.
P. M. James and D. Peters: The Lagrangian structure of ozone mini-holes and potential vorticity anomalies 845
Fig. 8. Horizontal cross sections of the Lagrangian mean IPV anomaly patterns associated with (a, c, e) negative IPV-blobs on the 330 K
isentrope and (b, d, f) positive IPV-blobs on the 500 K isentrope, on isentropic surfaces at (a, d) 500 K, (b, e) 400 K and (c, f) 330 K. Contour interval is 0.5 IPV units in panels (a, c, d, e), 4 IPV units in panel (b) and 0.2 IPV units in panel (f). The panels are scaled as in Fig. 1.
reversals between the troposphere and stratosphere, with as-sociated dynamics that span the above time scale range.
Hence, we conclude that ozone mini-holes are predomi-nantly phenomena of coincidence, requiring the simultane-ous action of two factors on largely different time scales to attain a significant amplitude: tropospheric transient synop-tic activity (warm, ansynop-ticyclonicity) and appropriate middle stratospheric circulation conditions (cold, polar vortex in-fringement). However, while transient waves in the trosphere do not have any strong simultaneous effect on the po-lar vortex, displacements of the latter appear to enhance an-ticyclonicity slightly under its western flanks on longer time scales, somewhat increasing the potential for mini-hole de-velopment. Thus, our findings are, in good agreement with James et al. (2000), who showed that the primary coupled mode of atmospheric variability between the middle strato-sphere and upper tropostrato-sphere, using total column ozone as a further weighting factor, produces anticyclonic ridging on the western flank of the polar vortex when the latter is shifted towards northern Europe. This mode is thereby associated with a strong ozone decrease over Europe, directly between the two anomaly centers in the troposphere and stratosphere. While such a mode appears geographically enhanced over the European region, the associated Lagrangian structures discussed in this paper can be applied generally across the mid-latitudes of the Northern Hemisphere. Whether system-atic regional differences in the structures exist remains to be tested and should be the subject of a future paper.
Acknowledgement. We wish to thank the German Weather Service (DWD) and German Climate Computing Centre (DKRZ) for pro-viding us with the ECMWF-Reanalysis data and thank our col-leagues, J. Schacht, B. Wecke and J. Bartels for their work in com-puting Ertel’s IPV values from that data. The invaluable work performed by the Ozone Processing Team at the NASA/Goddard Space Flight Center, Greenbelt, USA in making the TOMS grid-ded ozone data available to us is greatly appreciated. P. James would like to thank the German Federal Ministry for Education and Research (BMBF), within the context of its Ozone Research Pro-gramme (OFP), for their financial support of project number 01 LO 9510/5.
Topical Editor J.-P. Duvel thanks B. Legras and I. Stachelin for their help in evaluating this paper.
References
Allaart, M., Valks, P., van der A, R., Piters, A., Kelder, H., and van Velthoven, P.: Ozone mini-hole observed over Europe, influence
of low stratospheric temperature on observations, Geophys. Res. Lett., 27, 4089–4093, 2000.
Bartels, J., Peters, D., and Schmitz, G.: Climatological Ertel’s po-tential vorticity flux and mean meridional circulation in the ex-tratropical troposphere – lower stratosphere, Ann. Geophysicae, 16, 250–265, 1998.
Dobson, G. M. B., Harrison, D. N., and Lawrence, J.: Measure-ments of the amount of ozone in the Earth’s atmosphere and it’s relation to other geophysical conditions: Part III, Proc. R. Soc. London, A122, 456–486, 1929.
James, P. M.: An interhemispheric comparison of ozone mini-hole climatologies, Geophys. Res. Lett., 25, 301–304, 1998a. James, P. M.: A climatology of ozone mini-holes over the northern
hemisphere, Int. J. Climatol., 18, 1287–1303, 1998b.
James, P. M., Peters, D., and Greisiger, K. M.: A study of ozone mini-hole formation using a tracer advection model driven by barotropic dynamics, Meteorol. Atmos. Phys., 64, 107–121, 1997.
James, P. M., Peters, D., and Waugh, D. W.: Very low ozone episodes due to polar vortex displacement, Tellus, 52B, 1123– 1137, 2000.
McCormack, J. P. and Hood, L. L.: The frequency and size of ozone “mini-hole” events at northern midlatitudes in February, Geophys. Res. Lett., 24, 2647–2650, 1997.
McKenna, D., Jones, R. L., Austin, J., Browell, E. V., McCormick, M. P., Krueger, A. J., and Tuck, A. F.: Diagnostic studies of the Antarctic vortex during the 1987 Airbourne Antarctic Ozone Experiment: Ozone mini-holes, J. Geophys. Res., 94, 11 641– 11 668, 1989.
Mote, P. W., Holton, J. R., Wallace J. M.: Variability in total ozone associated with baroclinic waves, J. Atmos. Sci., 48, 1900–1903, 1991.
Newman, P. A., Lait, L. R., and Schoeberl, M. R.: The morphol-ogy and meteorolmorphol-ogy of southern hemisphere Spring total ozone mini-holes, Geophys. Res. Lett., 15, 923–926, 1988.
Orsolini, Y. J., Stephenson, D. B., and Doblas-Reyes, F. J.: Storm track signature in total ozone during Northern Hemisphere win-ter, Geophys. Res. Lett., 25, 2413–2416, 1998.
Peters, D., Egger, J., and Entzian, G.: Dynamical aspects of ozone mini-hole formation, Meteorol. Atmos. Phys., 55, 205– 214, 1995.
Petzoldt, K., Naujokat, B., and Neugebohren, K.: Correlation be-tween stratospheric temperature, total ozone and tropospheric weather systems, Geophys. Res. Lett., 21, 1203–1206, 1994. Reed, R. J.: The role of vertical motions in ozone – weather
rela-tionships, J. Met., 7, 263–267, 1950.
Reid, S. J., Tuck, A. F., and Kiladis, G.: On the changing abundance of ozone minima at northern midlatitudes, J. Geophys. Res., 105, D10, 12 169–12 180, 2000.
Vaughan, G., and Price, J.: On the relation between total ozone and meteorology, Q. J. Roy. Met. Soc., 117, 1281–1298, 1991.