The Effect of Imperfect Cues on the Reception of
Cued Speech
by
Maroula Sarah Bratakos
S.B., Massachusetts Institute of Technology (1993)
Submitted to the Department of Electrical Engineering and
Computer Science
in partial fulfillment of the requirements for the degree of
Master of Engineering in Electrical Engineering
at the
MASSACHUSETTS INSTITUTE OF TECHNOLOGY
September 1995
( Massachusetts Institute of Technology 1995. All rights reserved.
-
-_
I
/ 3
· /
I
Author
...
...
Department of Electrical Engineering and Computer Science
14 August 23, 1995
Certified
by...
Louis D. Braida
Henry E. Warren Professor of Electrical Engineering
,
/a ~ j
i
·
Thesis Supervisor
Accepted by ...
.1
..
.
Frederic R. Morgenthaler
Chairman, Department
mmittee on Graduate Theses
... -:·A i.;-:; $tETTS ItS'qITUTE
OF TE.CHNOLOGY
The Effect of Imperfect Cues on the Reception of
Cued Speech
by
Maroula Sarah Bratakos
Submitted to the Department of Electrical Engineering and Computer Science on August 23, 1995, in partial fulfillment of the
requirements for the degree of
Master of Engineering in Electrical Engineering
Abstract
Manual Cued Speech (MCS) is a supplement to speechreading that reduces lipreading errors by reducing the ambiguity of lip shapes. The effects of cues on the reception of Cued Speech were studied to determine the feasibility of building a real-time au-tomatic cueing system that would employ a phonetic speech recognizer. Synthetic cues based on the groups of MCS were superimposed on prerecorded sentences and simulated phone errors consisting of substitutions, deletions and insertions were intro-duced at rates similar to those of current ASRs. The effect of delayed cue presentation was also explored. The synthetic cues were discrete and presented at a slightly faster rate than MCS. Five deaf, experienced cue receivers were tested on their ability to speechread key words in sentences under 12 synthetic cue conditions. Results were compared with their scores on SA and MCS. Although scores on the perfect synthetic cues (PSC) condition did not quite attain the high scores obtained with MCS, differ-ences between the two conditions were not statistically significant. Subjects seemed unaffected by the discrete nature of the cues and the faster presentation. Average scores for conditions with 10% and 20% phone error rates were 69% and 60% correct, respectively. The average score on the REAL condition, which contained sentences processed by an actual phonetic recognizer and a 21% phone error rate, was 70% correct. Subjects performed better on REAL because its key word error rate was low, probably due to phone errors occurring nonuniformly throughout the sentences. In contrast, the phone errors were uniformly dispersed in the 10% and 20% error con-ditions. Results on other conditions suggest that deletions affect subjects' abilities to speechread sentences more than insertions. In addition, cue presentation delays of more than 33msec greatly reduce speechreading scores. On all 12 synthetic cue conditions subjects achieved higher scores than with SA indicating that even erro-neous cues would aid those who speechread. The results of this study, in conjunction with recent advances in phonetic speech recognizers, suggest that building a real-time automatic cueing system is feasible and would be beneficial to deaf cue receivers. Thesis Supervisor: Louis D. Braida
Acknowledgments
There are many people I want to thank for their help and support over the past year, without whom I would not have made it so far so fast (yes, these are the sappy thank yous that Academy Award speeches are made of). First and foremost. I have to thank my advisor, Lou Braida, who was always there with suggestions, advice and a helping hand (not to mention a camera at my water polo games). His optimism and support throughout the year were invaluable.
Of course, this project would not have been possible without Paul Duchnowski. He provided the ASR errors and expertise that went into my thesis. along with the wisdom on thesis research to keep me sane. Thanks also to Fred and Becky who did the little tasks that were amazingly boring but extremely important. Speaking of boring, thanks to Lorraine Delhorne who helped me record (and rerecord) hundreds of sentences and test subjects on the weekends. It's been fun exchanging stories with her and her cohort; Charlotte Reed. Charlotte got me hooked on the seventh floor when I did my senior thesis with her, so a special thanks goes out to her.
Thanks to the 'boys' office' (Joe, Phil, and Dave) for letting me hang out in their doorway and helping me with my subjects. Also thanks to all the people not in the lab who offered friendship and support: Clara, Cheryl, Tom, the women's water polo team and especially my mom, John and Tracy.
The most important group of people I need to thank are my subjects. They are amazing individuals who have achieved so much despite being deaf. I have a great respect for them and their accomplishments. I especially want to thank Sarah, who more than 15 years ago introduced me to the world of deafness and Cued Speech. She provided the motivation for this thesis. Also, thank you to my other motivator, Stasie, who had the patience to teach me how to Cue, always had a smile and encouraging word, and was a great friend.
Last, but not least, thank you to the best officemate ever, Jeanie. Without 'the beach' I don't think either of us would have made it. Jeanie, I'm going to miss you. Thanks for being a friend.
Contents
1 Introduction 1.1 Background. 1.2 Objective ... 2 Methods 2.1 Speech Materials. 2.1.1 CID Sentences . 2.1.2 Clarke Sentences. 2.1.3 Harvard Sentences. 2.2 Recording of Synthetic Cues ....2.2.1 The Cues. 2.2.2 The Playlists.
2.2.3 Converting Times to Frames 2.2.4 Converting Phones to Cues 2.2.5 Recording ... 2.3 Subjects ... 2.4 Experimental Conditions. 2.4.1 Phase I. 2.4.2 Phase II. 2.5 Procedure ... 2.5.1 Phase I. 2.5.2 Phase II . . . . 9 9 12 13 . . . 13 . . . 14 . . . 14 . . . 14 . . . 15 . . . 15 . . . 15 . . . 16 . . . 16 . . . 17 . . . 18 . . . 19 . . . .20 . . . 22 . . . 25 . . . 26 . . . 27
3 Results 3.1 Data Analysis ... 3.1.1 Scoring . ... 3.1.2 Statistical Analysis . . . 3.2 Phase I ... 3.3 Phase II.
3.4 Comparisons across Phases . . . 3.5 Phone Error Rates vs Key Word 3.6 Comparison to Autocuer Study
4 Discussion
4.1 Effect of Synthetic Cues 4.2 Effect of Error Rate . . . 4.3 Effect of Delay.
4.4 Choice of Cue Groups 4.5 Summary ...
A Auxiliary Experiment: The Effect the Reception of Cued Speech
A.1 Purpose. A.2 Methods ... A.3 Results ... A.4 Discussion ... 28 . . . .28 . . . .28 . . . .28 . . . .29 . . . 31 . . . .34 Error Rates . . . .... 36 . . . .. 40 43 . . . .43 . . . 4 5 . . . 49 . . . 49 . . . 50
of Limited Hand Movements on 55 55 55 56 56 B Statistical Analysis B.1 ANOVA. B.2 F Test ... B.3 t-tests ... C Raw Data
D Transcription Files and Playlists
58 58 60 61 63 67
...
...
...
...
]E Confusion Matrices 75
List of Figures
2-1 Block diagram of system used to superimpose cues. Error conditions of Phase I (no delay) ...
Delay conditions of Phase I ...
Random delay conditions of Phase II... Conditions containing 20% errors in Phase II. REAL condition compared with INS and RD2.. Comparison of error conditions across phases. Comparison of delay conditions across phases. Phase I . . . .
Phase
II...
... . 30
... . 31
... . 33 . . . 34... . 35
... . 36
... . 37
... . 40
... . 41
18 3-1 3-2 3-3 3-4 3-5 3-6 3-7 3-8 3-9List of Tables
1.1 Cue Groups of Manual Cued Speech.
2.1 Histories of subjects experienced in receiving Manual Cued Speech (MCS). . . . .
2.2 Experimental Conditions for Phase I... 2.3 Experimental Conditions for Phase II ...
Average test scores for subjects in Phase I... Average test scores for subjects in Phase II ...
Conditions SA, MCS and PSC across both Phases . ... Phone Error Rate and Key Word Error Rate . ...
Percent of key words containing errors correctly identified. . . Percent of key words containing no errors correctly identified.
. . . . 29 . .. . 32 . . . . 35
... . 38
. . . . 39... . 39
A.1 Scores for Limited Hand Movement Study ...
A.2 Harvard sentences (59-72) position coordinates for LM.
57 57
Analysis of Variance for Condition-Subject Interaction F Tests ...
t-tests
...
Phase I Training Results ... Phase I Testing Results ... Phase II Training Results. ...Phase II Testing Results ... .
59 60 62 63 64 65 66 10 18 21 23 3.1 3.2 3.3 3.4 3.5 3.6 B.1 B.2 B.3 C.1 C.2 C.3 C.4
D.1 CID sentences position coordinates ... 73
D.2 Clarke sentences position coordinates ... 73
D.3 Harvard sentences (1-58) position coordinates ... 73
D.4 Harvard sentences (59-72) position coordinates ... 74
E.1 Confusion matrix CM1 used to generate errors in conditions SD1, SD2, D1, D3, D5, RD1, RD2, MARK ... 76
E.2 Confusion matrix CM2 used to generate errors in condition INS .... 77
Chapter 1
Introduction
1.1 Background
Although other methods of communication are available to the deaf (e.g. Sign Lan-guage, fingerspelling), many rely on lipreading to understand spoken lanLan-guage, par-ticularly when communicating with members of the hearing world. Unfortunately, many phonemes appear similar on the lips; some are even indistinguishable. Such confusions can result in miscomprehension of over fifty percent of the words in spo-ken conversations, even by the most experienced lipreaders. Phonemes that appear similar on the lips and are often confused with each other are sometimes grouped into categories called visemes, e.g. /p,b,m/, /f,v/, /w,r/, and /dh,th/ [1].
An alternative communication method for the hearing impaired, Manual Cued Speech, was developed to alleviate lipreading ambiguities by Dr. Orin Cornett in 1967. Eight consonant handshapes and five vowel hand positions are combined to pro-vide real-time supplemental information about the syllables appearing on the lips [2]. Viseme group ambiguities are resolved by assigning a different cue to each phoneme in a viseme group. Thus, phonemes in a single cue group can be easily discriminated through vision, although the cues do not contain enough information in themselves to permit speech communication without lipreading [3]. The cue groups of Manual Cued Speech are listed in Table 1.1. Diphthongs are cued by sequentially combining two vowel groups. Uchanski et al. [4], and Nicholls and Ling [3] have conducted studies of
'Table 1.1: Cue Groups of Manual Cued Speech.
Consonant Handshapes
Group Name (Number) Phonemes d-handshape (1) /d,p,zh/ k-handshape (2) /k,v,dh,z/ h-handshape (3) /h,s,r/ n-handshape (4) /n,b,wh/ t-handshape (5) /t,m,f/ 1-handshape (6) /l,sh,w/ g-handshape (7) /g,j,th/ ng-handshape (8) /ng,y,ch/ Vowel Positions
Group Name Phonemes
mouth /ee,er/
chin /aw,eh,oo/
throat /ae,ih,u/
side-front /ah,o/
side-down /uh/
the benefits Cued Speech provide to experienced Cued Speech receivers. Both stud-ies found a significant increase in speechreading scores on sentence materials when Cued Speech was employed. For example, Uchanski et al. tested four experienced Manual Cued Speech receivers on Clarke sentences and Harvard sentencesl under the conditions of speechreading alone (SA) and speechreading supplemented with Cued Speech (MCS). The average score for the Clarke sentences in the SA condition was
45% while in the MCS condition the average score was 97%. The average score for
the more difficult Harvard sentences in the SA condition was 25% while the average for the MCS condition was 84% [4]. Thus, a hearing impaired person using Cued Speech can understand nearly all the words in an everyday conversation. Even in more challenging situations, where contextual cues are unavailable, the benefit that Cued Speech provides is enormous.
Unfortunately, only a small number of people know how to produce cues, which
1The Clarke sentences cover everyday topics and employ contextual cues. By contrast, the
limits the number of people who can communicate with deaf individuals via Cued Speech. Dr. Cornett and his associates at Gallaudet College and the Research Trian-gle Institute began development of the 'Autocuer', a device to produce cues automat-ically, in the early 70s. Their idea was to design a wearable, real-time system that was capable of analyzing speech and producing cues, similar to those of Cued Speech, and then presenting these cues via a seven-segment visual display [5]. The automatic speech recognizer (ASR) used in the most recent implementation of the Gallaudet-R.T.I. Autocuer had a phone recognition accuracy of 54%, with a substitution2 rate
of 13% and a deletion rate of 33%. In 1981, six deaf students were tested using this prototype version of the Autocuer on isolated word identification. Rather than using handshapes, a matrix of light-emitting diodes was superimposed over a prerecorded
videotape of the speakers. A fixed delay of 150msec was also introduced between
onset of lip movement and cue presentation (to simulate processing delay). After 40 hours of training, the subjects were tested under seven conditions which simulated various error rates.. The condition most comparable to the Autocuer's ASR had a 59% accuracy with a 12% substitution rate and a 28% deletion rate. The average
score on this condition was 67% compared with 59% uncued and 86% perfect cues [6].
The main problem with the Autocuer lies in its low phoneme identification accuracy and high deletion rate.
Two other conditions in the Autocuer study simulated more accurate ASRs. Both had phone recognition accuracies of 80%. The first condition simulated an 11% substitution rate and a 9% deletion rate. The average score for subjects on this condition was 77%. The second condition contained a 5.5% substitution rate and a 14.5% deletion rate with subjects scoring 82% on average [6].
Great strides have been made in the speech recognition field since the conception of the Autocuer. Although many ASRs are aimed at word recognition, several pho-netic recognition systems have been developed. Lee and Hon have reported phone
2The errors made by ASRs can be categorized into three types: substitution (incorrect phone
identification), deletion (no identification, although phone is present), and insertion (identification although phone is not present).
recognition accuracy of 66% on a speaker independent system using a right-context-dependent phone model. The substitution rate for this system was 19%, the deletion rate was 6% and the insertion rate was 7% [7]. Robinson and Fallside have achieved 69% phone recognition accuracy on a speaker-independent system using connection-ist techniques [8]. Zissman achieved 67% phone recognition accuracy on a HTK speaker-independent system [9], with a substitution rate of 20%, a deletion rate of 6% and a insertion rate of 7% [10]. On a HTK speaker-dependent system, Duchnowski has achieved a phone recognition accuracy of 79%. This system used right-context-clependent phone modeling, had a phone substitution rate of 11%, a phone deletion
rate of 4% and a phone insertion rate of 6% [11].
1.2 Objective
The Sensory Communication Group of RLE is taking advantage of the recent ad-vancements in the ASR field to design an automatic cued speech system to be used by the deaf in controlled settings such as classrooms and homes. The proposed system will use a computer to simultaneously display the speaker and cues. The objective of this study was to evaluate the effect ASR errors have on Cued Speech reception. Synthetic cues were superimposed on prerecorded sentences and simulated errors con-sisting of substitutions, deletions and insertions, as well as delayed cue presentation were introduced. The synthetic cues resembled those of Manual Cued Speech so that experienced, deaf Cued Speech receivers could be used as subjects with a minimal amount of training. Subjects were tested on the synthetic cued speech materials and the results were compared with their speechreading alone and Manual Cued Speech scores. If a significant improvement over speechreading alone is achieved with the synthetic cued speech that includes errors, then building a real-time automatic cued speech system would be beneficial. The results may also suggest areas for improving the ASR by providing insight into how much error is tolerable and what types of errors effect speechreading scores the most.
Chapter 2
Methods
2.1 Speech Materials
Three different types of sentences were used in the study: CID [12], Clarke [13] and Harvard [14]. The sentences were spoken by the same female teacher of the deaf (SR) with and without cueing. Three versions of the sentences were simultaneously recorded onto videotape, along with a running SMPTE time code. The first version was an audiovisual signal using a wide angle camera lens (the face filled up the top half of the vertical viewing area and roughly three-eighthes of the horizontal viewing area). The second version was an audiovisual signal using a narrow angle camera lens (the face filled up the top five-sixths of the vertical viewing area and nine-sixteenths of the horizontal viewing area). The last version was a PCM version, in which just the audio signal was recorded onto the videotrack of the tape.
With the aid of the SMPTE time code on window dub tapes, the beginning and end of the visual and audio portion of each sentence were noted. The audio tracks of the sentences from the PCM tapes were digitized and a phonetic transcript for each sentence, with corresponding time code markings, was produced using a Sensemetrics Speech Station. The sentences were transfered to laserdisc using the beginning and end times for the visual portion of the sentence.
'2.1.1 CID Sentences
There are ten lists of CID sentences with each list containing ten sentences. Each sentence contains three to eight key words, with a total of 49-51 key words per list. The CID sentences are comparatively easy to speechread with subject matter con-sisting of everyday, conversational topics. Example sentences include 'Walking's my
favorite exercise.', 'Do you want an egg for breakfast?', and 'Everything's all right.'
All 100 sentences, in the wide angle view without cueing, were used in training.
2.1.2 Clarke Sentences
There are 600 Clarke sentences with five to ten words per sentence (no key words are indicated). The Clarke sentences are somewhat more difficult to speechread than the CID sentences with subject matter consisting of conversational topics arranged in a predictable manner. Example sentences include 'Seven boys made a long table at
school.', 'Miss Brown liked to read about animals.', and 'The house behind the hospital was old.' The wide angle, noncueing versions of sentences 1-30, 41-50, 61-140, and
151-230 were used in training, along with the wide angle, cueing versions of sentences 401-420.
2.1.3 Harvard Sentences
There are 72 lists of Harvard sentences with each list containing ten sentences. Each sentence contains five key words for a total of 50 key words per list. The Harvard sentences are more difficult than the CID and Clarke sentences because they have fewer contextual cues. Example Harvard sentences include 'It's easy to tell the depth of a well.', 'Do that with a wooden stick.', and 'The sky that morning was clear and
bright blue.' Only the narrow angle versions of the sentences without cueing were
transfered to videodisc and used in testing. Only 15 lists of the wide angle versions of Cued sentences were transfered and used.
2.2 Recording of Synthetic Cues
To investigate the effect imperfect cues have on the reception of cued speech, synthetic cues were superimposed on the speech materials and recorded onto laserdisc. The synthetic cues differed from manual cues in two ways. First, the synthetic cues were presented discretely rather than continuously as in Manual Cued Speech so transitions were absent. Second, the synthetic cues were presented at a faster rate than in Manual
Cued Speech (150 WPM vs 100 WPM) [4].
2.2.1 The Cues
The same handshapes used in Manual Cued Speech were used for the synthetic cues. Truevision's Nuvista software for the Macintosh computer was used to capture images of the eight handshapes from the cued speech sentence materials on laserdisc. The images were then edited and reduced in Adobe's Photoshop. Each handshape was saved in 32 bit PICT color format and was approximately 48kb in size.
2.2.2
The Playlists
The program KeMIX [15] was used to superimpose the handshapes onto the video sentence material so that the presentation of the cues and the movement of the lips were properly synchronized. The program took as input a file in the following format: 1) A position list; containing screen coordinatesl for the vowel positions (chin, throat, mouth, side-front and side-down). Each handshape had its own set of coordinates for each vowel position; 2) An image list specifying the names of the handshape files; 3) A sentence list containing a sentence identifier followed by the sentence's start and stop frames on videodisc; 4) A playlist containing a sentence identifier followed by a start and stop frame for a particular cue followed by the position and handshape for
that cue (see Appendix D).
1There were four different coordinate lists: one for the CID sentences, one for the Clarke sentences, one for Harvard lists 1-58, and one for Harvard lists 59-72.
2.2.3 Converting Times to Frames
The phonetic transcriptions for the sentences specified a time in milliseconds at which each phone acoustically began as well as a symbol indicating the role each phone played in the sentence, i.e. if the phone was the beginning, middle, or end of a syllable. The program State was written in C to convert the phonetic transcriptions into the playlist file format described above. The program took as input a transcription file and a file containing the sentence name with its start and stop frames on videodisc. The output was the playlist. One important task that the State program accomplished was converting the phone start times in milliseconds to laserdisc frames. The speech was digitized at 10000 samples per second from the PCM tapes. However, the Dyaxis Digital Audio Processor used to digitize the sentences over-sampled the speech, so all times had to be multiplied by a factor of 0.964. In addition, the acoustic waveform on the PCM tapes lagged the acoustic signal on the other tapes by approximately 530 msec. This value was subtracted from all the times prior to multiplying by the Dyaxis correction factor. Finally, millisecond times were changed to laserdisc frames and rounded to the nearest frame by the conversion factor of 30 frames per second. Converting start times to video frame numbers reduced their time resolution from a tenth of a millisecond to 33msec. The start times listed in the transcription files were more accurate than times produced by ASRs which are accurate to 10msec. Thus, the resolution lost by converting to frame numbers was probably insignificant.
2.2.4 Converting Phones to Cues
Manual Cued Speech assumes that consonants are typically followed by vowels and encodes each CV combination as a handshape at a specified position. MCS includes special rules for other combinations such as VC, C, CC and CVC. Based on these rules, State converted the phones to cue positions and handshapes with the use of the special symbols associated with the phonetic labels in the transcription files. The five symbols were: (')-a consonant preceding a vowel at the beginning of a syllable or a vowel at the beginning of a syllable; (,)-a vowel in the middle of a syllable;
(.)-a consonant preceding another consonant at the beginning of a syllable; (*)-a consonant at the end of a syllable; (+)-the release of a stop consonant. The special symbols helped to determine to which consonant/vowel combination a phone belonged (i.e., CV, VC, C, etc.) so that the appropriate MCS rule could be applied. For example, when State encountered a consonant phone label marked by an apostrophe
(') followed by a vowel phone marked by a comma (,) the corresponding consonant was assigned a handshape and the vowel was assigned a position via a lookup routine. As another example, the MCS rule for a consonant occurring by itself is that it should be cued at the side position, so when State encountered consonant phone marked by an asterisk (*), it automatically placed the assigned handshape at the side position.
Once phones were assigned handshapes and positions, State determined the start and stop frames for the cues. Appearance of the cue typically began at the con-sonant start frame and remained in a fixed position until the end of the concon-sonant (for consonants occurring alone) or until the end of the proceeding vowel (for CV combinations). CV combinations that included a diphthong divided the cue duration evenly between the two vowels of the diphthong.
Different versions of State were written to produce the various error conditions discussed below. Also, a later version of State was written that did not require the syllable symbols but instead could process output directly from the ASR.
2.2.5 Recording
A block diagram of the system used to record the synthetic cues superimposed on the sentence materials is shown in Figure 2-1. Digital's VAXstation 4000 (Hooper), running the KeMIX, controlled the Sony LVA-3500 Laser Videodisc player (in remote setting), the Sony IR-5000 Laser Videodisc Processor/Recorder (in remote setting) and the Macintosh Quadra800. Truevision's Nuvista videoboard and software, a peripheral to the Quadra800, coordinated the actual superposition of the handshapes onto the video.
Figure 2-1: Block diagram of system used to superimpose cues.
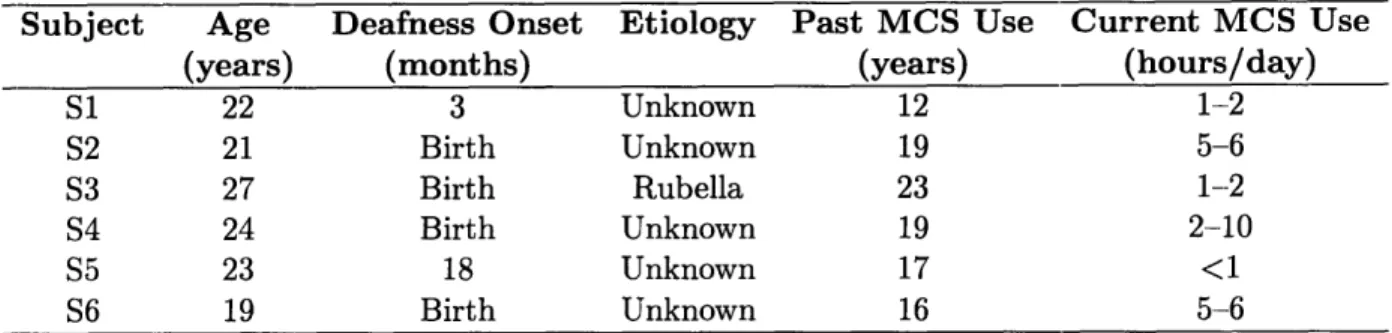
Table 2.1: Histories of subjects experienced in receiving Manual Cued Speech (MCS).
Subject Age Deafness Onset Etiology Past MCS Use Current MCS Use
(years) (months) (years) (hours/day)
S1 22 3 Unknown 12 1-2 S2 21 Birth Unknown 19 5-6 S3 27 Birth Rubella 23 1-2 S4 24 Birth Unknown 19 2-10 S5 23 18 Unknown 17 <1 S6 19 Birth Unknown 16 5-6
2.3
Subjects
Four subjects, between the ages of 21-27, were employed in Phase I and five subjects between the ages of 19-27 in Phase II (see Table 2.1). All subjects were experienced cue receivers, having used Cued Speech for the past 12-23 years. All were native English speakers who were profoundly, prelingually deafened. No sound was presented during testing, so specific hearing losses are irrelevant. Their use of Cued Speech at the time of the study ranged from 1-10 hours per day, usually with a parent or transliterator.
was tested only during Phase I, while S5 and S6 were tested only during Phase II. Subjects S1, S2, S5 and S6 had previous exposure to the speaker through school and prior testing. S3 and S4 had no previous exposure to the speaker.
2.4 Experimental Conditions
The experimental conditions in Phase I were chosen to simulate the type of errors an automatic speech recognizer might make. Substitution and deletion errors were based on the confusion matrix of a discrete HMM phonetic recognizer using context-independent modeling of 49 phones (including deletions, epinthetic and normal si-lences). Recognizer accuracy was 54% correct when tested on sentences from the TIMIT database [16]. The labeled phones in the sentence materials were slightly dif-ferent from those of the HMM (phones /ix/ and /el/, as well as epinthetic and normal silences, were not labeled in the sentences). Inconsistencies between phone labeling conventions were rectified by editing the recognizer's confusion matrix so that it only contained the phones that were labeled in the sentences. The confusion matrix CM1 was derived from the recognizer's confusion matrix by converting percents to numbers of phones recognized and merging phone groups (/ix/ was merged with /ih/ and /el/ was merged with /1/). The silences were proportionally distributed to incorrectly recognized phones (e.g. if 3% of the errors were contained in the matrix entry '/ih/ input, /uh/ output', then 3% of the silences were added to that entry). The overall error rate of CM1 was the same as the recognizer's matrix, 54%, but the distribution of the phones was changed (see Appendix E). The deletion rate for CM1 was 9% and the substitution rate was 37%.
Based on the results of Phase I, the conditions for Phase II were chosen to further investigate the effect of errors. In both phases, a short training session, using the CID and Clarke sentences, was conducted prior to each testing condition. Feedback was provided on the training sentences and all subjects received the same training sentences for each condition.
Be-cause there is no measure of cueing difficulty for the Harvard sentences, it is impossible to predict if one list is equivalent to another. To alleviate this problem, the set of lists used under each condition was varied from subject to subject. Thus, no two subjects
(except S2 and S6 in Phase II) saw the same sentence for a single condition2.
Each Harvard sentence was strictly3 scored on five key words. Each key word is either correct or incorrect, and thus can be modeled as a Bernoulli random variable. Since the Harvard sentences provide few contextual cues, the key words can be con-sidered to be statistically independent, which means the total number of correct key words can be modeled as a binomial random variable with expected value Np and variance Np(l - p), where N is the total number of key words and p is the prob-ability of correctly identifying a key word. Choosing a probprob-ability of 0.84 for the binomial random variable is consistent with results reported by Uchanski et al. [4] of 84% correct on the Harvard sentences in the Manual Cued Speech condition. Since the results are recorded as the fraction of correct key words out of the total number of key words, the expected value for the binomial random variable was divided by
N and the variance by N2. Roughly 95% of the binomial distribution falls within
two standard deviations of the expected value. To limit this two sigma spread to 5 percentage points the above formula for variance is solved for N. 215 key words are needed to achieve a standard deviation of 2.5%. Thus, each condition was tested using four lists (200 key words).
2.4.1 Phase I
There were eight experimental conditions for Phase I: speechreading alone (SA), Man-ual Cued Speech (MCS), perfect synthetic cued speech (PSC), synthetic cued speech with 20% errors (SD1), synthetic cued speech with 10% errors (SD2), synthetic cued speech with 20% errors and one frame of delay (D1), synthetic cued speech with 20% errors and three frames of delay (D3), and synthetic cued speech with 10% errors and
2
Some lists were seen by multiple subjects during the speechreading alone and Manual Cued Speech conditions.
3Strict in the sense that plural nouns were not accepted for singular, past tense was not accepted
:Table 2.2: Experimental Conditions for Phase I.
Error Delay
Condition Rate(%) (frames)
SA 0 0 MCS 0 0 PSC 0 0 SD1 20 0 SD2 10 0 D1 20 1 D3 20 3 D5 10 5
five frames of delay (D5) (see Table 2.2). All conditions were presented on a video monitor without the audio signal.
SA and MCS
The speechreading alone and Manual Cued Speech conditions were used as baseline measures for comparison with the synthetic cue conditions. The sentence materials were recorded onto the laserdiscs without any processing.
PSC
The production of the perfect synthetic cued speech sentences consisted of converting the phonetic transcripts into playlist files using the State program without introduc-ing errors or delays. The condition was perfect in that it was an exact conversion from the phonetic transcriptions. However, native English speakers tend to drop some phones and slur others together. Since the transcriptions came from acoustic waveforms, rather than the sentence orthography, some phonetic events were missing and some were confused.
SD1 and SD2
SD1 and SD2 incorporated 20% and 10% errors respectively without delay. The errors consisted of substitutions and deletions consistent with the errors of the CM1
confu-sion matrix. Production of the playlists involved two steps. The phonetic transcrip-tions were processed by the program S2 [17] which substituted and deleted phonemes at a specified rate (i.e. 20% and 10%). The error rate was achieved by increasing the number of correct identifications for each input phone in CM1 while leaving the number of errors unchanged. For each phone in the transcription file, a non-zero en-try from the corresponding row of the resulting matrix was randomly chosen without replacement. The selected phone replaced the correct phone in a new transcription file (*.lgo). A file (*.lgp) identifying the error phones along with the correct phones to the right was the second output of S2. The new phonetic transcriptions were processed by State which outputed the playlist files (see Appendix D).
I)1, D3 and D5
[)1, D3 and D5, which contained 20%, 20% and 10% errors respectively, also incurred
one, three and five frame delays (33, 100 and 165 msec). New transcription files
containing errors were produced using S2, the same as described for conditions SD1 and SD2. Playlist files were produced by processing the new phonetic transcriptions with delay versions of the State program. The delay versions added the appropriate frame delay to each start time immediately after they had been converted to frame numbers.
2.4.2 Phase II
There were nine experimental conditions (six new conditions) for Phase II: speechread-ing alone (SA), Manual Cued Speech (MCS), perfect synthetic cued speech (PSC), perfect synthetic cued speech with random frame delay (RDO), synthetic cued speech with 20% errors and random frame delay (RD1), synthetic cued speech with 10% er-rors and random frame delay (RD2), synthetic cued speech with 20% erer-rors including insertions (INS), synthetic cued speech with 10% unmarked errors, 10% marked errors and 10% non-errors marked as errors (MARK), and synthetic cued speech with sen-tences processed by a phonetic automatic speech recognizer (REAL) (see Table 2.3).
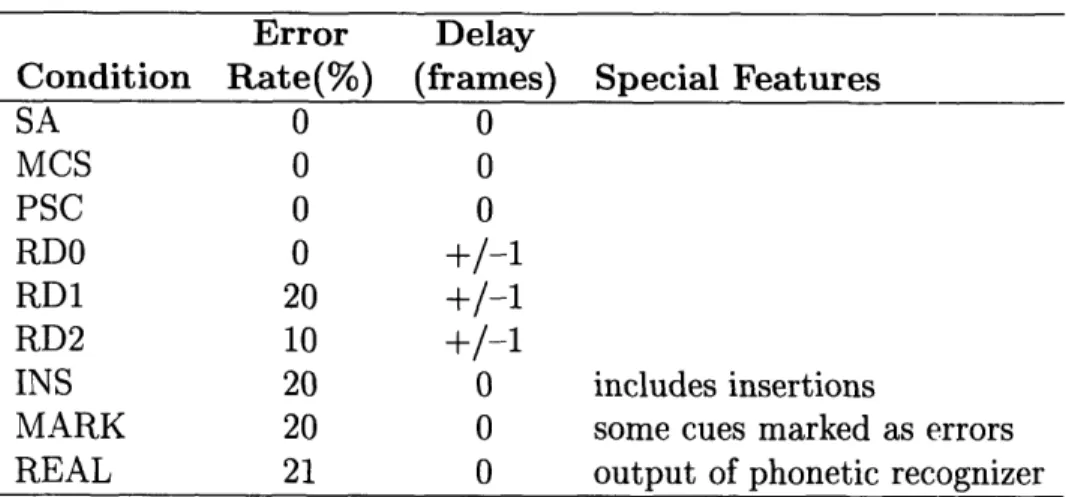
Table 2.3: Experimental Conditions for Phase II.
Error Delay
Condition Rate(%) (frames) Special Features
SA 0 0 MCS 0 0 PSC 0 0 RDO 0 +/-1 RD1 20 +/-1 RD2 10 +/-1
INS 20 0 includes insertions
MARK 20 0 some cues marked as errors REAL 21 0 output of phonetic recognizer
All conditions with errors had substitution and deletions errors, except conditions INS and REAL which also had insertion errors.
RDO, RD1 and RD2
RDO, RD1 and RD2, which contained 0%, 20% and 10% errors respectively, also incurred random delay on a per phone basis. The random advance and delay was suppose to simulate the jitter that may occur in a real-time system. The phonetic transcriptions were processed by S2, as previously described. The new phonetic transcriptions were processed by the random delay version of State. After the start times were converted to frame numbers, a 1 frame advance, 1 frame delay or no delay was randomly chosen for each phone.
INS
Because the CM1 confusion matrix contained no information on insertion errors, the insertions were generated randomly. The sum of deletions and insertions often remains constant for a particular recognizer [18]. CM1 was adapted to contain insertions based on this principle. The number of deletions for each input phone was halved. The total number of removed deletions was evenly distributed to each input phone as insertions. The phonetic transcriptions were processed by S2 using the confusion matrix CM2
edited to include insertions (see Appendix E). When S2 randomly chose an insertion to occur, the correct phone was replaced with the insertion symbol 'ooo'.
The Stateins program was used to process the *.lgp files to output yet another new transcription file in which the 'ooo's were replaced with phones. The correct phone, listed to the right in the *.lgp file, was placed back into the transcription immediately before the insertion symbol. Next, a phone was randomly chosen to replace the insertion symbol. Finally, the length of the inserted phone was looked up in a table and room was made for it by shortening the length of the phones before and after it4. The pre-insert' phone was shortened by calculating the fraction:
'pre-insert' phone length / ('pre-insert' phone length + 'post-insert' phone length). The inserted phone length was multiplied by this fraction and the result was sub-tracted from the 'pre-insert' phone length. The 'post-insert' phone was shortened in a similar manner. For example, if the 'pre-insert' phone was 1931nsec, the 'post-insert' phone 82msec and the inserted phone 48msec, then 33.7msec (48 * 193/275) was subtracted from the end of the 'pre-insert' phone and 14.3msec (48 * 82/275) was subtracted from the beginning of the 'post-insert' phone. However, if shortening either the preceding or proceeding phone caused it to be shorter than 20msec, then only the longer phone was shortened. In the previous example, if the 'post-insert' phone was 25msec, shortening it would cause it to become 19.5msec. In this case all 48msec would be subtracted from the 'pre-insert' phone. If both pre and post phones were shortened to less than 20msec, the inserted phone was reduced by 20% until room could be made without any phone having a length less than 20msec.
Once all the insertion symbols in the transcription file were replaced with phones, a playlist was produced using the State.
4The lengths of the inserted phones were 30% shorter than the average phones. The averages
were calculated over 718 Harvard sentences for SR. If the average phone length was shorter than 20msec, the inserted phone was not reduced.
MARK
The phonetic transcripts of the MARK condition were processed by S2 to produce transcription files with 20% substitution and deletion errors. The *.lgp files were processed by a the mark version of the State program to mark half the errors (10% of the total phones). The same number (10% of the total) of correct phones were marked as well. The marked phones were chosen randomly and received red box outlines around their handshapes to indicate to the subject that they might be wrong.
REAL
The acoustic signal of the sentences in this condition were processed directly by Paul Duchnowski using a continuous Hidden Markov Model phonetic speech recognizer [19, 20] implemented using the Entropic HTK software [21, 9]. 25 features were extracted every l0msec from the acoustic signal (12 mel-frequency cepstral coefficients, 12 delta coefficients and one measure of normalized energy, all taken from a 20msec frame). The features were divided into a static vector and a dynamic vector (The two vectors were assumed to be statistically independent). The distribution of each feature vector was modeled with a mixture of six Gaussians. The recognizer was trained using 960 sentences (a mixture of CID, Clarke and Harvard) spoken by SR, from which 1151 right-context dependent phone models were derived. The models were three state, no skip HMMs, with the first state tied across contexts. A simple bigram language model and a Viterbi search were used to carry out the recognition. The recognition accuracy was 79.11%. 180 test sentences were processed. The output of the speech recognizer was converted by hand to phonetic transcription form and processed by the State to yield playlists.
2.5 Procedure
Four lists (40 sentences) of Harvard sentences were used in testing each condition. A combination of 20 CID and Clarke sentences were used in training each condition, except as noted for conditions SA, MCS and PSC. No sentence was presented more
than once to a single subject in either phase.
The subjects were seated inside a sound-treated booth, except for S4 who was tested at home. The subjects were tested in separate booths or at separate times
(except S2 and S6 in Phase II, who were tested together). The subjects attended to a video monitor, which was roughly four feet away. The laserdisc player (VCR for S4) was paused after each sentence presentation to allow the subjects time to write their responses on a sheet of paper. The pause button was under the control of a tester(s) who waited until the subjects were ready before continuing. During training, the tester(s) repeated the correct response to the subjects and showed them the written answer if they did not understand. All sentences were scored at a later time.
2.5.1 Phase I
Testing was done over two days for each subject. Frequent breaks were taken, usu-ally after the completion of 60 test sentences. Conditions SA, MCS and PSC were presented first to attain baseline scores. Training on these three conditions was con-secutive (with ten training sentences for SA and MCS, and 30 for PSC), followed by 20 testing sentences of each in the same order.
Each condition involving errors and delays (SD1, SD2, D1, D3, and D5) was broken into two blocks consisting of ten training sentences and two testing lists (20 sentences). It was assumed that some learning would occur over the course of testing. To keep the affect of learning to a minimum, all conditions were presented once before repeating conditions. In addition, the order in which the blocks were presented was randomized to help eliminate learning affects. The presentation order remained the same for all subjects.
Finally, two lists of the SA condition followed by two lists of the MCS condition were presented at the end (without training) to obtain a post-testing baseline score.
2.5.2 Phase II
Phase II testing was conducted approximately two months after Phase I (see Tables C.3 and C.4). Testing again was done over two days and frequent breaks were pro-vided. Each condition was broken into two blocks consisting of ten training sentences and two testing lists. One block of each condition SA, MCS and PSC was presented at the beginning of testing and the other at the end. Training was only provided at
the beginning for conditions SA, MCS and PSC (10 sentences for SA, 10 for MCS and
20 for PSC). The order or presentation for those three conditions was randomized. The blocks of the remaining conditions (RDO, RD1, RD2, INS, MARK, and REAL) were presented randomly. As in Phase I, all conditions were presented once before any condition was repeated and the order was kept the same for all subjects.
Chapter 3
Results
3.1 Data Analysis
3.1.1
Scoring
The Harvard test sentences were scored for accuracy on five key words per sentence.
For each subject, list scores (10 sentences, 50 key words) were compiled as well as an
average across lists for each condition. The CID training sentences were also scored
for accuracy on 2-10 key words per sentence, for a total of 50 key words per list (10
sentences). The Clarke training sentences were scored for accuracy on every word in the sentence since no scoring standard exists. Sentence lengths for the Clarke sentences ranged from 5-10 words.
3.1.2 Statistical Analysis
An analysis of variance (ANOVA) method [22, 23, 24] was applied to the test results (Harvard sentences only) to determine which factors played a statistically significant
role in the observed differences in scores, as well as which factors, if any, were
statis-tically related. The analysis was conducted on each phase separately. It was assumed that there were no differences among lists. The two factors involved in the ANOVA were conditions and subjects. The conditions factor was assumed to be a fixed effect because the set of conditions chosen were the only ones of concern. The subject factor
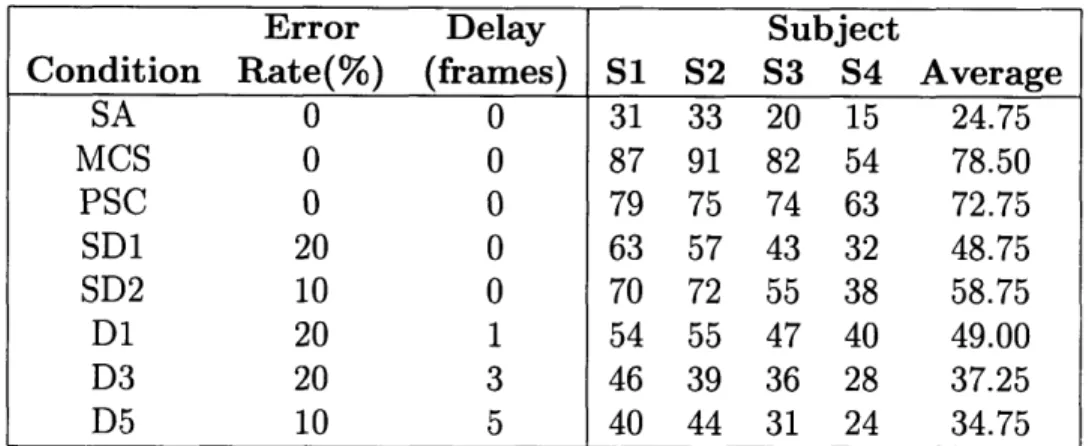
Table 3.1: Average test scores for subjects in Phase I.
Error Delay Subject
Condition Rate(%) (frames) SI S2 S3 S4 Average
SA 0 0 31 33 20 15 24.75 MCS 0 0 87 91 82 54 78.50 PSC 0 0 79 75 74 63 72.75 SD1 20 0 63 57 43 32 48.75 SD2 10 0 70 72 55 38 58.75 D1 20 1 54 55 47 40 49.00 D3 20 3 46 39 36 28 37.25 D5 10 5 40 44 31 24 34.75
Scores are percentage points based on four lists (200 key words) for each condition, except for SA and MCS which are based on six lists (300 key words).
was also assumed to be a fixed effect because the subjects were not randomly chosen. The analysis was also performed assuming that the subjects factor was a random effect and the results were essentially unchanged.
An F test at the 0.01 significance level under the null hypothesis of a2= 0 for the
term under consideration was performed on: conditions, subjects, and conditions X subjects (see Appendix B for a more detailed description of the ANOVA and F test). Accord-ing to the F tests, there were significant differences in scores between conditions and significant differences between subjects, but there was no significant interaction between conditions and subjects. In other words, the observed differences between conditions were independent of subject. These results held true in both phases.
Based on the results of the F tests, paired t-tests at the two-tail 0.01 significance level were performed for all possible pairings of conditions in a single phase (see Appendix B for a more detailed description of these t-tests). The results are discussed below.
3.2
Phase I
Average scores for each condition across the four subjects in Phase I are shown in Table 3.1. The speechreading alone (SA) scores for all subjects fell below 40%. Base
100 80 a) (a 60
8
40 U) a, 0-
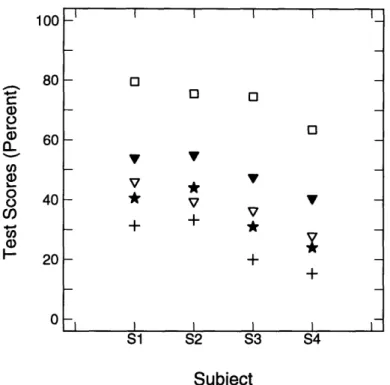
20 0 S1 S2 S3 S4 SubjectCrosses = SA; Filled Triangles = MCS; Squares = PSC; Filled Circles = SD2; Diamonds = SD1.
Figure 3-1: Error conditions of Phase I (no delay).
on Figure 1 of Uchanski et al., phoneme reception that yields 40% correct on Harvard sentences translate to almost 90% correct on everyday sentences such as the CID or Clarke sentences and is often taken as the minimal level of speech reception adequate for everyday communication [4]. Subjects scored significantly better on all conditions over speechreading alone, and scored above 40% on all conditions except D3 and D5 (see Figures 3-1 and 3-2). Manual Cued Speech (MCS) scores were significantly higher than all other conditions except perfect synthetic cues (PSC). The difference between MCS and PSC was not significant according to the t-test, even when the results for S4 (the only subject to score higher on condition PSC than MCS), were not considered. The difference between perfect synthetic cues and synthetic cues with 10% errors (SD2) was also not statistically significant. This result is encouraging because it suggests that an automatic cueing system with 10% errors could provide benefits to cue receivers almost as well as a perfect system. However, increasing the errors by 10 percentage points (SD1, 20% errors) causes a significant decrease in key word reception compared with PSC and SD2 (Figure 3-1).
I I I I I I - * O O o * A O + + O I I I I I I I I
100 80 C)
CL60
an a) 0 . 40 0 Si S2 S3 S4 SubjectCrosses = SA; Squares = PSC; Filled Inverted Triangles = D1; Inverted Triangles = D3;
Filled Stars = D5.
Figure 3-2: Delay conditions of Phase I.
The difference in scores between D1 and SD1, both containing 20% errors, is small and not statistically significant, suggesting the delay of 33msec did not bother subjects. As delay increases, test scores decrease (see Figure 3-2). This trend holds true even when the error rate is decreased to compensate for the longer delays, as in condition D5. All subjects remarked that the delay was noticeable and bothersome on condition D5, and some remarked on the delay during condition D3 as well. The difference in scores between conditions D1 and D3 (a difference of two frames) was significant, but the difference in scores between D3 and D5 (also a two frame dif-ference) was not statistically significant. It is likely that any noticeable delay has a detrimental affect on speech reception.
3.3 Phase II
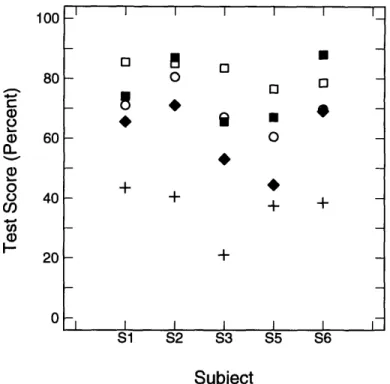
Average scores for each condition across the five subjects in Phase II are shown in Table 3.2. Most of the subjects scored at or below 40% for speechreading alone. Scores
I I I I I I 0 0 V V
V
*
*
v - + I I +I I I I I I I I I I ITable 3.2: Average test scores for subjects in Phase II.
Scores are percentage points based on four lists (200 key words) for each condition.
on the other conditions were above 40% and significantly better than speechreading alone (see Figures 3-3, 3-4 and 3-5). The two-tail probability for the paired t-test between MCS and PSC in Phase II was 0.0135. This number is very close to the 0.01 significance comparison level. A similar t-test performed in Phase I yielded no significant difference between MCS and PSC. Also, a t-test performed on the average across both phases for MCS and PSC yielded a two-tail probability of 0.1358 when all subjects were included and a two-tail probability of 0.0304 when only the repeat subjects were included. Either way, MCS and PSC do not appear to be very different. This suggests that the discrete nature of the synthetic cues and the faster presentation of the synthetic cues does not have a large impact on the cue receiver.
The differences between MCS and RDO (random delay, no errors) was not signif-icant, nor was the difference between PSC and RDO (scores for all other conditions were significantly lower than MCS). This result suggests that a random one frame (33rnsec) delay and advance of the cues with no errors is not perceivable and/or not bothersome. Figure 3-3 plots the three random delay conditions in relation to SA and PSC. Some of the subjects actually did better on RDO than on PSC. PSC was presented five conditions before RDO, so it is possible that learning occurred to help boost the RDO scores. S6, the subject with the largest score differential between the two conditions, only participated in Phase II and thus probably experienced greater
Error Delay Subject
Condition Rate(%) (frames) S1 S2 S3 S5 S6 Average
SA 0 0 43 40 21 37 38 35.8 MCS 0 0 92 93 86 81 91 88.6 PSC 0 0 85 85 83 76 78 81.4 RDO 0 +/-1 74 87 65 67 88 76.2 RD1 20 +/-1 65 71 53 44 69 60.4 RD2 10 +/-1 71 80 67 60 69 69.4 MARK 20 0 61 61 48 46 61 55.4 INS 20 0 60 61 31 49 58 51.8 REAL 21 0 79 73 70 65 64 70.2
100 80 C.) a) 60 C. a, 20 0 I I I I I I I S1 S2 S3 S5 S6 Subject
Crosses = SA; Squares = PSC; Filled Squares = RDO; Filled Diamonds = RD1; Circles = RD2.
Figure 3-3: Random delay conditions of Phase II.
learning during the first half of Phase II than subjects who had seen the synthetic cues before. The difference between PSC and the other random delay conditions (RD1 and RD2) was significant. The difference between RDO and RD1 was statis-tically significant but the difference between RDO and RD2 was not. For the most part, as the error rate increased speech reception decreased.
Three conditions contained 20% errors: RD1, INS and MARK. Figure 3-4 plots them together along with SA, MCS and PSC. There was no statistical difference between any of the three conditions, although subjects tended to do better on RD1. All conditions were significantly lower than RDO, but still remained above the 40%. The only condition subjects expressed a dislike for was the MARK condition in which red boxes appeared around the hand signaling to the subject that the cue may be in error. Most subjects found the box distracting and tended to ignore it rather than use it to their advantage. However, S3 tried to concentrate more on the lips and less on the cues when the red boxes appeared.
The REAL condition was one of the most important tests conducted in Phase II
_ o
0I I+ +
+
100 80 ) 60 0 8 40 ci) 0 20 S1 S2 S3 S5 S6 Subject
Crosses = SA; Filled Triangles = MCS; Squares = PSC; Stars = INS; Filled Crosses = MARK; Filled Diamonds = RD1.
Figure 3-4: Conditions containing 20% errors in Phase II.
because it showed how well subjects performed using output from the actual speech recognizer. Although differences were not statistically significant, most subjects per-formed slightly better on the REAL condition than on RD1 and RD2. Condition INS was most similar to REAL because it was the only other condition containing inser-tions. The deletion rate for the INS condition was 2.2%, and the random insertion rate was 8.6%. The REAL condition had a higher deletion rate of 4% but a lower insertion rate of 6%. Figure 3-5 plots conditions REAL and INS, along with SA and PSC. Subjects scored significantly higher on the real recognizer output than on the INS condition. The insertions produced by the ASR were not random like those in condition INS, which may account for the difference in scores.
3.4 Comparisons across Phases
Three subjects (S1, S2, and S3) participated in both phases of the study. There were also three conditions (SA, MCS and PSC) repeated in both phases. The three
I I I I I I I_ [o o A0 0 O * *
+
+ + I I I I I I I _ . _ _ _ _ _100 80 a) 0 a) 60 () I-a) 20 0 S1 S2 S3 S5 S6 Subject
Crosses = SA; Squares = PSC; Triangles = REAL; Stars = INS; Circles = RD2.
Figure 3-5: REAL condition compared with INS and RD2.
subjects scored significantly higher on most of these conditions in Phase II than in Phase I suggesting that some amount of learning occurred over the course of the study (see Table 3.3). On average, SA scores went up by six percentage points and the MCS-PSC difference dropped from 11 percentage points to six percentage points. Condition RD1 of Phase II compared with SD1 of Phase I, both with 20% errors, provides additional evidence that learning occurred. Although RD1 contained random delay (the only difference between the two conditions), scores were higher than SD1 for all subjects (see Figure 3-6).
Table 3.3: Conditions SA, MCS and PSC across both Phases.
Scores are percentage points based on four lists, except for SA and MCS in Phase I which are based on six lists.
-A 0 O 0
-
* * *I *
+ * + + + + I I I I 1 I I S1 S2 S3Condition Phase I Phase II Phase I Phase II Phase I Phase II
SA 31 43 33 40 20 21
MCS 87 92 91 93 82 86
PSC 79 85 75 85 74 83
100 80 --a) (9 60 I.-cn a) 0 - 20 0 S1 S2 S3 Subject
Diamonds = SD1; Stars = INS; Filled Diamonds = RD1.
Figure 3-6: Comparison of error conditions across phases.
Figure 3-7 plots one delay condition, D1, from Phase I and two delay conditions, RD1 and RD2, from Phase II. D1 contained 20% errors with a one frame delay, while RD1 and RD2 contained a random one frame delay and advance with 20% and 10% errors, respectively. Scores for RD1 were higher than for D1, suggesting that learning occurred to boost RD1 scores. It is also possible that the random delay and advance was less noticeable than constant delay.
Condition SD1 of Phase I and the INS condition of Phase II were similar because both had error rates of 20% and no delays. However, INS contained a quarter of the deletions of SD1, with the difference made up by insertions. The tradeoff between deletions and insertions only seemed to affect S3 suggesting that insertions are neither better nor worse than deletions (see Figure 3-6).
3.5 Phone Error Rates vs Key Word Error Rates
Although the phone error rates were nominally set at 10% (in conditions SD2, D5 and RD2) and 20% (in conditions SD1, D1, D5, RD1, MARK, and INS), the corresponding
O
100 80 -' a, (D a) 60 Q. 8 40 Cn03 S1 S2 S3 Subject
Circles = RD2; Filled Diamonds = RD1; Filled Inverted Triangles = D1.
Figure 3-7: Comparison of delay conditions across phases.
error rates for key words were much higher. Table 3.4 lists the actual phone error rate (Ph) and the corresponding key word error rate (KW) for each subject in both phases. The phone error rate is the percentage of phones that were incorrect out of the total number of phones for a given condition, not just those contained in key words. The phone error rates included deletions and insertions, where applicable, with deletions making up about half the errors (However, the INS condition error rate was an average of 30%, with a third of those errors being deletions and insertions.). The key word error rate is the percentage of key words that contained at least one phone error out of 200 key words for a given condition. A key word was counted as an error if one or more of its phones was an error. All key words contained a minimum of three phones, which resulted in key word error rates being three to four times greater
than the phone error rates (except for the REAL conditions). In addition, 95% of the phone errors caused cueing errors (incorrect hand shape or vowel position).
Incorrect key words were not always missed by subjects even though they con-tained phone errors. Although results varied from subject to subject and condition
0O
V O
·
I I
1V
I I I I I
Table 3.4: Phone Error Rate and Key Word Error Rate. Phase I S1 S2 S3 S4
Condition Ph KW Ph KW Ph KW Ph KW
SD1 22 63 23 61 22 65 24 66 SD2 11 33 11 40 12 39 12 41 D1 23 67 24 63 23 58 24 65 D3 21 55 24 61 25 66 24 67 D5 11 40 12 36 11 37 12 42Phase II
S1 S2 & S6 S3 S5Condition Ph KW Ph K
Ph Kh
KW Ph KW
RD1 23 63 23 63 24 63 23 61 RD2 11 31 12 40 13 40 12 35 MARK 28 64 27 62 26 66 27 63 INS 29 68 30 76 30 75 31 77 REAL 19 34 21 38 20 39 23 36Ph = Phone Error Rate; KW = Key Word Error Rate.
to condition, the percent of key words containing errors that subjects got correct was often above 50% for all conditions except D3 and D5 (see Table 3.5). The percent of key words containing errors that subjects got correct on those conditions was much lower, probably due to delay more than to errors. There are no clear trends in the results, but subjects tended to identify correctly a greater percentage of key words containing errors on conditions with lower overall error rates, such as SD2 and RD2 (Figures 3-8 and 3-9). In Phase II, the MARK condition had the lowest percentage of key words containing errors identified correctly which is consistent with Figure 3-4 and the distracting nature of the red boxes around the cues.
The existence of erroneous phones tended to influence the identification of words that did not contain phone errors (Table 3.6). For the most part, the percentage of key words containing no errors that subjects got correct increased as error rate decreased (Figures 3-8 and 3-9). Subjects' abilities to correctly identify error-free key words may have been affected by errors occurring in other key words as well as errors in surrounding function words (e.g. with, at, the etc.). The MARK condition did
Table 3.5: Percent of key words containing errors correctly identified. Phase I Subject SD1 SD2 D1 D3 D5 S1 60 66 52 34 43 S2 53 60 51 31 37 S3 38 47 44 34 24 S4 24 32 34 19 26 Average 43.75 51.25 45.25 29.50 32.50
Phase II
Subject RD1 RD2 MARK INS REAL
S1 61 60 58 44 68 S2 64 72 53 58 62 S3 39 59 43 61 61 S5 39 60 35 47 53 S6 66 63 52 56 47 Average 53.8 62.8 48.2 53.2 58.2
Percents calculated by dividing the number of key words with errors that were correct by the total number of key words with errors.
Table 3.6: Percent of key words containing no errors correctly identified.
Phase I Subject PSC SD1 SD2 D1 D3 D5 S1 79 68 73 57 61 38 S2 75 66 80 62 50 48 S3 74 53 61 52 41 35 S4 63 48 43 52 47 23 Average 73.25 58.75 64.25 55.75 49.75 36.00
Phase II
Subject PSC RDO RD1 RD2 MARK INS REAL
S1 85 74 73 76 68 82 79 S2 85 87 82 85 76 71 81 S3 83 65 77 72 59 56 78 S5 76 67 53 61 63 72 73 S6 78 88 78 73 76 67 75 Average 81.8 76.3 72.6 73.4 68.4 69.6 77.2
Percents calculated by dividing the number of key words with no errors that were correct by the total number of key words with no errors.
I I I I I I I 100 80 60 a) a) m. 40 20 0 PSC SD1 SD2 D1 D3 D5 Condition
Filled Circles: Average percentages for (correct key words/error-free key words); Open Circles: Average percentages for (correct key words/erroneous key words).
Figure 3-8: Phase I.
not have lower percentages than the other 20% error conditions, suggesting that the appearance of the red boxes did not affect the reception of error-free key words any more than the other conditions.
3.6 Comparison to Autocuer Study
It is difficult to compare the results presented here directly with those of the Autocuer study because the speech materials used for testing were vastly different (sentences verse isolated words). However, condition SD1 of Phase I is almost identical to conditions five and six of the Autocuer study because they both contain substitution and deletion type errors at a rate of 20%. Condition SD1 contained approximately
10% deletion and 10% substitution errors, while the Autocuer conditions contained 9% deletion and 11% substitution errors in condition five and 14% deletion and 6%
substitution errors in condition six. Average scores on condition SD1 were 49% correct
on the Harvard sentences, 80% on the Clarke sentences and 86% correct on the CID
0 O 0 0
o 0
I I I I I I I I 100 80 CD 60 a) CL 40 20 0
PSC RDO RD1 RD2 MAR INS REA
Condition
Filled Circles: Average percentages for (correct key words/error-free key words); Open Circles: Average percentages for (correct key words/erroneous key words).
Figure 3-9: Phase II.
sentences1. Average scores for the Autocuer study were 77% correct on condition five and 82% correct on condition six. Subjects in the Autocuer study did better on condition six with the higher deletion rate and lower insertion rate, suggesting that substitution errors have more effect on Cued Speech reception than deletion errors. The tradeoff between substitution and deletion errors was not explored in this study. On the everyday, conversational Clarke and CID sentences, subjects in Phase I scored the same or better than the Autocuer subjects on isolated words probably because of the highly contextual nature of the sentences. On the more difficult Harvard sentences, subjects scored far below the results seen in the Autocuer study. It is reasonable to assume that the isolated words in the Autocuer study were highly predictable since they came from a closed set of words and the average score for the words was close to scores seen on the highly predictable CID and Clarke sentences. Since 49% correct on the Harvard sentences translates to more than 90% correct on
1The Clarke and CID average are only over subjects S1-S3 because S4 did not write down responses for the training sentences.
* 0 0 o 0 0 O I I I I I I I I I I I I M.
highly predictable words and sentences, subjects in this study performed better than subjects in the Autocuer study.