HAL Id: hal-00298006
https://hal.archives-ouvertes.fr/hal-00298006
Submitted on 16 May 2008HAL is a multi-disciplinary open access
archive for the deposit and dissemination of sci-entific research documents, whether they are pub-lished or not. The documents may come from teaching and research institutions in France or abroad, or from public or private research centers.
L’archive ouverte pluridisciplinaire HAL, est destinée au dépôt et à la diffusion de documents scientifiques de niveau recherche, publiés ou non, émanant des établissements d’enseignement et de recherche français ou étrangers, des laboratoires publics ou privés.
Meeting the challenge of mapping peatlands with
remotely sensed data
O. N. Krankina, D. Pflugmacher, M. Friedl, W. B. Cohen, P. Nelson, A.
Baccini
To cite this version:
O. N. Krankina, D. Pflugmacher, M. Friedl, W. B. Cohen, P. Nelson, et al.. Meeting the challenge of mapping peatlands with remotely sensed data. Biogeosciences Discussions, European Geosciences Union, 2008, 5 (3), pp.2075-2101. �hal-00298006�
BGD
5, 2075–2101, 2008 Mapping peatlands O. N. Krankina et al. Title Page Abstract Introduction Conclusions References Tables Figures ◭ ◮ ◭ ◮ Back CloseFull Screen / Esc
Printer-friendly Version Interactive Discussion Biogeosciences Discuss., 5, 2075–2101, 2008
www.biogeosciences-discuss.net/5/2075/2008/ © Author(s) 2008. This work is distributed under the Creative Commons Attribution 3.0 License.
Biogeosciences Discussions
Biogeosciences Discussions is the access reviewed discussion forum of Biogeosciences
Meeting the challenge of mapping
peatlands with remotely sensed data
O. N. Krankina1, D. Pflugmacher1, M. Friedl2, W. B. Cohen3, P. Nelson1, and A. Baccini2
1
Oregon State University, Department of Forest Science, 321 Richardson Hall, Corvallis, OR 97331, USA
2
Boston University, Department of Geography and Environment, 675 Commonwealth Ave., 4th Floor, Boston, MA 02215, USA
3
Forestry Sciences Laboratory, Pacific Northwest Research Station, USDA Forest Service, 3200 SW Jefferson Way, Corvallis, OR 97331, USA
Received: 4 March 2008 – Accepted: 2 April 2008 – Published: 16 May 2008 Correspondence to: O. N. Krankina ([email protected])
BGD
5, 2075–2101, 2008 Mapping peatlands O. N. Krankina et al. Title Page Abstract Introduction Conclusions References Tables Figures ◭ ◮ ◭ ◮ Back CloseFull Screen / Esc
Printer-friendly Version Interactive Discussion
Abstract
Boreal peatlands play a major role in carbon and water cycling and other global en-vironmental processes but understanding this role is constrained by inconsistent rep-resentation of peatlands on, or omission from, many global land cover maps. The comparison of several widely used global and continental-scale databases on
peat-5
land distribution with a detailed map for the St. Petersburg region of Russia showed significant under-reporting of peatland area, or even total omission. Analysis of the spatial agreement and disagreement with the detailed regional map indicated that the error of comission (overestimation) was significantly lower than the error of omission (underestimation) which means, that overall, peatlands were correctly classified as
10
such in coarse resolution datasets but a large proportion (74–99%) was overlooked. The coarse map resolution alone caused significant omission of peatlands in the study region. In comparison to categorical maps, continuous field mapping approach uti-lizing MODIS sensor data showed potential for a greatly improved representation of peatlands on coarse resolution maps. Analysis of spectral signatures of peatlands with
15
different types of surface vegetation suggested that improved mapping of boreal peat-lands on categorical maps is feasible. The lower reflectance of treeless peatpeat-lands in the near- and shortwave-infrared parts of the electromagnetic spectrum is consistent with the spectral signature of sphagnum mosses. However, when trees are present, the canopy architecture appears to be more important in defining the overall spectral
20
reflectance of peatlands. A research focus on developing remote sensing methods for boreal peatlands is needed for adequate characterization of their global distribution.
1 Introduction
The lack of globally consistent mapping of peatlands is a major source of uncertainty in assessing their current role in the global carbon and water cycle and projecting its
25
BGD
5, 2075–2101, 2008 Mapping peatlands O. N. Krankina et al. Title Page Abstract Introduction Conclusions References Tables Figures ◭ ◮ ◭ ◮ Back CloseFull Screen / Esc
Printer-friendly Version Interactive Discussion recognized, and there is a large body of research improving our understanding of
pro-cesses and controls on CO2 and CH4 exchange (e.g. Frolking et al., 2006; Denman et al., 2007), there has been little progress in reducing uncertainty in the area, dis-tribution, and carbon stores in peatlands. In fact, most publications addressing the potentially critical role of boreal peatlands in greenhouse gas emissions continue to
5
reference Gorham (1991) and his estimate of carbon store in peatlands at 180-455 PgC or about 1/3 of the global soil carbon pool (e.g., Smith et al., 2004). A recent assessment revised the estimate of the total carbon pool in peatlands to 462 PgC and their total area to 344 million ha while pointing out the inadequacy of data for many parts of the world (Brigham et al., 2007), including permafrost regions (Sheng et al.,
10
2004). Furthermore, these global estimates are compilations of regional datasets that use different classifications making their integration problematic. The development of globally consistent spatial data on distribution of peatlands is necessary for effective inclusion of peatlands into global biogeochemical models.
Northern peatlands are widely reported to experience the effects of climate change
15
leading to changes in hydrology, vegetation cover, export of dissolved organic carbon, respiration and methane production (e.g., Sturm et al., 2001; McGuire et al., 2002; Pastor et al., 2003; Roulet, 2000). A strong positive feedback to global warming is expected in boreal permafrost peatlands where the evidence of permafrost melting is widely recognized (see review in Anisimov et al., 2007) and associated successional
20
patterns of vegetation are well established (i.e. lake formation and draining, character-istic shifts in plant species composition). However, global assessment of these patterns is lacking.
Mapping peatlands as a distinct type of land cover is challenging, which has lead to their omission from many global vegetation maps and inconsistent representation on
25
others (Frey and Smith, 2007). Global assessments that are focused on hydrological characteristics (e.g., Matthews, 1989; Prigent et al., 2007) tend to represent peatlands inadequately in the boreal zone where a significant portion of peatlands does not ex-perience prolonged inundation. Several studies report successful mapping of wetlands
BGD
5, 2075–2101, 2008 Mapping peatlands O. N. Krankina et al. Title Page Abstract Introduction Conclusions References Tables Figures ◭ ◮ ◭ ◮ Back CloseFull Screen / Esc
Printer-friendly Version Interactive Discussion with a combination of radar and optical sensors (Li and Chen, 2005; Rosenqvist et
al., 2007). However, the lack of surface inundation during most of the growing season is an obstacle for radar-based mapping of peatlands in the boreal zone. Many global land-cover maps either emphasize inundation in their classification of wetlands (e.g., IGBP, Friedl et al., 2002) or omit them completely (e.g., UMD, Hansen et al., 2000).
5
Boreal peatlands have a distinct canopy structure that comprises open tree canopy, a shrub layer, and a continuous layer of herbaceous vegetation with significant presence of mosses. Modern classifications of land cover based on physiognomic features of surface vegetation tend to focus on dominant life forms (e.g. Land Cover Classification System (LCCS), DiGregorio, 2005) and are not well suited to defining characteristic
as-10
semblages of several life forms. While it is possible to define within the LCCS the land cover types needed to characterise boreal peatlands, the required level of detail would appear inappropriate for a global map. The global map based on LCCS classification (GLC2000) uses inundation as a defining feature of wetlands (Bartolome and Belward, 2005), but the contributing continental map for Northern Eurasia includes wetland
def-15
initions that are more appropriate for boreal peatlands: bogs and marsh, palsa bogs, and riparian vegetation (Bartalev et al., 2003). Considering the global significance of peatlands, it may be appropriate to consider modifications that would facilitate charac-terisation of peatlands within the LCCS.
In addition to difficulties in defining peatlands within the matrix of other land cover
20
types, many peatlands are likely to be omitted from 1-km resolution categorical maps simply because of their small size. An approach that could overcome this limitation of categorical maps estimates sub-pixel proportions of land cover types from remote sensing data. For example, a so called continuous field map of peatland cover was created to capture the extent and distribution of peatlands in the St. Petersburg
re-25
gion of Russia using Moderate Resolution Imaging Spectroradiometer (MODIS) NBAR data (Pflugmacher et al., 2007). Improved representation of wetlands and other eco-logically significant classes that occupy relatively small area has been recognized as an important objective for future global mapping and validation efforts (Herold et al.,
BGD
5, 2075–2101, 2008 Mapping peatlands O. N. Krankina et al. Title Page Abstract Introduction Conclusions References Tables Figures ◭ ◮ ◭ ◮ Back CloseFull Screen / Esc
Printer-friendly Version Interactive Discussion 2008).
Peatlands within the boreal forest zone are easy to identify visually on high and medium spatial resolution imagery such as Landsat TM/ETM+ (30 m) or SPOT HRV (20 m). Several studies have mapped them successfully using automated classifica-tion algorithms (Markon and Derksen, 1994; Poulin et al., 2002; Oetter et al., 2001;
5
Bronge and Naslund-Landenmark, 2002; McGovern et al., 2000; Baker et al., 2006). A study in western Siberia employed Russian RESURS-01 images with 150 m res-olution as independent validation for a historical peatland inventory map (Sheng et al., 2004). The comparison of spectral reflectance profiles of sphagnum moss and conifer trees showed that sphagnum mosses have a distinct spectral signature with
10
lower reflectance in the near-infrared (0.70–1.3 µm) and short-wave infrared (1.50– 2.5 µm) parts of the electromagnetic spectrum (Vogelman and Moss, 1993; Bubier et al., 1997). Taking advantage of this distinct signature and detailed ground mea-surements, it has proved possible to map shrub and tree LAI (leaf area index) on a peatland using multiple endmember spectral unmixing of Landsat image (Cohen et al.,
15
2003; Sonnentag et al., 2007).
This paper presents the results of a case study that compared several widely used global and continental-scale databases on peatland distribution with Landsat TM based detailed land cover map for the St. Petersburg region of Russia (Oetter et al., 2001), examined the spectral characteristics of peatlands in comparison with other common
20
vegetation types in the region and identified approaches for future improved mapping of boreal peatlands based on remotely sensed data.
2 Study region and data
2.1 Study region and detailed regional map of peatlands
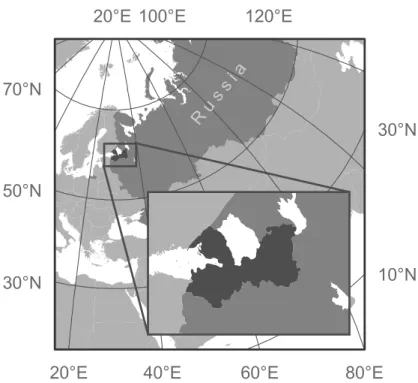
The St. Petersburg region of Russia (Fig. 1) is located on the East-European Plain
25
BGD
5, 2075–2101, 2008 Mapping peatlands O. N. Krankina et al. Title Page Abstract Introduction Conclusions References Tables Figures ◭ ◮ ◭ ◮ Back CloseFull Screen / Esc
Printer-friendly Version Interactive Discussion 62◦N and between 28◦and 36◦E, the administrative region occupies over 100 000 km2,
much of that area belongs to the Gulf of Finland of the Baltic Sea and Lake Ladoga, the largest lake in Europe. The influence of these water bodies helps create a maritime climate for the region, with cool wet summers and long cold winters. Mean temperature in July ranges from 16◦ to 18◦
C, and in January it is −7◦
to −11◦C. The landscape is
5
typically frozen from November until March, such that much of the annual precipita-tion of 600–800 mm falls as snow. The terrestrial part of study area occupies about 8 million hectares of flat terrain that rests on ancient sea sediments covered by a layer of moraine deposits. The natural vegetation belongs to the southern taiga. Fifty-three percent of the region is covered with closed canopy forest, and repeated logging is a
10
major disturbance factor, as is urban expansion and agricultural change (Krankina et al., 2004).
The dominant peatland type in the region is the “raised string bog” (Botch and Mas-ing, 1983). Raised bogs have a dome-shaped surface built up of sphagnum peat. In contrast to minerotrophic fens, raised bogs receive all their water and nutrients from
15
the atmosphere (ombrotrophic). Therefore, they tend to be acidic and low in nutrient availability. Oligotrophic bogs account for about 75% of the total peat volume in the St. Petersburg region, while transitional peat from mesotrophic peatlands and low-lying peat from fens or eutrophic peatlands comprise about 14% and 11%, respectively. In some areas peat is mined for use as fuel or soil additive. Mining removes the upper
20
layers of peat, leaving bare peat surfaces that are often converted to agricultural or forested land.
A detailed land-cover map of the St. Petersburg region of Russia (Oetter et al., 2001) was developed based on imagery from the Landsat series of satellites. The imagery selection was initially limited to 1992–1995 to match the time of the ground data
col-25
lection and was supplemented with scenes from 1986 and 1987. Overall, 12 separate Landsat Thematic Mapper (TM) images and one Multispectral Scanner (MSS) image were acquired to create the map. Geometric rectification was performed by first select-ing a map-registered base image (path 182, row 18 for 19 May 1992) that provided the
BGD
5, 2075–2101, 2008 Mapping peatlands O. N. Krankina et al. Title Page Abstract Introduction Conclusions References Tables Figures ◭ ◮ ◭ ◮ Back CloseFull Screen / Esc
Printer-friendly Version Interactive Discussion geographic reference to which other images were geometrically corrected. Each of the
14 Landsat images was clipped to the St. Petersburg region boundary and subjected to multiple iterations of unsupervised classification, to construct a map with eight land cover classes (Agriculture, Bog, Built/Urban, Cloud, Forest, Shadow, Shrub/grass, and Water). In addition, expert judgment of the raw imagery and a hand-drawn map of
5
bogs (Botch, 19951) was used for visual reference. Bogs that had visual indications of human manipulation (draining and peat mining) were manually recoded to a separate class. The overall accuracy of this map was assessed to be 88%. The map is available onlinehttp://www.fsl.orst.edu/larse/russia/.
2.2 Ground data
10
Ground information for peatlands and other vegetation types was derived from for-est inventory data and maps from 1992–1993. These maps were based on detailed topographic maps and aerial photographs (Kukuev et al., 1997) and were available as digital vector data with polygons ranging in size from 2.5 to 305 ha. Reference polygons included peatlands and vegetation on mineral soils with similar dominant life
15
forms. Peatlands are classified by forest inventory as bogs and mires when they have less than 40% tree cover. The percent cover by woody vegetation and the dominant species (primarily Pinus sylvestris L.) was recorded for each polygon. Polygons were grouped into classes depending on presence of tree and shrub cover in line with LCCS (DiGregorio, 2005). The following classes were examined:
20
– Herbaceous-wet (62 polygons) had less than 15% tree cover. While low shrubs
(Vaccinium spp.) are often present, the extent of low shrub cover could not be extracted from available data.
– Herbaceous (25 polygons) were classified by forest inventory as pastures, hay
lots, meadows, or glades. Because this class was poorly represented in available
25
1
Botch, M.: Schematic map of peatland utilization in Leningrad region, Map on file at the Department of Forest Science, Oregon State University, unpublished, 1995.
BGD
5, 2075–2101, 2008 Mapping peatlands O. N. Krankina et al. Title Page Abstract Introduction Conclusions References Tables Figures ◭ ◮ ◭ ◮ Back CloseFull Screen / Esc
Printer-friendly Version Interactive Discussion forest inventory dataset (9 polygons total), 16 additional polygons were
hand-digitized using expert judgement and high-resolution imagery (Quickbird) for vi-sual reference.
– Trees-open (22 polygons) – had tree cover between 15 and 65%. Most of these
polygons were subject to recent thinning which opened tree canopies.
5
– Trees-open-wet (46 polygons) – were classified by forest inventory as bogs or
mires if the tree cover was between 15 and 40% or as forest with sphagnum mosses dominating the ground cover and stocking density indicating 50–65% canopy cover.
– Trees closed (1528 polygons) – had tree cover greater than 65% and ground
10
cover other than sphagnum mosses.
– Tree-closed-wet (586 polygons) – had tree cover greater than 65% and ground
cover dominated by sphagnum mosses.
3 Cross-comparison of coarse resolution maps and datasets
Information relevant to understanding the global distribution of peatlands and wetlands
15
can be obtained from multiple sources and only some of them are suitable for a mean-ingful comparison with a detailed regional map of peatlands. For example, Global Distribution of Wetlands (Matthews and Fung, 1987) is a global data base of wetlands at 1◦ resolution and it has been developed from the integration of three independent
global digital sources: (1) vegetation, (2) soil properties and (3) fractional inundation in
20
each 1◦cell. The integration of these data yielded a global distribution of wetland sites,
but the aggregation to 1◦latitude/longitude was too coarse for a meaningful comparison
because only eight 1◦cells fit fully within the territory of our study region. We selected
BGD
5, 2075–2101, 2008 Mapping peatlands O. N. Krankina et al. Title Page Abstract Introduction Conclusions References Tables Figures ◭ ◮ ◭ ◮ Back CloseFull Screen / Esc
Printer-friendly Version Interactive Discussion and wetlands for comparison with the detailed map of peatlands in the St. Petersburg
region:
- Global Land Cover (GLC) 2000 map for Northern Eurasia v. 4 (http://www-gvm.jrc.
it/glc2000/productGLC2000.htm, Bartalev et al., 2003) was produced using 14 months of pre-processed daily global data acquired by the VEGETATION instrument on board
5
the SPOT 4 satellite between 1 November 1999–31 December 2000. The map has 1-km nominal resolution and uses a legend based on LCCS (DiGregorio, 2005). Among the mapped vegetation types, three were relevant to this study: bogs and marsh, palsa bogs, and riparian vegetation.
– MODIS Land Cover IGBP 2001 database (MOD12Q1, V004) was developed
10
by the Boston University Department of Geography and Center for Remote Sens-ing (http://geography.bu.edu/landcover/) based on MODIS satellite data acquired from 1/1/01 to 12/31/01 (Friedl et al., 2002;http://duckwater.bu.edu/lc/mod12q1.html). The product has a 1-km nominal spatial resolution, and was produced using a supervised classification approach and training sites across the globe. It is available with five
leg-15
ends, but only the IGBP legend includes a class that is relevant to defining peatlands – “permanent wetlands”.
– Global Lakes and Wetlands Database (GLWD, Lehner and Doll, 2004; http:
//www.wwfus.org/science/data.cfm/) is a global database compiled from several ex-isting maps and databases including the USGS Global Land Cover Characteristics
20
Database (GLCC-.AVHRR, Loveland et al., 2000) described below. Level 3 of this database represents the maximum extent of wetlands and is intended by its authors to serve as an estimate of wetland extents for global hydrology and climatology models, or to identify large-scale wetland distributions and important wetland complexes.
Several additional datasets were reviewed including GLCC-AVHRR database based
25
on AVHRR data acquired from April 1992 through March 1993 (Loveland et al., 2000;
http://edcsns17.cr.usgs.gov/glcc/). It has a 1-km nominal spatial resolution and was used to produce a core set of derived thematic maps including a map for Eurasia based on IGBP legend. Since GLCC-AVHRR database (Loveland et al., 2000) was
BGD
5, 2075–2101, 2008 Mapping peatlands O. N. Krankina et al. Title Page Abstract Introduction Conclusions References Tables Figures ◭ ◮ ◭ ◮ Back CloseFull Screen / Esc
Printer-friendly Version Interactive Discussion incorporated in GLWD and did not show any wetlands at all on the territory of the St.
Petersburg region we opted to use only GLWD.
In addition to global and continental datasets, we also included in comparison a regional BALANS land cover map (Malmberg, 2001; http://www.grida.no/baltic/htmls/
arcinfo.htm). The dataset has been developed from IRS 1C/1D WiFS data with scenes
5
from 1997 up to 2000 for the Baltic Sea basin and ancillary GIS data. The pixel size is 150×150 metres.
Finally, we used a MODIS-based map of percent peatland cover in 1 km2 pixels for the St. Petersburg region (Pflugmacher et al., 2007). The map was produced by a study that tested the capability of the MODIS sensor to map peatlands within a
10
taiga landscape of the East-European Plain. The map represents sub-pixel proportion of peatland cover derived from reference maps and ∼1-km resolution MODIS Nadir BRDF-Adjusted Reflectance (NBAR) data from 26 May–9 June 2002. The map pre-dicts unmined and mined peatland cover with a root-mean-squared error of 16% and 9%, respectively.
15
A mosaic of the MODIS-IGBP map for Eurasia was downloaded in Lambert Az-imuthal Equal-area (LAEA) projection with a 930-m spatial resolution. The GLC2000 and GLWD maps were available in Plate Carr ´ee projection. Since the Plate Carr ´ee ref-erence system is not an equal area projection (i.e. raster cells vary in area), we repro-jected GLC2000 and GLWD into LAEA, the reference system of the MODIS-IGBP map.
20
The MODIS-based peatland map by Pflugmacher et al. (2007) was kept in its original Sinusoidal projection, which is also an equal area projection (Snyder, 1987). To com-pare the detailed Landsat-based land cover map with the coarse resolution maps, the Landsat-based map was then reprojected into the coordinate space of the coarse res-olution map (e.g. Sinusoidal for MODIS-based peatland map and LAEA for the others).
25
To match the coarse resolution pixels the Landsat-based map was nearest-neighbor resampled to 30 m. Prior to analysis the correct geolocation of all maps in comparison to the Landsat-based reference map was visually assessed. We found the geolocation error of the BALANS map in some areas to be greater than 10-km. Hence, we
georec-BGD
5, 2075–2101, 2008 Mapping peatlands O. N. Krankina et al. Title Page Abstract Introduction Conclusions References Tables Figures ◭ ◮ ◭ ◮ Back CloseFull Screen / Esc
Printer-friendly Version Interactive Discussion tified the BALANS map using 37 ground control points and a second-order polynomial
transformation (RMSE=74.6 m, half the BALANS spatial resolution).
To evaluate the performance of the coarse resolution data sets for mapping extent and distribution of peatlands in the St. Petersburg region we
(a) calculated and compared the areal extent of peatlands in the region by combining
5
all relevant land cover classes on each map and
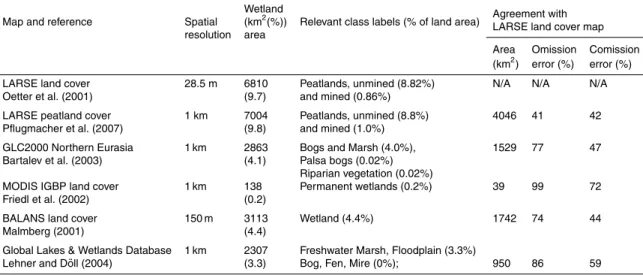
(b) analyzed the spatial agreement of the mapped peatland area with the Landsat-based reference map (Table 1, Fig. 2).
Spatial agreement of thematic maps is commonly assessed using a classification error matrix, which is a cross-tabulation of mapped class labels against the class labels of a
10
reference data set (e.g. numbers of pixels that are labeled x in map A while being la-beled y in map B). Comparing two maps on a pixel-by-pixel and category-by-category basis, however, requires that both maps have the same spatial resolution. As a conse-quence when maps with differing spatial resolutions are compared, the map with the higher spatial resolution is sometimes spatially aggregated to the coarser resolution by
15
assigning the dominant class to the aggregated pixel (Turner et al., 2000). The disad-vantage of this approach is that it assumes some level of homogeneity in the landscape since sub-dominant classes are basically omitted from the comparison. Alternatively, the sub-fractional error matrix compares the areal overlap of two categories (Latifovic and Olthof, 2004) and therefore preserves distributional information of all reference
20
classes. Based on the areal agreement and disagreement between the two maps, percent of omission and commission are then calculated. In our case, omission is the percent of peatland area in the Landsat-resolution map that was not mapped as peat-land (omitted) in the coarse resolution data set. Similarly, comission is the percent of peatland area mapped in a coarse resolution data set that was not mapped as peatland
25
by the Landsat-based map. For example, a comission of 40% means that on average coarse resolution peatland pixels contain 40% of land cover other than peatlands and 60% of peatland cover. This method is applicable both to categorical land cover maps
BGD
5, 2075–2101, 2008 Mapping peatlands O. N. Krankina et al. Title Page Abstract Introduction Conclusions References Tables Figures ◭ ◮ ◭ ◮ Back CloseFull Screen / Esc
Printer-friendly Version Interactive Discussion (that represent peatlands along with other land cover types) and continuous maps
(per-cent peatland cover). Areas in the Landsat-resolution reference data set that were not mapped (e.g. due to clouds) were excluded from the analysis such that only coarse resolution cells with 99% and more cloud-free reference data were analyzed.
According to the Landsat-based land cover map, peatlands cover about 10% of the
5
land area in the St. Petersburg region (Oetter et al., 2001). The same percentage was estimated from the MODIS-based peatland map (Pflugmacher et al., 2007). The agreement between the fractional cover map from Pflugmacher et al. (2007) and the higher resolution map is reasonably good (omission=41%, comission 42%, see Ta-ble 1). Furthermore, the spatial patterns of the two maps are similar (Figs. 2a and 2b.).
10
In comparison, the broader regional, continental, and global coarse resolution maps all greatly underestimated peatland cover for the St. Petersburg region. The GLC2000 for Northern Eurasia and BALANS maps (Figs. 2c and 2e) failed to identify 77% and 74% of peatland cover, respectively, when compared to the Landsat-based reference map. According to GLC2000 and BALANS, peatlands account for only 4% of the land area
15
in the study region, which is less than half of our estimate supported by other regional studies (e.g. Kobak et al., 1998). Nevertheless, the comission error of the two maps is similar to the peatland map from Pflugmacher et al. (2007), which means, that over-all, peatlands were correctly classified as such but a large proportion was overlooked (omission error). Interestingly, GLC2000 and BALANS maps both achieved similar
20
agreement with the Landsat-based map even though the BALANS map had a higher spatial resolution (150 m compared to 1 km). Both of these maps were not focused on any particular land cover type and evidently, the lack of focus on peatlands was a more significant factor than resolution in causing the omission in mapping peatlands.
The lowest estimates of peatland area and the lowest agreement with our reference
25
map were observed for the global land cover datasets. The Global Lakes and Wetland Database (GLWD) mapped 3.3% of the study region as wetland (Fig. 2f) and missed 86% of peatland area on the reference map. In addition, all wetlands reported for the region by the GLWD were incorrectly classified as freshwater marshes and floodplains
BGD
5, 2075–2101, 2008 Mapping peatlands O. N. Krankina et al. Title Page Abstract Introduction Conclusions References Tables Figures ◭ ◮ ◭ ◮ Back CloseFull Screen / Esc
Printer-friendly Version Interactive Discussion while bogs, fens and mires were not reported at all. The MODIS-IGBP land cover
mapped 0.2% of the study area as permanent wetlands (Fig. 2d) and omitted 99% of peatlands on the Landsat-based reference map.
Both coarse map resolution and class definitions can cause bias towards omission or comission error in representing peatlands on land cover maps. For example, if we
5
counted only the peatland area that occupied more than 50% of individual 1-km pixels we would only report 3469 km2 of peatlands in the St. Petersburg region (5% of land area instead of 10%). Under the majority rule, all pixels with less than 50% peatland cover should be classified as some other land cover class (e.g. the dominant class or a mosaic class) and thus half the peatland area would be omitted from the map as the
10
result of the coarse resolution. At the same time, the comission (overestimation) error can occur if for example, a 1-km pixel with 51% actual peatland cover was correctly mapped as peatland. This would overestimate peatland cover for that pixel by 49%. For the St. Petersburg region, if we account for the effect of commission as the result of a 1-km spatial resolution and assume an omission of peatlands that cover less than 50% of
15
a 1-km pixel we would report a peatland area of 4627 km2. Therefore categorical maps at 1-km resolution are prone to underestimate peatland area for our study region, even if the mapping algorithm worked perfectly.
The prevalence of omission over comission reflects the characteristic patchiness in the distribution of peatlands in the region with several very large peatlands (>1000 ha)
20
and hundreds of small ones. Because of that there is a high proportion of pixels where peatlands occupy >75% of the area thus reducing the potential for comission error and at the same time a fairly high proportion of pixels where peatlands occupy <50% and this increases potential for omission error.
Thus, coarse resolution of categorical maps can account for omission of about 50%
25
of peatlands in our study region. Furthermore, the total area of 1 km pixels where peatlands occupy >95% of each pixel is 719 km2 which is just 1/10 of the total peat-land area in the region (Table 1). For maps using the IGBP definition of wetpeat-lands as permanently inundated land, this definition appears to be the main factor limiting
repre-BGD
5, 2075–2101, 2008 Mapping peatlands O. N. Krankina et al. Title Page Abstract Introduction Conclusions References Tables Figures ◭ ◮ ◭ ◮ Back CloseFull Screen / Esc
Printer-friendly Version Interactive Discussion sentation of peatlands as boreal peatlands are not inundated for most of the vegetation
season. In an extreme case, no peatlands were mapped for the St. Petersburg region on GLCC-AVHRR database using the IGBP classification (Loveland et al., 2000). A more regionally appropriate class definition of wetlands on GLC2000 map for Northern Eurasia (bogs and mires with no inundation requirement; Bartalev et al., 2003) resulted
5
in a significantly improved representation of peatlands with the level of omission consis-tent with map resolution. Continuous field modeling used by Pflugmacher et al. (2007) has the potential for a more complete representation of peatlands and other land cover types that occur in small patches. High level of disagreement among land cover maps in regions with significant presence of boreal peatlands (Herold et al., 2008) highlights
10
the challenge of adequate characterization of the global distribution of peatlands.
4 Spectral reflectance signatures of peatlands from Landsat imagery
We examined the spectral characteristics of our ground polygons over a spring, sum-mer and autumn season using reflectance data from Landsat TM (19 May 1994) and ETM+ (2 October 2000; 2 June 2002; WRS-2 path 184, row 18). The three
Land-15
sat scenes were acquired at level 1G processing with a 28.5-m spatial resolution and UTM projection (zone 36N, WGS84). We used an automated tie-point program from Kennedy and Cohen (2003) to geometrically rectify all images to an orthorectified Landsat scene with an RMSE less than 15 m. The TM image was converted first to at-satellite radiance using parameters from Chander and Markham (2003) and then to
20
surface reflectance using the COST radiometric correction model (Chavez Jr., 1996). The two ETM+ scenes were then radiometrically normalized to the atmospherically corrected TM image using the multiple alteration detection calibration algorithm from Canty (2004). Finally, the six reflectance bands of each image were transformed into Tasseled Cap indices of brightness, greenness, and wetness (Crist, 1985).
25
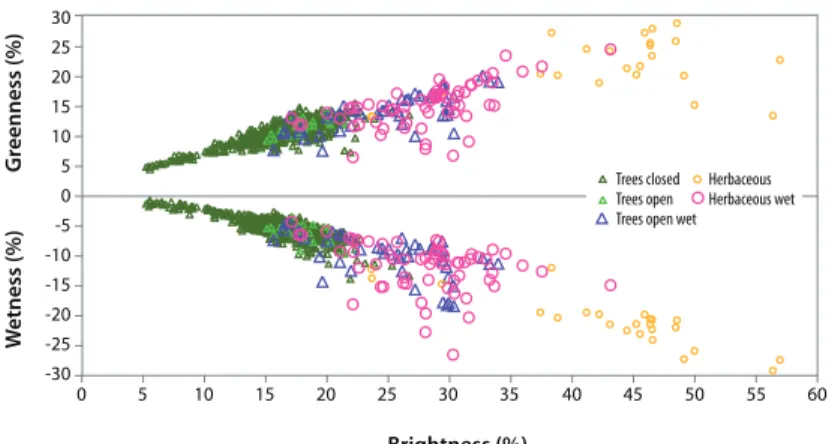
Peatlands of the St. Petersburg region are fairly distinct in Tasselled Cap (TC) spec-tral space (Fig. 3). In terms of TC indices of brightness, greenness, and wetness,
BGD
5, 2075–2101, 2008 Mapping peatlands O. N. Krankina et al. Title Page Abstract Introduction Conclusions References Tables Figures ◭ ◮ ◭ ◮ Back CloseFull Screen / Esc
Printer-friendly Version Interactive Discussion they occupy the space between tree-dominated and herbaceous types on mineral soil.
Defining this spectral space is a likely basis for successful automated mapping of peat-lands with spectral imagery of different resolution. This positioning of peatpeat-lands in spectral space also suggests that land cover classifications which focus on a single vegetation life form as their organizing principle (i.e., tree, shrub, herbaceous) and do
5
not define peatlands as a distinct cover type will likely split peatland spectral space leading to added confusion among land cover types. The location of areas of disagree-ment among current global vegetation maps within the boreal forest zone seems to corroborate this (Herold et al., 2008).
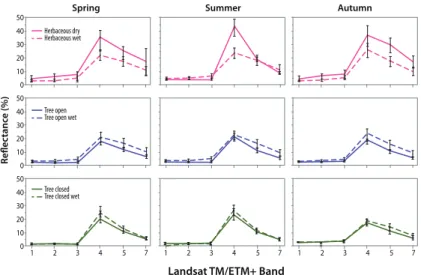
The spectral reflectance signatures showed that peatlands can be separated from
10
similar vegetation types on mineral soil except when under closed tree canopy (Fig. 4). The difference in spectral reflectance of treeless peatlands and herbaceous vegetation on mineral soil was the greatest in the near-infrared (0.77–0.90 µm, Landsat band 4) in the summer (2-June-2002) and in the near- and shortwave-infrared wavelengths (0.77–0.99, 1.55–1.75, 2.08–2.35 µm, Landsat bands 4, 5, 7) in late spring
(19-May-15
1994) and autumn (2-October-2000). The characteristic seasonal variation was greater for herbaceous vegetation on mineral soil than on peatlands: herbaceous vegetation on peatlands did not exhibit mid-season peak as much as herbaceous vegetation on mineral soil. The lower reflectance of peatlands with herbaceous cover in the near-and shortwave-infrared wavelengths (0.77–2.35 µm) was consistent with the difference
20
between the spectral signature of sphagnum and vascular plants (Vogelman and Moss, 1993; Bubier et al., 1997). However, the difference in the shortwave infrared reflectance disappeared on the summer image (Fig. 4) probably reflecting changes in moisture by herbaceous vegetation on mineral soil.
The difference in spectral reflectance between open canopy forests on peatlands
25
and on mineral soil was smaller than for herbaceous-dominated land cover types but some separation of these classes seems possible (Fig. 4). The pattern of difference in this case is not consistent with the spectral signature of sphagnum as the reflectance in the near- and shortwave-infrared part of the spectrum was higher for open canopy
BGD
5, 2075–2101, 2008 Mapping peatlands O. N. Krankina et al. Title Page Abstract Introduction Conclusions References Tables Figures ◭ ◮ ◭ ◮ Back CloseFull Screen / Esc
Printer-friendly Version Interactive Discussion forests on peatlands than on mineral soil. The likely reason is higher average canopy
cover among polygons with open tree stands on mineral soil (46%) than on peatlands (33%). Apparently, the canopy architecture in this case has a greater impact on spec-tral reflectance of polygons than the distinct specspec-tral signature of sphagnum moss. The differences in spectral reflectance among the closed canopy polygons are clearly
in-5
sufficient to distinguish peatlands with Landsat sensor when closed canopy of trees is present.
5 Conclusions
1. Coarse resolution maps of land cover under-represent peatlands in the St. Pe-tersburg region of Russia and in other parts of the boreal zone as well (Frey
10
and Smith, 2007). Coarse resolution (1 km) of categorical maps alone may be responsible for omission of about 50% of peatlands in our study region. Maps that define wetlands as inundated lands omit a significant portion of boreal peat-lands by definition, while on maps with more inclusive definitions the omission is smaller. Pflugmacher et al. (2007) showed that greatly improved mapping at 1 km
15
resolution is possible with MODIS sensor and continuous field approach targeting boreal peatlands.
2. Peatlands occupy spectral space that is fairly distinct from similar vegetation types on mineral soil except when under closed tree canopy. The lower reflectance of treeless peatlands in the near- and shortwave-infrared part of the electromagnetic
20
spectrum is consistent with the spectral signature of sphagnum mosses. However, when trees are present, the canopy architecture appears to be more important than the spectral signature of sphagnum mosses in defining the overall spectral reflectance of peatlands.
3. The seasonal pattern of change in peatlands with herbaceous cover is distinct
25
mid-BGD
5, 2075–2101, 2008 Mapping peatlands O. N. Krankina et al. Title Page Abstract Introduction Conclusions References Tables Figures ◭ ◮ ◭ ◮ Back CloseFull Screen / Esc
Printer-friendly Version Interactive Discussion season peak in the near-infrared part of the electromagnetic spectrum is a
char-acteristic feature of herbaceous cover on mineral soil but not on peatlands. 4. Major under-representation of boreal peatlands on currently available global data
sets reflects the impact of coarse resolution of categorical maps, the limitations of commonly used classification of land cover and the lack of research focus in
5
developing remote sensing methods targeting peatlands. Under-representation of the actual extent of peatlands leads to inadequate representation of their global role even as the models of the peatland response to global change improve. 5. Remotely sensed data provides a globally consistent source of information from
which a globally consistent and spatially explicit data on distribution of peatlands
10
can be extracted. The legacy datasets (e.g., GLWD, national peatland inventories) can play an important role in supporting the development of methods for remote sensing of peatlands by providing a globally distributed set for calibration and vali-dation of new maps. Improved mapping of boreal peatlands with spectral sensors, alone or in combination with radars, is feasible and important for understanding
15
of one of the major feedbacks of terrestrial biota to global climate change.
Acknowledgements. This research was conducted with support from the Land
Cover/Land-Use Change Program of the National Aeronautics and Space Administration (grant number NNG06GF54G). The paper is prepared as a contribution to Biogeosciences Discussions – Special Issue ”Peatlands and the carbon cycle – from local processes to global implications”.
20
We greatly appreciate the support and encouragement of Gabriela Schaepman, Juul Limpens, and other organizers and participants of the Symposium on Carbon in Peatlands (Wageningen, 15–18 April, 2007). The authors thank OSU students Mikhail Yatskov and Joy Morton for their technical assistance in preparation of this manuscript. We also thank referees for assisting in evaluating this paper.
BGD
5, 2075–2101, 2008 Mapping peatlands O. N. Krankina et al. Title Page Abstract Introduction Conclusions References Tables Figures ◭ ◮ ◭ ◮ Back CloseFull Screen / Esc
Printer-friendly Version Interactive Discussion
References
Anisimov, O. A., Vaughan, D. G., Callaghan, T. V., Furgal, C., Marchant, H., Prowse, T. D., Vilhj ´almsson, H., and Walsh, J. E.: Polar Regions (Arctic and Antarctic), in: Climate Change 2007: Impacts, Adaptation and Vulnerability, Contribution of Working Group II to the Fourth Assessment Report of the Intergovernmental Panel on Climate Change, edited by: Parry,
5
M. L., Canziani, O. F., Palutikof, J. P., Van der Linden, P. J., and Hanson, C. E., Cambridge University Press, Cambridge, UK, 653–685, 2007.
Bartalev, S. A., Belward, A. S., Erchov, D. V., and Isaev, A. S.: A new Spot4-Vegetation Derived Land Cover Map of northern Eurasia, Int. J. Remote Sens., 24, 1977–1982, 2003.
Bartolome, E. and Belward, A. S.: GLC2000: A new approach to global land cover mapping
10
from Earth observation data, Int. J. of Remote Sens., 26, 1959–1977, 2005.
Baker, C., Lawrence, R., Montague, C., and Patten, D.: Mapping wetlands and riparian areas using landsat etm+ imagery and decision-tree-based models, Wetlands, 26, 465–474, 2006. Botch, M. S. and Masing, V. V.: Mire Systems in the USSR, in: Ecosystems of the World, 4B,
Mire: Swamp, Bog, Fen and Moor, edited by: Gore, A. J. P., Elsevier, Amsterdam, 95–152,
15
1983.
Bridgham, S. D., Megonigal, J. P., Keller, J. K., Bliss, N. B., and Trettin, C.: Chapter 13: Wet-lands (The First State of the Carbon Cycle Report), U.S. Climate Change Science Program, Synthesis and Assessment Product 2.2, 2007.
Bronge, L. B. and Naslund-Landenmark, B.: Wetland classification for swedish corine land
20
cover adopting a semi-automatic interactive approach, Can. J. Remote Sens., 28, 139–155, 2002.
Bubier, J. L., Rock, B. N., and Crill, P. M.: Spectral reflectance measurements of boreal wetland and forest mosses, J. Geophys. Res.-Atmos., 102, 29483-29494, 1997.
Canty, M. J., Nielsen, A. A., and Schmidt, M.: Automatic radiometric normalization of
multi-25
spectral imagery, Remote Sens. Environ., 91, 441–451, 2004.
Chander, G. and Markham, B. L.: Revised Landsat 5 TM radiometric calibration procedures and post-calibration dynamic ranges, IEEE Transact. Geosci., 41, 2674–2677, 2003. Chavez, Jr., P. S.: Image-based atmospheric corrections – revisited and improved,
Pho-togramm. Eng. Rem. S., 62, 1025–1036, 1996.
30
Cohen, W. B., Maiersperger, T. K., Gower, S. T., and Turner, D. P.: An improved strategy for regression of biophysical variables and Landsat ETM+ data, Remote Sens. Environ., 84,
BGD
5, 2075–2101, 2008 Mapping peatlands O. N. Krankina et al. Title Page Abstract Introduction Conclusions References Tables Figures ◭ ◮ ◭ ◮ Back CloseFull Screen / Esc
Printer-friendly Version Interactive Discussion 561–571, 2003.
Crist, E. P.: A TM tasseled cap equivalent transformation for reflectance factor data, Remote Sens. Environ., 17, 301–306, 1985.
Denman, K. L., Brasseur, G., Chidthaisong, A., Ciais, P., Cox, P. M., Dickinson, R. E., Hauglus-taine, D., Heinze, C., Holland, E., Jacob, D., Lohmann, U., Ramachandran, S., da Silva Dias,
5
P. L., Wofsy, S. C., and Zhang, X.: Couplings Between Changes in the Climate System and Biogeochemistry, in: Climate Change: The Physical Science Basis, Contribution of Working Group I to the Fourth Assessment Report of the Intergovernmental Panel on Climate Change edited by: Solomon, S., Qin, D., Manning, M., Chen, Z., Marquis, M., Averyt, K. B., Tignor, M., and Miller, H. L., Cambridge University Press, Cambridge, UK and New York, NY, USA,
10
2007.
Di Gregorio, A.: Land Cover Classification System: Classification Concepts and User Manual for Software (Version 2), Environment and Natural Resources Service Series, No. 8, FAO, Rome, Italy, 208 pp., 2005.
Frey, K. E. and Smith, L. C.: How well do we know northern land cover? Comparison of four
15
global vegetation and wetland products with a new ground-truth database for West Siberia, Global Biogeochem. Cy., 21, GB1016, doi:10.1029/2006GB002706, 2007.
Friedl, M. A., McIver, D. K., Hodges, J. C. F., Zhang, X. Y., Muchoney, D., Strahler, A. H., Woodcock, C. E., Gopal, S., Schneider, A., Cooper, A., Baccini, A., Gao, F., and Schaaf, C.: Global land cover mapping from MODIS: Algorithms and early results, Remote Sens.
20
Environ., 83, 287–302, 2002.
Frolking, S., Roulet, N., and Fuglestvedt, J: How northern peatlands influence the earth’s ra-diative budget: Sustained methane emission versus sustained carbon sequestration, J. Geo-phys. Res., 111, G01008, doi:10.1029/2005JG000091, 2006.
Gorham, E.: Northern peatlands: Role in the carbon cycle and probable responses to climatic
25
warming, Ecol. Appl., 1, 182–195, 1991.
Hansen, J., Sato, M., Ruedy, R., Lacis, A., and Oinas, V.: Global warming in the twenty-first century: An alternative scenario, Proc. Natl. Acad. Sci., 97, 9875–9880, doi:10.1073/pnas.170278997, 2000.
Herold, M., Mayaux, P., Woodcock, C. E., Baccini, A., and Schmullius, C.: Some challenges
30
in global land cover mapping: An assessment of agreement and accuracy in existing 1 km datasets, Remote Sens. Environ., doi:10.1016/j.rse.2007.11.013, 2008.
BGD
5, 2075–2101, 2008 Mapping peatlands O. N. Krankina et al. Title Page Abstract Introduction Conclusions References Tables Figures ◭ ◮ ◭ ◮ Back CloseFull Screen / Esc
Printer-friendly Version Interactive Discussion coregistration, Int. J. Remote Sens., 24, 3467–3490, 2003.
Kobak, K. I., Kondrasheva, N. Y., and Turchinovich, I. E.: Changes in carbon pools of peatland and forest in northwestern Russia during the Holocene, Global Planet Change, 16/17, 75–84, 1998.
Krankina, O. N., Bergen, K. M., Sun, G., Masek, J. G., Shugart, H. H., Kharuk, V., Kasischke,
5
E., Cohen, W. B., Oetter, D. R., and Duane, M. V.: Northern Eurasia: in: Remote sensing of boreal forests in selectd regions, edited by: Gutman, G., Janetos, A. C., Justice, C. O., Moran, E. F., Mustard, J. F., Rindfuss, R. R., Skole, D., Turner, II, B. L., Cochrane, M. A., Land Change Science: Observing, Monitoring, and Understanding Trajectories of Change on the Earth’s Surface, Springer, Berlin, 123–138, 2004.
10
Kukuev, Y. A., Krankina, O. N., and Harmon, M. E.: The forest inventory system in Russia, J. Forest., 95, 15–20, 1997.
Latifovic, R. and Olthof, I.: Accuracy assessment using sub-pixel fractional error matrices of global land cover products derived from satellite data, Remote Sens. Environ., 90, 153–165, 2004.
15
Li, J. H. and Chen, W. J.: A rule-based method for mapping Canada’s wetlands using optical, radar and DEM data, Int. J. Remote Sens., 26, 5051–5069, 2005.
Loveland, T. R., Reed, B. C., Brown, J. F., Ohlen, D. O., Zhu, Z., Yang, L., and Merchant, J. W.: Development of a global land cover characteristics database and IGBP DISCover from 1-km AVHRR data, Int. J. Remote Sens., 21, 1303–1330, 2000.
20
Lehner, B. and Doll, P.: Development and validation of global databases of lakes, reservoirs and wetlands, J. Hydrol., 296, 1–22, 2004.
Malmberg, U.: BALANS land cover and land use classification methodology, Environmental Climate Programme, Novosat Oy, BALANS report Balans-utv-24 2.0, Stockholm, 2001. Markon, C. J. and Derksen, D. V.: Indentification of tundra land-cover near Teshekpuk Lake,
25
Alaska using spot satellite data, Arctic, 47, 222–231, 1994.
McGovern, E. A., Holden, N. M., Ward, S. M., and Collins, J. F.: Remotely sensed satellite imagery as an information source for industrial peatlands management, Resour. Conserv. Recycl., 28, 67–83, 2000.
McGuire, A. D., Wirth, C., Apps, M., Beringer, J., Clein, J., Epstein, H., Kicklighter, D. W., Bhatti,
30
J., Chapin, III, F. S., de Groot, B., Efremov, D., Eugster, W., Fukuda, M., Gower, T., Hinzman, L., Huntley, B., Jia, G. J., Kasischke, E., Melillo, J., Romanovsky, V., Shvidenko, A., Vaganov, E., and Walker, D.: Environmental variation, vegetation distribution, carbon dynamics and
BGD
5, 2075–2101, 2008 Mapping peatlands O. N. Krankina et al. Title Page Abstract Introduction Conclusions References Tables Figures ◭ ◮ ◭ ◮ Back CloseFull Screen / Esc
Printer-friendly Version Interactive Discussion water/energy exchange at high latitudes, J. Veg. Sci., 13, 301–314, 2002.
Matthews, E.: Global data bases on distribution, characteristics and methane emission of nat-ural wetlands: Documentation of archived data tape, NASA Goddard Space Flight Center, Greenbelt, MD, USA, NASA Technical Memorandum 4153, 1989.
Matthews, E. and Fung, I.: Methane emission from natural wetlands: Global distribution, area,
5
and environmental characteristics of sources, Global Biogeochem. Cy., 1, 61–86, 1987. Oetter, D. R., Krankina, O. N., Cohen, W. B., and Majersperger, T. K.: Using landsat thematic
mapper data to map land cover and biomass in a Russian forest for regional carbon storage inventory, Global Change Open Science Conference, Amsterdam, The Netherlands, 10–13 July, 2001.
10
Pflugmacher, D., Krankina, O. N., and Cohen, W. B.: Satellite-based peatland mapping: Poten-tial of the MODIS sensor, Global Planet. Change, 56, 248–257, 2007.
Pastor, J., Solin, J., Bridgham, S. D., Updegraff, K., Harth, C., Weishampel, P., and Dewey, B.: Global warming and the export of dissolved organic carbon from boreal peatlands, Oikos, 100, 380–386, doi:10.1034/j.1600-0706.2003.11774.x, 2003.
15
Poulin, M., Careau, D., Rochefort, L., and Desrochers, A.: From Satellite Imagery to Peatland Vegetation Diversity: How Reliable Are Habitat Maps?, Conserv. Ecol., 6, 2002.
Prigent, C., Papa, F., Aires, F., Rossow, W. B., and Matthews, E.: Global inundation dynamics inferred from multiple satellite observations, J. Geophys. Res., 112, D12107, doi:10.1029/2006JD007847, 2007.
20
Rosenqvist, A., Finlayson, C. M., Lowry, J., and Taylor, D.: The potential of long-wavelength satellite-borne radar to support implementation of the Ramsar Wetlands Convention, Aquat. Conserv., 17, 229–244, 2007.
Roulet, N. T.: Peatlands, carbon storage, greenhouse gases, and the Kyoto Protocol: prospects and significance for Canada, Wetlands, 20, 605–615, 2000.
25
Sheng, Y., Smith, L. C., MacDonald, G. M., Kremenetski, K. V., Frey, K. E., Velichko, A. A., Lee, M., Beilman, D. W., and Dubinin, P.: A high resolution GIS-based in-ventory of the West Siberian peat carbon pool, Global Biogeochem. Cy., 18, GB3004, doi:10.1029/2003GB002190, 2004.
Smith, L. C., MacDonald, G. M., Velichko, A. A., Beilman, D. W., Borisova, O. K., Frey, K. E.,
30
Kremenetski, K. V., and Sheng, Y.: Siberian peatlands a net carbon sink and global methane source since the Early Holocene, Science, 303, 353–356, 2004.
BGD
5, 2075–2101, 2008 Mapping peatlands O. N. Krankina et al. Title Page Abstract Introduction Conclusions References Tables Figures ◭ ◮ ◭ ◮ Back CloseFull Screen / Esc
Printer-friendly Version Interactive Discussion United States Geological Survey, 1987.
Sonnentag, O., Chen, J. M., Roberts, D. A., Talbot, J., Halligan, K. Q., and Govind, A.: Mapping tree and shrub leaf area indices in an ombrotrophic peatland through multiple endmember spectral unmixing, Remote Sens. Environ., 109, 342–360, 2007.
Sturm, M., Racine, C., and Tape, K.: Increasing shrub abundance in the Arctic, Nature, 411,
5
546–547, 2001.
Turner, D. P., Cohen, W. B., and Kennedy, R. E.: Alternative spatial resolutions and estimation of carbon flux over a managed forest landscape in western Oregon, Landscape Ecol., 15, 441–452, 2000.
Vogelmann, J. E. and Moss, D. M.: Spectral reflectance measurements in the Genus
Sphag-10
BGD
5, 2075–2101, 2008 Mapping peatlands O. N. Krankina et al. Title Page Abstract Introduction Conclusions References Tables Figures ◭ ◮ ◭ ◮ Back CloseFull Screen / Esc
Printer-friendly Version Interactive Discussion
Table 1. Assessment of peatland representation on coarse-resolution maps and on
Landsat-based LARSE land cover map (Oetter et al., 2001) for the St. Petersburg region of Russia.
Wetland
Map and reference Spatial (km2(%)) Relevant class labels (% of land area) Agreement with
resolution area LARSE land cover map
Area Omission Comission (km2) error (%) error (%) LARSE land cover 28.5 m 6810 Peatlands, unmined (8.82%) N/A N/A N/A Oetter et al. (2001) (9.7) and mined (0.86%)
LARSE peatland cover 1 km 7004 Peatlands, unmined (8.8%) 4046 41 42 Pflugmacher et al. (2007) (9.8) and mined (1.0%)
GLC2000 Northern Eurasia 1 km 2863 Bogs and Marsh (4.0%), 1529 77 47 Bartalev et al. (2003) (4.1) Palsa bogs (0.02%)
Riparian vegetation (0.02%)
MODIS IGBP land cover 1 km 138 Permanent wetlands (0.2%) 39 99 72 Friedl et al. (2002) (0.2)
BALANS land cover 150 m 3113 Wetland (4.4%) 1742 74 44
Malmberg (2001) (4.4)
Global Lakes & Wetlands Database 1 km 2307 Freshwater Marsh, Floodplain (3.3%)
BGD
5, 2075–2101, 2008 Mapping peatlands O. N. Krankina et al. Title Page Abstract Introduction Conclusions References Tables Figures ◭ ◮ ◭ ◮ Back CloseFull Screen / Esc
Printer-friendly Version Interactive Discussion 120°E 100°E 80°E 60°E 40°E 20°E 20°E 50°N 70°N 30°N 30°N 10°N Ru ss i a
BGD
5, 2075–2101, 2008 Mapping peatlands O. N. Krankina et al. Title Page Abstract Introduction Conclusions References Tables Figures ◭ ◮ ◭ ◮ Back CloseFull Screen / Esc
Printer-friendly Version Interactive Discussion 34°E 32°E 30°E 28°E 61°N 60°N 59°N 34°E 32°E 30°E 28°E 61°N 60°N 59°N 61°N 60°N 59°N 34°E 32°E 30°E 28°E 61°N 60°N 59°N 61°N 60°N 59°N 34°E 32°E 30°E 28°E 61°N 60°N 59°N Peatlands a ) a ) b )b ) c ) c ) d )d ) e ) e ) f )f ) 100% Peatland cover 0% Wetlands Wetlands Not mapped Peatlands Not mapped Wetlands
Fig. 2. Peatlands in the St. Petersburg region of Russia – representation on different maps: (a)
LARSE land cover (Oetter et al., 2001), (b) LARSE peatland cover (Pflugmacher et al., 2007);
(c) GLC2000 Northern Eurasia (Bartalev et al., 2003), (d) MODIS IGBP land cover (Friedl et
al., 2002), (e) BALANS land cover (Malmberg, 2001), (f) Global Lakes and Wetland Database (Lehner and D ¨oll, 2004).
BGD
5, 2075–2101, 2008 Mapping peatlands O. N. Krankina et al. Title Page Abstract Introduction Conclusions References Tables Figures ◭ ◮ ◭ ◮ Back CloseFull Screen / Esc
Printer-friendly Version Interactive Discussion Trees closed Trees open Herbaceous Herbaceous wet Trees open wet
0 30 25 20 15 10 5 0 -5 -10 -15 -20 -25 -30 5 10 15 20 25 30 Brightness (%) G reenness (%) W etness (%) 35 40 45 50 55 60
Fig. 3. Average reflectance of ground polygons in Tasselled Cap spectral indices of brightness,
BGD
5, 2075–2101, 2008 Mapping peatlands O. N. Krankina et al. Title Page Abstract Introduction Conclusions References Tables Figures ◭ ◮ ◭ ◮ Back CloseFull Screen / Esc
Printer-friendly Version Interactive Discussion 50 40 30 20 10 0 50 40 30 20 10 0 50 40 30 20 10 0
Landsat TM/ETM+ Band
R
eflec
tanc
e (%)
Spring Summer Autumn
7 5 4 3 2 1 1 2 3 4 5 7 1 2 3 4 5 7 Herbaceous dry Herbaceous wet Tree open Tree open wet
Tree closed Tree closed wet
Fig. 4. Mean reflectance and standard deviation (error bars) of different vegetation types as
observed in ground polygons. Landsat TM/ETM+ Band 1 is 0.45–0.52 µm, Band 2 is 0.52– 0.60 µm, Band 3 is 0.63–0.69 µm, Band 4 is 0.76–0.90 µm, Band 5 is 1.55–1.75 µm and Band 7 is 2.08–2.35 µm.