Publisher’s version / Version de l'éditeur:
Journal of Applied Polymer Science, 79, 6, pp. 1034-1041, 2001-01-01
READ THESE TERMS AND CONDITIONS CAREFULLY BEFORE USING THIS WEBSITE.
https://nrc-publications.canada.ca/eng/copyright
Vous avez des questions? Nous pouvons vous aider. Pour communiquer directement avec un auteur, consultez la
première page de la revue dans laquelle son article a été publié afin de trouver ses coordonnées. Si vous n’arrivez pas à les repérer, communiquez avec nous à PublicationsArchive-ArchivesPublications@nrc-cnrc.gc.ca.
Questions? Contact the NRC Publications Archive team at
PublicationsArchive-ArchivesPublications@nrc-cnrc.gc.ca. If you wish to email the authors directly, please see the first page of the publication for their contact information.
Archives des publications du CNRC
This publication could be one of several versions: author’s original, accepted manuscript or the publisher’s version. / La version de cette publication peut être l’une des suivantes : la version prépublication de l’auteur, la version acceptée du manuscrit ou la version de l’éditeur.
For the publisher’s version, please access the DOI link below./ Pour consulter la version de l’éditeur, utilisez le lien DOI ci-dessous.
https://doi.org/10.1002/1097-4628(20010207)79:6<1034::AID-APP60>3.3.CO;2-W
Access and use of this website and the material on it are subject to the Terms and Conditions set forth at
Rapid FTIR method for quantification of styrene-butadiene type copolymers in bitumen
Masson, J-F.; Pelletier, L.; Collins, P.
https://publications-cnrc.canada.ca/fra/droits
L’accès à ce site Web et l’utilisation de son contenu sont assujettis aux conditions présentées dans le site LISEZ CES CONDITIONS ATTENTIVEMENT AVANT D’UTILISER CE SITE WEB.
NRC Publications Record / Notice d'Archives des publications de CNRC:
https://nrc-publications.canada.ca/eng/view/object/?id=4e199d3a-b98c-4905-a747-edf019aa3a8e https://publications-cnrc.canada.ca/fra/voir/objet/?id=4e199d3a-b98c-4905-a747-edf019aa3a8e
styrene-butadiene type copolymers in
bitumen
Masson, J-F.; Pelletier, L.; Collins, P.
A version of this paper is published in / Une version de ce document se trouve dans : Journal of Applied Polymer Science, v. 79, no. 5, 2001, pp. 1034-1041
www.nrc.ca/irc/ircpubs
J-F. Masson*, L. Pelletier†, and P. Collins
Institute for Research in Construction, National Research Council of Canada, Ottawa, Ontario, Canada, K1A 0R6
The mid-infrared molar absorptivity for polystyrene (PS) and polybutadiene (PB) blocks were obtained for five SBS and SB copolymers, including linear, branched and star copolymers, and their blends with bitumen. The average absorptivity for PS and PB blocks was 277 and 69 L·mol-1·cm-1 and it waslittle affected by the S/B ratio or the copolymer architecture. In presence of bitumen, Beer’s law was obeyed but the respective PS and PB absorptivity was 242 and 68 L·mol-1·cm-1, possibly because of weak interactions between copolymer and bitumen. The absorptivity values were used to calculate the concentration of SB-type copolymers in blends with bitumen with an accuracy of 10% or better. The method can be used to probe the stability of bitumen-copolymer blends to storage at 165°C, determine the copolymer concentration in commercial PMB, and assess the resistance of PMB to weathering.
Keywords: bitumen, blends, polymer, styrene-copolymer, butadiene-copolymer, infrared spectroscopy, quantification, stability, sealants.
* To whom correspondence should be addressed.
Introduction
Polymer modified bitumen (PMB) is used in many construction applications, the most important being roofing and roadways. In PMB, the polymer is an elastomer or a thermoplastic that allows for greater performance over that possible with bitumen alone1. In this respect, styrene-butadiene block elastomers (e.g. SB, SBS) are commonly used to improve the low temperature cracking resistance of bitumen. The low glass transition temperature of the butadiene block at about –95°C insures that a SBS or SB modified bitumen remains elastic during winter.
The performance of modified bitumen is partly governed by its SB or SBS content. Under the right conditions, this polymer content can be measured accurately. If raw materials are available,
calibration standards can be prepared and the polymer can be quantified by infrared spectroscopy2. If the SBS or SB modified bitumen, hereafter abbreviated to SB-MB, is freshly prepared and no crosslinks exist between bitumen and polymer, the polymer can be extracted with suitable solvent3. These methods lack flexibility, however, because raw materials are most often unavailable.
Consequently, the polymer content in SB-MB from different sources is difficult to obtain, and for the same reasons, it is difficult to assess the resistance of SBS or SB to the aging that SB-MB may incur during field installation4 or natural weathering5.
(1) Lewandowski, L.H. Rub. Chem. Technol. 1994, 67, 447-480.
(2) Choquet F.S. and Ista E. J in Polymer modified Asphalt Binders, ASTM STP 1108, K.R. Wardlaw and S. Shuler Eds., American Society for Testing and Materials, Philadelphia, 1992, 35-49.
(3) Maréchal, J.-C. Bull. Liaison Labo. Ponts Chaussées 1979, 103, 111-118.
Here we present a FTIR method that can be used when SB-MB is aged or when control samples are unavailable. The method can substitute for the prevously cited FTIR2 and extraction methods3. It relies on the average molar absorptivities for polybutadiene (PB) and polystyrene (PS) blocks in SB-type copolymers. As will be demonstrated, these absorptivities can be used to quantify SB-type copolymers in SB-MB because the copolymer structure has little effect on the molar absorptivity, and because bitumen does not prevent the use of Beer’s law despite some interactions with the copolymer. The usefullness of the method is shown by quantifying SBS in seven SB-MB from different sources, by assessing SB-MB stability during storage at 165 °C, and by measuring SBS degradation in a weathered SB-MB sample.
Experimental
Materials. PS and PB were purchased from Aldrich (respective catalog # 18138-2 and 18242-7).
SB-MB were prepared in the laboratory, and obtained from commercial sources. The laboratory samples were prepared from five styrene-butadiene copolymers and two bitumens. The copolymers were supplied by Enichem and Shell (Table 1). The bitumens, A and B, had respective saturates, aromatics, resins and asphaltenes (SARAs) compositions of 2, 35, 40, 23 and 11, 16, 57, 16 wt % as
(5) Masson, J-F. and Lacasse, M. A. Proc. Conf. Pavement Crack and Joint Sealants for Rigid and Flexible Pavements. USAE Waterways Experiment Station, Vicksburg, MS, May 20-21, 1997, pp. 152-167.
(6) Günther, H. NMR Spectroscopy: Basic principles, concepts, and applications in chemistry. John Wiley and Sons, New York, Second edition, 1995, p. 22.
measured with the Iatroscan7 after elutions in heptane, toluene and tetrahydrofuran. Bituminous crack sealants were used as commercial SB-MB sources.
Blends. Twenty-four SB-MB were prepared from the two bitumens and the five copolymers.
Copolymer concentrations were 3, 6, and 10% w/w, except for copolymer L2 where concentrations were 3 and 5% w/w. In a typical preparation, 500 g of bitumen was kept under a nitrogen blanket and heated to 170oC in about 30 minutes. The copolymer was added stepwise in about 5 minutes with stirring at about 1000 rpm using a Silverson L4RT high-shear mixer. Stirring was continued for an additional 30 minutes at 185oC and 5000 rpm. To assess blend stability, a 250 g sample of SB-MB was stored without agitation at 165oC.
FTIR. Typically, 5 g of SB-MB was dissolved in 50 g of carbon disulfide. This solvent was
chosen because of its lack of absorbance below 1400 cm-1, and its ability to dissolve equally well both bitumen and copolymer. Carbon disulfide must be handled with care, however, because of its flammability and toxicity. The 10% solution was successively diluted to 5, 2.5, 1.25 and 0.625% (w/w). Homo- and co-polymer solutions with PS and PB contents close to those in the PMB solutions were obtained by dilution of a polymer stock solution prepared from 1.5 to 3.0 g of polymer dissolved into 38 g of carbon disulfide.
Sealant solutions were prepared from about 350 mg of solid dissolved in about 7 g of carbon
disulfide, to provide concentrations of 5% w/w. Each solution was analyzed by transmission and in
(7) Ranný, M. Thin-Layer Chromatography with Flame Ionization Detection; D. Reidel
triplicate by the cell-in cell-out method8. Cell path length was 1.25 mm. Fifty scans were coadded on a Bomem MB100 spectrometer operated at a resolution of 4 cm-1. Variation of absorbance on the triplicates was less than 1%. The molar absorptivity was obtained for the strongest copolymer absorptions: 966 cm-1for PB, and 699 cm-1 for PS. With solutions of decreasing polymer
concentrations, the absorptivity a was calculated by application of Beer’s law, a = A/bc, where A is the absorbance, b the cell path length, and c the copolymer concentration.
Results and Discussion
Spectal analysis
FTIR spectra for SB-MB show absorbances from bitumen, and the PS and PB copolymer units. The region of interest for the quantification of the copolymer is 650-1100 cm-1 (Figure 1). The origin of the peaks in this region is shown in Table 2. It is by monitoring the respective PB and PS absorbances at 966 and 699 cm-1 that the copolymer in SB-MB can be quantified, and it is by the relative decrease in the PB and PS absorbances, if any, that degradation can be assessed (see Appendix). To quantify the copolymer rapidly with the use of peak absorbtivities, and circumvent the need for the classical calibration curve2, only the respective copolymer units must contribute to the peak height at 966 and 699 cm-1; significant overlap of PS with PB or bitumen, for example, would not allow for quantification of the copolymer. Fortunately, there is indeed negligible overlap betweeen PS, PB and bitumen (Figures 2 and 3). It was thus possible to proceed with the measurement of the polymer absorptivity in an attempt to develop a rapid quantification method. (8) Potts, W. J. Chemical Infrared Spectroscopy, Volume 1: Techniques. John Wiley & Sons: New York, 1963.
Polymer Absorptivity. The absorptivities for PB at 966 cm-1 and PS at 699 cm-1 were obtained by measuring the absorbances of successively more dilute solutions, and by plotting the absorbance against the concentration (Figure 4). The slope of Beer’s law curve gives the absorptivity. Values of 266 and 73 L·mol-1·cm-1 were calculated for PS and PB, respectively. These values were then compared to those of the PS and PB units in linear, branched and star SBS and SB copolymers commonly used to modify bitumen (Table 3). The comparison showed that PS and PB
absorptivities are affected by copolymer structure and composition. For example, on the one hand, the PS absorptivity in linear copolymer L1 was 30 L·mol-1cm-1 higher (11.5%) than in branched copolymer B1, although both copolymers had an S/B ratio of 30/70. The change stems more from the effect of copolymer structure than from a possible effect in molecular weight since linear copolymers L1 and L2 with very different molecular weights showed identical PS absorptivities. On the other hand, the PB absorptivity is affected by the block composition (Figure 5). The absorptivity at 966 cm-1 correlates to the concentration of terminal alkenes that arise from the 1,2-polymerization of butadiene.
Interestingly, the branched copolymer B2 did not follow the expected correlation between PB absorptivity and terminal alkene content (Figure 5). The reason behind the deviation is found in the FTIR and H1 NMR spectra for the copolymer, which reveal the presence of fully saturated units in the copolymer. The PS and PB absorptivities in copolymer B2, which are about 65% of that for the homopolymers (Table 2), would suggest that the copolymer is 35% hydrogenated, that is, its structure contains polyethylene and poly(alkyl)cyclohexane units. Copolymer B2 was not an SB-type copolymer and consequently it was not studied further.
Polymer-Bitumen Blends.
asphaltenes, which may be capable of strongly interacting with a polymer either through dipole-dipole or hydrogen bonds. The interactions may be disruptive and cause deviations from Beer’s law. In such a case, the absorption of the polymer in the FTIR spectrum would no longer be linearly correlated to its concentration and it would be impossible to quantify it rapidly and without a calibration curve that accounts for these interactions.
It was thus of interest to investigate the effect of bitumen on PS and PB absorptivities. For that purpose, we measured the absorptivities of the 4 copolymers used earlier when blended with 2 bitumens of different compositions (see Experimental for composition). The results showed that in the presence of bitumen, the copolymer absorptivity still obeys Beer’s law (Figures 7 and 8). No deviation from linearity was observed, irrespective of the bitumen composition and the copolymer type. There was thus no strong interaction between bitumen and SB-type copolymers in solution. However, a relatively large decrease in the PS absorptivity in blends with bitumen, 242 L·mol-1·cm-1 in blends versus 277 L·mol-1·cm-1 for the copolymer alone, suggests a weak interaction between PS blocks and bitumen, which is rich in (poly)aromatics. This is in accordance with the good
dispersion of SB-type copolymers in bitumen rich in aromatics9. The stacking of aromatic rings by π-π interactions10 and induced dipolar interactions11could keep PS and bitumen aromatics in close
(9) Brion, Y. and Brûlé, B. Étude des mélanges bitumes-polymères: composition, structure et propriétés. Report PC-6, Labo. Central Ponts Chaussés, Paris, 1986.
(10) Lin, M.S., Lunsford, K.M., Glover, C.J. Davison, R.R., and Bullin, J.A. The effect of asphaltenes on the chemical and physical characteristics of asphalt, in Asphaltenes: Fundamentals and Applications, Sheu, E.Y. and Mullins, O.C. Ed., Plenum, New York, 1995.
proximity, and as a result, limit the C-H out-of-plane bending vibration of PS that would lower the absorptivity at 699 cm-1. The effect on the PB block would be similar but much less effective in keeping the more flexible chain in proximity of bitumen, and as a result, the PB remains practically unchanged.
With the average absorptivity for the PS and PB blocks, the copolymer concentrations in all SB-MB were back-calculated, as if each sample had an unknown copolymer concentration (Table 4). This allowed us to assess the accuracy at which we could quantify SBS or SB in SB-MB prepared from a bitumen and SB-type copolymer of unknown sources. In all cases, the calculated polymer content was within ±0.5 wt % of the expected value. This translated into an average error of 10% or less of the actual polymer contents.
Practical Applications. With the available average absorptivities for the PS and PB blocks in
hand, we applied Beer’s law against three practical problems:
1. The stability of a freshly prepared SB-MB during storage at 165°C, a condition representative of the practice in roadway construction12.
2. The quantifying of polymer contents in commercial SB-MB, namely, crack sealants. 3. The aging of a SBS copolymer in one of the crack sealants exposed to five years of outside
weathering13.
(11) Ensley, E.K. Thermodynamics of asphalt intermolecular interactions and asphalt-aggregate interactions, in Asphaltenes and Asphalts: Development in Petroleum Science, vol. 40, Yen, T.F. and Chilingarian, G.V. Ed., Elsevier, New York, 1994.
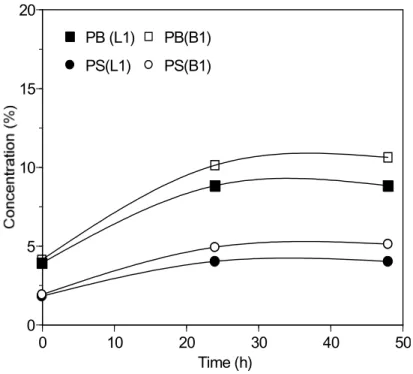
The SB-MB stability was assessed by measuring the change in polymer concentration at the SB-MB surface during storage at 165°C. Figure 9 shows the results for blends prepared with bitumen A and copolymers L1 and B1 of identical S/B ratios. Each blend shows segregation over time as seen by a 2-fold increase in PS and PB concentration at the blend surface. Identical trends for PS and PB indicate that no degradation of the polymer by oxidation or scission has occurred (Appendix). In both cases segregation was complete within 24 hours but it was greater in the case of B1, because of its greater molecular weight and the reduced entropy of mixing14. The steric effect of the branch structure may also be partly responsible for the greater segregation. A more detailed study of the effect of copolymer structure on blend stability is underway.
Table 5 shows the results obtained on commercial SB-MB (sealants). The polymer concentration varied from about 4 to 18 %, the more common concentration of 4 to 6% being representative of that for SB-MB used in roadway construction. The method is also useful to assess the resistance of SB-MB to weathering. The results in Table 6 show that the initial SBS content of 6.5% in sealant M decreased by about 12% in 5 years of natural weathering. This loss is twice as large as the estimated error of 6% obtained earlier for the SB-MB with 6% copolymer (Table 4). It is likely then that the estimated loss is real. It is also noteworthy that the loss of PS is greater that that for PB. This suggests that the kinetics of PS degradation is greater than that for PB (Appendix A), or alternatively, that the polymer in sealant M is a linear SBS in which PS degradation occurs at both ends of the chains in contrast to PB.
(13) Masson, J-F., Collins, P., Légaré, P-P., Can. J. Civ. Eng. 1999, 125, in press.
Conclusion
The mid-infrared absorptivity for PS at 699 cm-1 and PB at 966 cm-1 was obtained on linear, star, and branched SB-type copolymers, before and after blending with bitumen. In all cases, Beer’s law was obeyed. Before blending, the respective PS and PB absorptivities were 277 and 69 L·mol-1cm
-1
, and after blending, they were 242 and 68 L·mol-1cm-1. The decrease in copolymer absorptivity in the bitumen blends was attributed to weak interactions between copolymer and bitumen. Given the applicability of Beer’s law, the average absorptivities for PS and PB in blends with bitumen were used to measure the concentration of SB-type copolymers in bitumen with an accuracy of ±0.4 wt %, or better, of the expected value. The method can be used to:
1. Quantify SB or SBS contents in bituminous products when calibration standards prepared from the raw materials are unavailable.
2. Compare the SB or SBS contents of bituminous products such as crack sealants and polymer modified binders in roadways and roofing applications.
3. Study the effect of weathering, oven aging, or heat storage on polymer concentration in modified bitumen.
The method could be extended to other bitumen-polymer blends that contain a polymer with an infrared spectrum distinct from that of bitumen, including isoprene copolymer, styrene-butadiene rubber, polychloroprene, polyisoprene (natural and synthetic), ethylene-vinylacetate and styrene-ethylene-butylene-styrene polymers. The method cannot be used on bitumen blends with polyolefins, including polyethylene and polypropylene because they do not have infrared
Appendix: Degradation pathways for polystyrene and polybutadiene
Degradation is inseparable from polymer production, transformation and use. The latter are responsible for the presence of catalytic residues; oxygen into the main chain or a side chain; and weak links, especially at chain ends. Degradation begins at these sites with the rupture of a bond due to a photo-chemical, mechanical, or thermal action15,16. Given the industrial importance of polystyrene (PS) and polybutadiene (PB), there has been several studies on their degradation pathways17-22. The kinetics of degradation is related to the oxygen concentration within the polymer, i.e., the concentration of oxygen outside the polymer and its rate of diffusion, but if the oxygen concentration is low, the depolymerization of PS, and the cross-linking of PB is predominant. Figure A1 illustrates typical degradation pathways (adapted from ref. 13, 14, 17, 19, 20).
(15) Mercier, J.-P.; Maréchal, E. Traité des matériaux, vol. 13: Chimie des polymères—Synthèses, réactions, dégradations; Presses polythechniques et universitaires romandes: Lausanne, Suisse, 1993.
(16) McNeill, I.C.; Royal Soc. Chem., Special Pub. 1992, 105, 14-31 (17) D’Esposito, L; Koenig, J.L. Polym. Eng. Sci. 1979, 19(2), 162-165.
(18) Kostov, G.I.; Komitov, P.G.; Nikilova, Z.G. Eur. Polym. J. 1985, 21(6), 561-564. (19) Nyquist, R.A. Appl. Spectros. 1984, 38(2), 264-267.
(20) Schneider, B.; Doskocilová, D.; Štokr, J. Polym. 1993, 34(2), 432-436. (21) Rabek, J.F.; Lucki, J.; Rånby, B. Eur. Polym. J. 1979, 15, 1089-1100. (22) Lucki, J.; Rånby, B.; Rabek, J.F. Eur. Polym. J. 1979, 15, 1101-1110.
Figure 1. Portion of FTIR spectra for bitumen modified with SBS. The peak height at 966, 911, and 699 cm-1 is proportional to copolymer content.
0 0.1 0.2 0.3 0.4 0.5 0.6 0.7 650 750 850 950 1050 Wavenumber (cm-1) Absorbance 3 % SBS 6 % SBS 10 % SBS 1030 993 966 911 874 814 698 722 746
Figure 2. Portion of FTIR spectra for PS, PB and SBS. The 966 cm-1 PB absorbance in SBS is independent of that for PS. That for PS at 699 cm-1 overlaps with a broad PB absorbance but the baseline is such that the latter can easily be discounted. Hence the respective PS and PB
absorbances can be used for quantification purposes. The origin and band positions are shown in Table 2. 650 700 750 800 850 900 950 1000 1050 Wavenumber (cm-1) A b sorbance SBS polybutadiene polystyrene
Figure 3. Portion of FTIR spectra for SBS, bitumen and a blend. There is little overlap between the copolymer and bitumen at 966 and 699 cm-1.
0
0 .1
0 .2
0 .3
0 .4
0 .5
6 5 0
7 5 0
8 5 0
9 5 0
1 0 5 0
W av en um ber (cm
-1)
Absorbance
6 % S B -M B b it ume n S B S c o p o lyme rFigure 4. Beer’s law curves for neat PS and PB in carbon disulfide.
Figure 5. Relationship between terminal alkene content and the PB absorptivity at 966 cm-1. The curve follows the quadratic equation y = -1.8x2 + 33.3x – 79.5. See text for details.
y = 72.824x + 0.0142 R2 = 0.994 y = 266.48x + 0.0198 R2 = 0.9976 0 0.2 0.4 0.6 0.8 1 0 0.002 0.004 0.006 0.008 0.01 C x 0.125 cm A b so rb ance PS PB R2 = 0.9951 40 45 50 55 60 65 70 75 80 8 9 10 11 12 13
Terminal Alkene Content (%)
A b so rp tiv ity (L ·m o l -1 ·cm -1 ) L1 B2 L2 S1 B1 PB
N S N OH S S S Bitumen aromatics asphaltenes saturates (paraffins) resins
Figure 6. Representative structures for the four bitumen fractions : the saturates, the aromatics, the resins and the asphaltenes.
Figure 7. Beer’s law plot for blends prepared from two bitumens and five SB-type copolymers. The PS block absorptivity was 242 L·mol-1·cm-1 as obtained from the slope.
y = 241.66x + 0.0117 R2 = 0.9891 0 0.2 0.4 0.6 0.8 1 1.2 0 0.001 0.002 0.003 0.004 0.005 C x 0.125 cm Absorbance PS block
Figure 8. Beer’s law plot for blends prepared from two bitumens and five SB-type copolymers. The PB block absorptivity was 68 L·mol-1·cm-1 as obtained from the slope.
Figure 9. Change in PS and PB concentration at the surface of blends with bitumen A and copolymer L1 or B1 during storage at 165 °C. See text for details.
y = 68.046x + 0.0067 R2 = 0.9816 0 0.05 0.1 0.15 0.2 0.25 0.3 0.35 0 0.002 0.004 0.006 C x 0.125 cm Absor bance PB block 0 5 10 15 20 0 10 20 30 40 50 Time (h) PB (L1) PS(L1) PB(B1) PS(B1)
Figure A1 Polystyrene C H3 CH3 m n (D) (O) (S) C H3 CH2 p H3C CH2 q O m,n C H32
.
+ momomer + dimer + trimer [D] depolymerization [H] hydrogen transfer [I] isomerisation [O] oxidation [S] scission [X] cross-linking Polybutadiene [I] cis-1,2 unitH3C CH3 n C H3 CH3 n trans-1,4 unit [H] C H3 CH3 n [O] CH3 C H3 O O [S] C H3 CH2 (PB) [O] C H3 CH2 CH2 (PB) O C H3 CH3 CH2 (PB) O CH3 C H3 CH2 n [H] CH3 C H3 CH3 n [O] C H3 CH2 OH C H3 CH3 CH3 [X] 1,2-vinyl unit 699 cm-1 1686 cm-1 966 cm-1 911 cm-1 1685 cm-1 1710 cm-1 3450 cm-1Tables
Table 1. Copolymer characteristics.
Table 2. Absorptions between 650 and 1100 cm-1 in FTIR spectra of bitumen, PS and PB. Table 3. Molar absorptivity of the PB and PS blocks (L·mol-1·cm-1).
Table 4. Copolymer concentrations calculated with the absorptivity averages.
Table 5. Polymer concentration in commercial SB-MB.
Table 1. Copolymer Characteristics
S/B ratio
Type Label Source and name Mn* Mw/Mn Expected Measured** Styrene Butadiene Styrene Butadiene linear SBS
L1 Enichem, SOL T166 124 1.04 30 70 30 70 (11) L2 Shell, Kraton D1101 166 1.09 31 69 33 67 (9) Branched SB
B1 Enichem, SOL T6302 173 1.06 30 70 30 70 (12) B2 Shell, Kraton D4240E n.d. n.d. 44 56 48 52 (10) star SB
S1 Enichem, SOL T6205 264 1.14 25 75 24 76 (11) * In thousands
** Measured by NMR as per ref. 6. Number in parenthesis is the percent content of terminal alkene in the PB segment n.d.: not determined
Table 2. Absorptions Between 650 and 1100 cm-1 in FTIR Spectra of Bitumen, PS and PB.
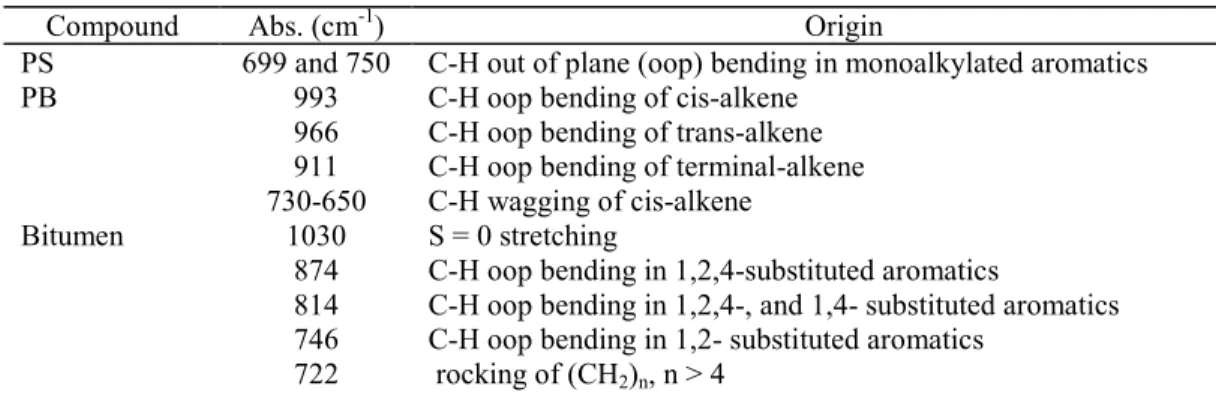
Compound Abs. (cm-1) Origin
PS 699 and 750 C-H out of plane (oop) bending in monoalkylated aromatics PB 993 C-H oop bending of cis-alkene
966 C-H oop bending of trans-alkene 911 C-H oop bending of terminal-alkene 730-650 C-H wagging of cis-alkene
Bitumen 1030 S = 0 stretching
874 C-H oop bending in 1,2,4-substituted aromatics
814 C-H oop bending in 1,2,4-, and 1,4- substituted aromatics 746 C-H oop bending in 1,2- substituted aromatics
Table 3. Molar Absorptivity for PB and PS Blocks (L·mol-1·cm-1). Polymer S/B ratio PB (966 cm-1) PS (699 cm-1) PS 100/0 -- 266 PB 0/100 73 --L1 30/70 70 290 L2 31/69 76 290 B1 30/70 61 260 B2 44/56 48 169 S1 25/75 68 267
Table 4. Copolymer Concentrations Calculated With the Absorptivity Averages
Copolymer Bitumen A Bitumen B 3% 6% 10% 3% 6% 10% L1 2.8 5.7 9.3 3.3 5.7 9.3 L2 2.8 *4.7 nd nd nd nd B1 3.4 5.7 9.5 3.0 6.4 9.5 S1 3.4 5.5 9.5 3.1 5.7 9.2 average error 10% 6% 6% 4% 6% 7% * This value is for a 5% w/w sample. nd: not determined.
Table 5. SB-type Colymer Concentration in Bituminous Sealants Sealant* Concentration (%) A 5.2 D 4.4 E 18.5 F 5.0 J 11.2 K 5.9 M 6.3 * From ref. 4
Table 6. Polymer Contents (w/w%) in Sealant M Before and After Weathering
Block Weathering Percent decrease None 5 years
PB 4.4 3.9 11.4
PS 2.1 1.8 14.3


![Figure A1Polystyrene CH3 CH 3mn(D)(O) (S)CH3CH2pH3CCH2qO m,nCH32.+ momomer+ dimer+ trimer[D] depolymerization[H] hydrogen transfer[I] isomerisation[O] oxidation[S] scission[X] cross-linking Polybutadiene [I]cis-1,2 unitH3C CH 3nCH3CH 3ntrans-1,4 unit [H]](https://thumb-eu.123doks.com/thumbv2/123doknet/14202319.480197/20.918.78.877.130.784/polystyrene-depolymerization-hydrogen-transfer-isomerisation-oxidation-scission-polybutadiene.webp)