HAL Id: inria-00509256
https://hal.inria.fr/inria-00509256v2
Submitted on 12 May 2011
HAL is a multi-disciplinary open access
archive for the deposit and dissemination of
sci-entific research documents, whether they are
pub-lished or not. The documents may come from
teaching and research institutions in France or
abroad, or from public or private research centers.
L’archive ouverte pluridisciplinaire HAL, est
destinée au dépôt et à la diffusion de documents
scientifiques de niveau recherche, publiés ou non,
émanant des établissements d’enseignement et de
recherche français ou étrangers, des laboratoires
publics ou privés.
Faults in Linux: Ten Years Later
Nicolas Palix, Suman Saha, Gaël Thomas, Christophe Calvès, Julia Lawall,
Gilles Muller
To cite this version:
Nicolas Palix, Suman Saha, Gaël Thomas, Christophe Calvès, Julia Lawall, et al.. Faults in Linux:
Ten Years Later. [Research Report] RR-7357, INRIA. 2010, pp.21. �inria-00509256v2�
a p p o r t
d e r e c h e r c h e
0249-6399 ISRN INRIA/RR--7357--FR+ENG Domaine 3Faults in Linux: Ten Years Later
Nicolas Palix — Suman Saha — Gaël Thomas — Christophe Calvès — Julia Lawall —
Gilles Muller
N° 7357
Juillet 2010
Centre de recherche INRIA Paris – Rocquencourt
Nicolas Palix
∗, Suman Saha
†, Ga¨el Thomas
†, Christophe Calv`es
†, Julia Lawall
‡,
Gilles Muller
§Domaine 3 — R´eseaux, syst`emes et services, calcul distribu´e ´
Equipes-Projets R´egal
Rapport de recherche n° 7357 — Juillet 2010 — 18 pages
Abstract: In 2001, Chou et al. published a study of faults found by applying a static analyzer to Linux versions 1.0 through 2.4.1. A major result of their work was that the drivers directory contained up to 7 times more of certain kinds of faults than other directories. This result inspired a number of development and research efforts on improving the reliability of driver code. Today, however, Linux is used in a much wider range of environments, provides a much wider range of services, and has adopted a new development and release model. What has been the impact of these changes on code quality? Are drivers still a major problem?
To answer these questions, we have attempted to transport, based on the information provided, the experiments of Chou et al. to Linux versions 2.6.0 to 2.6.33, released between late 2003 and early 2010. We find that even if Linux has more than doubled in size during this period, the number of faults per line of code has been decreasing. And, even though drivers still accounts for a large part of the kernel code and contains the most faults, its fault rate is now below that of other directories, such as arch (HAL) and fs (file systems). Such information can guide further development and research efforts. To enable others to continually update the results as Linux evolves, we define our experimental protocol and make our checkers and results available in a public archive.
Key-words: Linux, Device drivers, Software quality, Static code analysis
∗DIKU, University of Copenhagen, Denmark [email protected] †LIP6-Regal {Firstname.Lastname}@lip6.fr
‡INRIA/LIP6-Regal, DIKU, University of Copenhagen, Denmark [email protected] §INRIA/LIP6-Regal, [email protected]
Fautes dans Linux : dix ans apr`es
R´esum´e : En 2001, Chou et al. ont publi´e une ´etude sur les fautes trouv´ees par analyse statique dans les versions 1.0 `a 2.4.1 de Linux. Un r´esultat majeur de cette ´etude est que le r´epertoire drivers contenait jusqu’`a 7 fois plus de fautes que d’autres r´epertoires. Ce r´esultat a inspir´e de nombreux travaux de recherche afin d’am´eliorer la fiabilit´e du code des pilotes. Toutefois, Linux est utilis´e `a l’heure actuelle dans des environnements plus vari´es, il fourni plus de services, et un nouveau mod`ele de d´eveloppement a ´et´e adopt´e. Quel sont l’impact de ces changements sur la qualit´e du code? Les pilotes sont ils toujours un probl`eme majeur?
Afin de r´epondre `a ces questions, nous avons entrepris de transposer les exp´eriences de Chou et al. aux versions de Linux 2.6.0 `a 2.6.33, parues entre fin 2003 et d´ebut 2010. Nous observons que mˆeme si la taille de Linux `a plus que doubl´ee durant cette p´eriode, le nombre de fautes par ligne de code a diminu´e. Mˆeme si les pilotes repr´esentent toujours une part importante du code du noyau et contiennent le plus de fautes, leur taux de fautes est maintenant inf´erieur `a celui d’autres r´epertoires, comme arch (couche d’abstraction mat´erielle) et fs (syst`emes de fichiers). De telles informations peuvent guider de nouveau travaux de recherche et d´eveloppement. Afin de permettre une mise `a jour de ces ces r´esultats par des tiers au fur et `a mesure de l’´evolution de Linux, nous d´efinissons notre protocole d’exp´erimentation et rendons nos outils de v´erifications ainsi que nos r´esultats disponibles dans une archive publique.
Mots-cl´es : Linux, Pilotes de p´eriph´eriques, Qualit´e logicielle, Analyse statique de programmes
1
Introduction
The Linux operating system is widely used, on platforms ranging from embedded systems, to personal comput-ers, to servers and supercomputers. As an operating system (OS) with a traditional monolithic kernel, Linux is responsible for the security and integrity of the inter-actions between software and the underlying hardware. Therefore, its correctness is essential. Linux also has a wide developer base, as it is open source, and is rapidly evolving. Thus, it is critical to be able to continually assess and control the quality of its code.
Almost 10 years ago, in 2001, Chou et al. published a seminal study of the distribution and lifetime of certain
types of faults1in OS code, focusing mostly on the x86
code in the Linux kernel [3]. The ability to collect this information automatically from such a large code base was revolutionary at the time, and this work has been highly influential. Indeed, their study has been cited over 360 times, according to Google Scholar, and has inspired the development of a whole series of strategies for automatically finding faults in systems code [1, 11, 22, 24, 26]. The reported statistics have been used for a variety of purposes, including providing evidence that driver code is unreliable [7, 23], and evidence that certain OS subsystems are more reliable than others [5].
Linux, however, has changed substantially since 2001, and thus the continued relevance of Chou et al.’s results may be questioned. In 2001, Linux was a relatively young OS, having first been released only 10 years earlier, and was primarily used by specialists. Today, well-supported Linux distributions are available, target-ing servers, embedded systems, and the general public [6, 25]. Only 30% of the Linux 2.6.33 code is more than
five years old.2 Linux now supports 23 architectures,
up from 13 in Linux 2001, and the developer base has grown commensurately. The development model has also changed substantially. Until Linux 2.6.0, which was released at the end of 2003, Linux releases were split into stable versions, which were installed by users, and development versions, which accommodated new fea-tures. Since Linux 2.6.0 this distinction has disappeared; releases occur every three months, and new features are made available whenever they are ready. Finally, a num-ber of fault finding tools have been developed that target
1Chou et al. used the terminology “errors.” In the software dependability literature [8], however, this term is reserved for incorrect states that occur during execution, rather than faults in the source code, as were investigated by Chou et al.and are investigated here.
2http://lwn.net/Articles/374574/, http://lwn.net/
Articles/374622/
Linux code. Patches are regularly submitted for faults found using checkpatch [2], Coccinelle [17], Coverity [4], smatch [24] and sparse [20].
Given the continual and rapid changes in the Linux kernel implementation, it is necessary to be able to con-tinually reevaluate the priorities for research and devel-opment involving the Linux kernel source code. Because Chou et al.’s fault finding tool and checkers were not released, and their results were released on a local web site but are no longer available, it is impossible for re-searchers or Linux developers to exactly reproduce their
results on recent versions of the Linux kernel.3 To
ad-dress this gap, we propose an experimental protocol based on the open source tools Coccinelle [17], for auto-matically finding faults in source code, and Herodotos [18], for tracking these faults across multiple versions of a software project. We validate this protocol by replicat-ing Chou et al.’s experiments as closely as possible on Linux 2.4.1 and then apply our protocol to all versions of Linux 2.6. To allow further research by others, our tools
and results are available in a public archival repository.4
The most important contributions of our work are as follows:
• We show that the faults kinds considered 10 years ago by Chou et al. are still relevant, because such faults are still being introduced, in both new and existing files.
• We show that while the rate of introduction of such faults continues to rise, the rate of their elimination is rising slightly faster, resulting in a kernel that is becoming more reliable with respect to these kinds of fault. This is in direct contrast with previous results for earlier versions of Linux which found that the number of faults was rising with the code size.
• We show that the rate of the considered fault kinds is falling in the drivers directory, which sug-gests that the work of Chou et al. and others has succeeded in directing attention to driver code. The directories arch (HAL) and fs (file systems) now show a higher fault rate, and thus it may be
worth-3Chou et al.’s work did lead to the development of the commercial tool Coverity, but using it requires signing an agreement not to publish informa-tion about its results (http://scan.coverity.com/policy.html-#license). Signing such a license is not acceptable to many open source developers or tool researchers.
4This information is available at http://hal.archives-ouvertes.fr on
the same page as this paper.
4 Palix, Saha, Thomas, Calv`es, Lawall and Muller
while to direct research efforts to the problems of such code.
• We show that the lifespan of faults in Linux 2.6 is comparable to that observed for previous versions, at slightly under 2 years. Nevertheless, we find that fault kinds that are more likely to have an visible im-pact during execution have a much shorter average lifespan, of as little as one year. The new develop-ment model, in which all releases are intended for users, means that users benefit immediately when a fault is fixed.
• We show that fault-finding tools are now being used regularly in Linux development, however, they have only had a small impact on the kinds of faults we consider. Research is thus needed on how such tools can be better integrated into the development process. We propose an experimental protocol that exploits previously collected information about false positives, reducing one of the burdens of tool use, but approaches are also needed to automate the fault fixing, not just the fault finding, process. The rest of this paper is organized as follows. Sec-tion 2 briefly presents our experimental protocol based on Coccinelle and Herodotos. Section 3 gives some back-ground on the evolution of Linux. Section 4 establishes a baseline for our results, by comparing our results for Linux 2.4.1 with those of Chou et al. Section 5 presents a study of Linux 2.6, considering the kinds of code that contain faults, the distribution of faults across Linux code, the lifetime of faults, and effect of the use of fault-finding tools. Section 6 considers how our experimental protocol eases the extension of the results to new ver-sions of Linux. Section 7 presents some limitations of our approach. Finally, Section 8 describes related work and Section 9 presents our conclusions.
2
Experimental protocol
In laboratory sciences there is a notion of experimental protocol, giving all of the information required to repro-duce an experiment. For a study of faults in operating systems code, such a protocol would include the defini-tion of the fault finding tools and checkers, as well as the strategies for identifying false positives, as each of these elements substantially affects the results. In this section, we first present our checkers and then describe
the tools that we have used in the fault finding and vali-dation process. The tools and checkers are available in
our long term public archive.4
2.1
Fault finding checkers
Based on the descriptions of Chou et al., we have im-plemented our interpretations of the Block, Null, Var Inull, Range, Lock, Intr, LockIntr, Float, and Size checkers. We omit the Real checker, related to the mis-use of realloc, and the Param checker, related to dereferences of user-level pointers, as in both cases, we did not have enough information to define checkers that found any faults. In the description of each checker, the initial citation in italics is the description provided by Chou et al.
Block “To avoid deadlock, do not call blocking
func-tions with interrupts disabled or a spinlock held.”
Imple-menting this checker requires knowing the set of func-tions that may block, the set of funcfunc-tions that disable interrupts, and the set of functions that take spinlocks. These functions vary across Linux versions. Identifying them precisely requires a full interprocedural analysis of the Linux kernel source code, including a precise alias analysis, as these operations may be performed via function pointers. To our knowledge, Chou et al.’s tool
xgccdid not provide these features in 2001, and thus
we assume that these functions were identified based on their examination of the source code and possibly heuris-tics for collecting functions with particular properties. We take the same approach, but add a simple interproce-dural analysis, based on the iterative computation of a transitive closure though the call graph.
To identify blocking functions, we consider two kinds of functions as the starting point of our interprocedural analysis. First, we observe that basic memory allocation functions, such as the kernel function kmalloc, often take as argument the constant GFP KERNEL when they are allowed to block until a page becomes available. Thus, we consider that a function that contains a call with GFP KERNEL as an argument may block. Second, we observe that blocking is directly caused by calling the function schedule. Given this initial list of blocking functions, we then iteratively augment the list with the names of functions that call functions already in the list without first explicitly releasing locks or turning on interrupts, until reaching a fixed point.
INRIA
To identify functions that turn off interrupts and take locks, we rely on our knowledge of a set of commonly used functions for these purposes, listed in the appendix.
Null “Check potentially NULL pointers returned from
routines.” To collect a list of the functions that may
return NULL, we followed the same iterative strategy as for the Block checker, with the starting point of the iteration being the set of functions that explicitly return NULL. Once the transitive closure is computed, we check the call sites of each collected function to determine whether the returned value is compared to NULL before it is used.
Var “Do not allocate large stack variables (> 1K) on
the fixed-size kernel stack.”Our checker looks for local
variables that are declared as large arrays, e.g., 1 024 or more elements for a char array.
Inull “Do not make inconsistent assumptions about
whether a pointer is NULL.”We distinguish two cases:
IsNull, where a null test on a pointer is followed by a dereference of the pointer, and NullRef, where a derefer-ence of a pointer is followed by a null test on the pointer. The former is always an error, while the latter may be an error or may simply indicate overly cautious code, if the pointer can never be NULL. Still, at least one NullRef fault has been shown to allow an attacker to obtain root
access.5
Range “Always check bounds of array indices and
loop bounds derived from user data.”We recognize the
functions memcpy fromfs, copy from user and
get useras giving access to user data. Possible faults
are cases where a value obtained using one of these functions is used as an array index, with no prior test on its value, and where some value is checked to be less than a value obtained using one of these functions, as would occur in validating a loop index.
Lock and Intr “Release acquired locks; do not
double-acquire locks (Lock).” “Restore disabled in-terrupts (Intr).” In early versions of Linux, locks and interrupts were managed separately: typically interrupts were disabled and reenabled using cli and sti, re-spectively, while locks were managed using operations on spinlocks or semaphores. In Linux 2.1.30, however,
5
http://grsecurity.net/˜spender/cheddar_bay.tgz.
functions such as spin lock irq were introduced to combine locking and interrupt management. Our Lock checker is limited to operators that only affect locks (spinlocks and, from Linux 2.6.16, mutexes), our Intr checker is limited to operators that only disable inter-rupts, and for the combined operations, we introduce a third checker, LockIntr. The locking functions are listed in the appendix.
Free “Do not use freed memory.” Like the Null
checker, this checker first iteratively collects functions that always apply kfree or some collected function to some parameter, and then checks each call to kfree or a collected function for a use of the freed argument after the call.
Float “Do not use floating point in the kernel.”Most
uses of floating point in kernel code are in computations that are performed by the compiler and then converted to an integer or in code that is part of the kernel source tree, but is not actually compiled into the kernel. Our checker only reports a floating point constant that is not a subterm of an arithmetic operation involving another constant.
Size “Allocate enough memory to hold the type for
which you are allocating.”Because our checker works
at the source code level, it is not aware of the sizes of the various data types. We consider two cases. In the first case, one of the basic memory allocation functions,
kmallocor kzalloc, is given a size argument
in-volving a sizeof expression defined in terms of a type that is different from the type of the variable storing the result of the allocation. To reduce the number of false positives, the checker ignores cases where one of the types involved represents only one byte, such as char, as these are often used for allocations of unstructured data. We consider as a fault any case where there is no clear relationship between the types, whether the al-located region is too large or too small. In the second case, there is an assignment where the right hand side involves taking the size of the left hand side expression itself, rather than the result of dereferencing that expres-sion. In this case, the allocated region has the size of a pointer, which is typically significantly smaller than the size intended.
These faults vary in how easy they are to find in the source code, how easy they are to fix once found, and
6 Palix, Saha, Thomas, Calv`es, Lawall and Muller
Find Fix Impact
Block Hard Hard Low
Null Hard Hard Low
Var Easy Easy Low
IsNull Easy Easy Low
NullRef Easy Hard Low
Range Easy Easy Low
Lock Easy Easy High
Intr Easy Easy High
LockIntr Easy Easy High
Free Hard Easy High
Size Easy Easy High
Float Easy Hard High
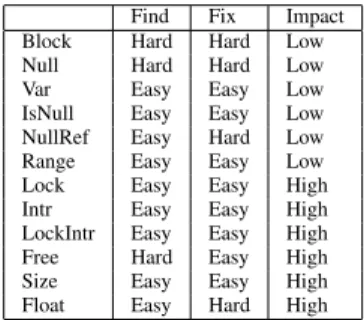
Table 1: Assessment of the difficulty of finding and fixing faults, and the potential of a fault to cause a crash or hang at runtime
the likelihood of a runtime impact. Table 1 summarizes these properties for the various fault types. Faults in-volving code within a single function are often easy for both maintainers and tools to detect, and thus we desig-nate these as “Easy.” Finding “Hard” faults requires an interprocedural analysis to identify functions that have specific properties. Interprocedural analysis requires more effort or expertise from a maintainer, or more com-plexity in a tool. Fixing a fault may require only an easy local change, as in Size, where the fix may require only changing the argument of sizeof to the type of the allocated value. On the other hand, cases that re-quire creating new error handling code, such as Null, or choosing between several alternative fixes (e.g., moving a dereference or dropping an unnecessary null test), such as NullRef, are more difficult. In particular, faults that entail more difficult fixes may benefit less from tools, as even when the fault is found the tool user may not have enough expertise to choose the correct fix. Finally, we indicate a low impact when a crash or hang is only likely in an exceptional condition, and high when it is likely in normal execution.
2.2
Relevant site finding rules
The maximum number of faults that code can contain is the number of occurrences of code relevant to the fault. For example, the number of Block faults is limited by the number of calls to blocking functions. We follow Chou et al. and refer to these occurrences of relevant code as notes.
We find the notes associated with each of our checkers as follows. For Block, Null, and Free, a note is a call to one of the functions collected as part of the transitive closure in the fault-finding process. For Var, a note is a
local array declaration. For Inull (IsNull and NullRef), a note is a null test of a value that is derefenced else-where in the same function. For Range and for Lock, Intr, or LockIntr, a note is a call to one of the user-level access functions or locking functions, respectively. For Size, a note is a use of sizeof as an argument to one of the basic memory allocation functions kmalloc or kzalloc when the argument is a type, or a use of
sizeofwhere the argument is an expression. In the
for-mer case, as for the checker, we discard some cases that are commonly false positives such as when the argument to sizeof is a one-byte type such as char. Finally, we do not calculate the number of notes for Float, be-cause we consider that every occurrence of a float in a context where it may be referenced in the compiled code is a fault, and thus the number of notes and faults is the same.
2.3
Tools
Our experimental protocol relies on two open-source tools: Coccinelle (v0.2.2), to automatically find faults and notes in the Linux kernels [17], and Herodotos (v0.6.0rc3), to correlate the fault reports between ver-sions [18]. To analyze the collected data, we use a Post-greSQL database (v8.4).
Coccinelle performs control-flow based pattern searches in C code. It provides a language, Semantic Patch Language (SmPL), for specifying searches and transformations and an engine for performing them. A notable feature of Coccinelle is that it does not expand preprocessor directives. Our fault-finding protocol thus covers code for all architectures, not only that of the host machine.
It is not sufficient to find potential faults in Linux code; we must also understand the history of fault occur-rences. To do so, we have to be able to correlate potential fault occurrences across multiple Linux versions, even in the presence of code changes in the files, and manage the identification of these occurrences as real faults and false positives. These functionalities are provided by Herodotos. To correlate fault occurrences, Herodotos first uses diff to find the changes in each pair of suc-cessive files for which Coccinelle has produced fault reports. If a pair of reports in these files occur in the unchanged part of the code, at corresponding lines, they are automatically considered to represent the same fault, with no user intervention. Otherwise, if at least one of a pair of reports occurs in the unchanged part of the code, then the reports are automatically considered to
INRIA
1994 1995 1996 1997 1998 1999 2000 2001 2002 2003 2004 2005 2006 2007 2008 2009 2010 0 2 4 6 8
Million lines of code
Other Drivers/Staging Arch
Drivers w/o Staging File Systems (FS) Net Sound 1.0 1.2.0 2.0 2.1.0 2.2.0 2.3.0 2.4.0 2.4.1 2.5.0 2.6.0 2.6.12 2.6.28
Figure 1: Linux directory sizes (in MLOC)
be unrelated. Finally, if both of a pair of reports occur in the changed part of the code, then their status is con-sidered to be unknown, and the user must indicate, via an interface based on the emacs “org” mode, whether they represent the same fault or unrelated ones. Once the correlation process is complete, a similar interface is provided to allow the user to classify each group of correlated reports as representing either a fault or a false positive.
Once the fault reports are correlated and assessed for false positives, we import their histories into the database, along with the associated notes. The database also contains information about Linux releases such as the release date and code size, and information about Linux files (size, number of modifications between re-leases) and functions (starting and ending line numbers), amounting to, in total, 1.5 GB of data. To analyze the col-lected data, we wrote more than 1 900 lines of PL/pgSQL and SQL queries that extract and correlate information.
Extending the results to new versions A benefit of
our experimental protocol is that it makes it quite easy to extend the results to a new version of Linux. When a new version of Linux is released, it is only necessary to run the checkers on the new code, and then repeat the correlation process. As our collected data contains infor-mation not only about the faults that we have identified, but also about the false positives, Herodotos automati-cally annotates both faults and false positives left over from previous versions as such, leaving only the new reports to be considered by the user.
3
Evolution of Linux
To give an overview of the software we are studying, we first consider the evolution in code size of the Linux kernel between version 1.0, released in March 1994, and
2004 2005 2006 2007 2008 2009 2010 -20 0 20 % increase Other Arch
Drivers with Staging File Systems (FS) Net Sound 2.6.2 2.6.5 2.6.10 2.6.13 2.6.14 (ieee802.11, DCCP) 2.6.16 (OCFS2, configfs) 2.6.19 (ecryptfs, jdb2, ext4, GFS2) 2.6.19 (OSS) 2.6.21 2.6.22 2.6.23 (OSS) 2.6.27 (HAL includes) 2.6.27 (HAL includes) 2.6.29 (Btrfs, Staging) 2.6.31
ieee802.11 : new wireless infrastructure DCCP : Datagram Congestion Control Protocol OCFS2 : second Oracle Cluster Filesystem JDB2 : Journaling layer for block devices GFS2 : Global File System Btrfs : B-tree file system
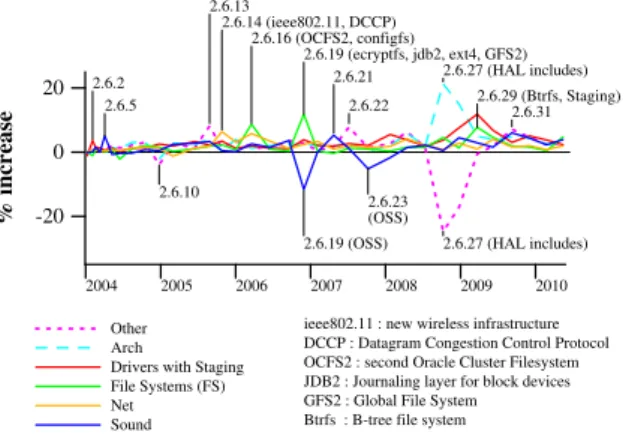
Figure 2: Linux directory size increase
version 2.6.33, released in February 2010, as shown in Figure 1. We give the size of the development versions, when available, as it is in these versions that new code is added, and this added code is then maintained in the subsequent stable versions. Code sizes are computed using David A. Wheeler’s ’SLOCCount’ (v2.26) [27] and include only the ANSI C code. The code sizes are broken down by directory, highlighting the largest di-rectories: drivers/staging, arch, drivers, fs (file systems), net, and sound. Drivers/staging was added in added in Linux 2.6.28 as an incubator for new drivers that are not yet mature enough to be used by end users. Code in drivers/staging is not compiled as part of the default Linux configuration, and is thus not included in standard Linux distributions.
Soundwas added in Linux 2.5.5, and contains sound
drivers that were previously in the drivers directory. The largest directory is drivers, which has made up 57% of the source code since Linux 2.6.29, excluding drivers/staging.
For most directories, the code growth has been roughly linear since Linux 1.0. Some exceptions are highlighted in Figure 2, which shows the percentage code size increase in each directory from one version to the next. We have marked some of the larger increases and decreases. Many of the increases involve the intro-duction of new services, such as new file systems. In Linux 2.6.19 and 2.6.23, old OSS drivers already sup-ported by ALSA were removed from sound, decreasing its code size. In Linux 2.6.27, arch was reorganized, and received some large header files from include, adding around 180 000 lines of C code to arch. Finally,
staginggrew substantially in 2.6.29. All in all, these
8 Palix, Saha, Thomas, Calv`es, Lawall and Muller 2004 2005 2006 2007 2008 2009 2010 0 10000 20000 30000 40000 # of notes Block Null Var IsNull / NullRef Range Lock Intr LockIntr Free Size 2.6.5 2.6.10 2.6.15 2.6.20 2.6.25 2.6.30
Figure 3: Notes through time per kind
changes have resulted in code growth from 2MLOC in 2001 to more than 8MLOC in 2010.
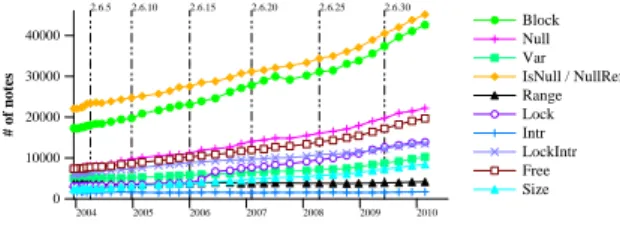
In our study, we are less interested in the absolute number of lines of code than the amount of code relevant to our fault kinds. As shown in Figure 3, the increase in code size has induced an almost linear increase in the number of notes. In fact, across all of Linux 2.6, the number of notes per line of code is essentially constant, between 0.027 and 0.030.
4
Linux 2.4.1
Linux 2.4.1 was the latest version of Linux considered by Chou et al. [3]. To validate our experimental protocol, we have used our checkers to find faults and notes in this version, and we compare our results to theirs. We focus on the results that are specific to Linux 2.4.1, rather than those that relate to the history of Linux up to that point, to avoid the need to study earlier versions that are of little relevance today.
4.1
What code is analyzed?
For the results of fault finding tools to be comparable, the tools must be applied to the same code base. Chou
et al.focus only on x86 code, finding that 70% of the
Linux 2.4.1 code is devoted to drivers. Nevertheless, we do not know which drivers, file systems, etc. were included. To calibrate our results, we use SLOCCount to obtain the number of lines of ANSI C code in the Linux kernel and in the drivers directory, considering three possibilities: all code in the Linux 2.4.1 kernel source tree (“All code”), the set of .c files compiled when using
the default x86 configuration (“Min x86”),6and all 2.4.1
code except the subdirectories of arch and include
6This configuration was automatically generated using make menuconfig without any modification of the proposed configuration. To collect the .c files, we compiled Linux 2.4.1 according to this configuration using a Debian 3.1 (Sarge) installation in a virtual machine, with gcc version 2.95.4 and make version 3.80.
that are specific to non-x86 architectures (“Max x86”). Max x86 gives a result that is closest to that of Chou et al., although the proportion of driver code is slightly higher than 70%. This is reasonable, because some drivers are associated with specific architectures and cannot be compiled for x86. Nevertheless, these results show that we do not know the precise set of files used in Chou et al.’s tests.
All code Min x86 Max x86
Drivers LOC 1,248,930 71,938 1,248,930
Total LOC 2,090,638 174,912 1,685,265
Drivers % 59% 41% 74%
Table 2: The percentage of Linux code found in
driverscalculated according to various strategies
In our experiments, we consider the entire kernel source code, and not just the code for x86, as every line of code can be assumed to be relevant to some user.
4.2
How many faults are there?
For the entire Linux 2.4.1 kernel, using the checkers de-scribed in Section 2.1, we obtain 625 reports, of which we have determined that 500 represent faults and the remainder represent false positives. Chou et al.’s check-ers find 1 025 faults in Linux 2.4.1. They have only checked 602 of these reports; the remainder are derived from low false positive checkers. We have checked all of the reports included in our study. Table 3 compares the number of faults found per checker. In most cases, we find fewer faults. This may be due to different defi-nitions of the checkers, or different criteria used when identifying false positives. Results from Chou et al.’s checkers were available at a web site, but this web site is no longer available, so it is not possible to determine the precise reasons for the differences. Chou et al.’s In-ull checker can be compared to our IsNIn-ull and NIn-ullRef checkers. We find fewer IsNull faults than their Inull faults, but far more NullRef faults. We also find slightly more Free faults. This may derive from considering a larger number of files, as we have found that only one of our Free faults occurs in a file that is compiled using the default x86 configuration.
4.3
Where are the faults?
Chou et al. find that the largest numbers of faults is in the
driversdirectory and that the largest number of these
faults are in the categories Block, Null, and Inull, with
INRIA
Checker Chou et al. Our results checked unchecked Block 206 87 71 Null 124 267 98 Var 33 69 18 Inull 69 0 N/A
IsNull N/A N/A 36
NullRef N/A N/A 221
Range 54 0 11
Lock 26 0 5
Intr 27 0 2
LockIntr N/A N/A 6
Free 17 0 21
Float 10 15 8
Size 3 0 3
Table 3: Comparative fault count
around 180, 95, and 50 faults, respectively.7As shown
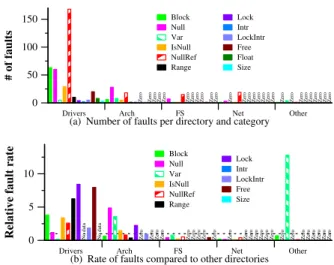
in Figure 4(a), we also observe that the largest number of faults is in the drivers directory, with the largest num-ber of these faults also being in Block, Null, and Inull (IsNull and NullRef), although in different proportions. A widely cited result of Chou et al. is that the drivers directory contains almost 7 times as many of a certain kind of faults (Lock) as all other directories combined. As shown in Figure 4(b), we obtain a similar result with a relative rate of over 8 for Lock in drivers. We fur-thermore find that the drivers directory has a rate of Free faults that is almost 8 times that of other directo-ries. Chou et al. found a fault rate of only around 1.75 times that of other directories in this case. With both approaches, however, the absolute number of Free faults is rather small. Like Chou et al., we also observe a high fault rate in the arch directory for the Null checker, in both cases about 4.8 times that of other directories. Finally, unlike Chou et al., we observe a high rate of Var faults in both arch and other.
4.4
How are faults distributed?
Chou et al. plot numbers of faults against the percentage of files containing each number of faults and find that for all of the checkers except Block, the resulting curve fits a log series distribution, with a θ value of 0.567 and a degree of confidence (p-value) as measured by the
χ2 test of 0.79 (79%). We observe a θ value of 0.581
and a p-value of 0.81 without Block, and a θ value of 0.631 and a p-value of 0.991 including Block. The latter degree of confidence is comparable to the highest degree of confidence observed by Chou et al. for any of the distributions they considered. We can thus confidently
7These numbers are approximated from the provided graphs.
Drivers Arch FS Net Other
0 50 100 150
# of faults
Zero Zero Zero Zero Zero Zero Zero Zero Zero Zero Zero Zero Zero Zero Zero Zero Zero Zero Zero Zero Zero Zero Zero Zero Zero Zero Zero Zero
Block Null Var IsNull NullRef Range Lock Intr LockIntr Free Float Size
(a) Number of faults per directory and category
Drivers Arch FS Net Other
0 5 10
Relative fault rate No data No data Zero ZeroZeroZero Zero ZeroZeroZero Zero Zero ZeroZeroZero ZeroZeroZero Zero Zero Zero ZeroZeroZeroZero Zero
Block Null Var IsNull NullRef Range Lock Intr LockIntr Free Size
(b) Rate of faults compared to other directories
Figure 4: Faults in Linux 2.4.1
consider that our faults follow a logarithmic distribution similar to that found by Chou et al., regardless of any differences in the checkers.
Chou et al. also find that younger files and larger functions have a higher fault rate, of up to 3% for the Null checker. We also find fault rates of around 3% for the Null checker, for files of all ages and for larger func-tions. Overall, we find no particular difference between younger and middle aged files, while the oldest files, with an average age of over 5 years, have a significantly lower fault rate. On the other hand, we find a definite increase in fault rate as function size increases.
4.5
Assessment
In this section, we have seen that our checkers find rather fewer faults than those of Chou et al. in Linux 2.4.1 code. Nevertheless, the distribution of these faults among the various directories is roughly comparable, and thus we conclude that our checkers are sufficient to provide a basis for comparison between Linux 2.6 and previous versions.
5
Linux 2.6 kernels
In this section, we assess the extent to which the trends observed for Linux 2.4.1 and previous versions continue to apply in Linux 2.6, and study the points of difficulty in kernel development today. We consider what has been the impact of the increasing code size and the addition
10 Palix, Saha, Thomas, Calv`es, Lawall and Muller
of new features on code quality, and whether drivers are still a major problem.
Concretely, we study a period of over 6 years, be-ginning with the release of Linux 2.6.0 at the end of 2003 and ending in early 2010 with the release of Linux 2.6.33. For the entire Linux 2.6 kernel, using the check-ers described in Section 2.1, we obtain 3 860 different reports (after correlation), of which we have determined that 2 322 represent faults and the rest represent false positives.
5.1
How many faults are there?
We first analyze the relation between the code growth and the total number of faults in Linux 2.6. As shown in Figure 5(a), the number of the considered faults has held roughly steady over this period, with an overall increase of only 5%, although there is a 20% increase between versions 2.6.28 and 2.6.30 in early 2009. This is quite remarkable given that the code size has more than doubled since Linux 2.6.0 (Figure 1). Indeed, the rate of faults per line of code has significantly decreased, by 51%, as shown in Figure 5(b). These observations are quite different from those for versions up through Linux 2.4.1: there was a code size increase of over 17 times between Linux 1.0 and Linux 2.4.1 and a corre-sponding increase in the number of the considered faults of over 33 times [3]. Figure 5(c) shows that faults are still introduced, indeed at a growing rate. But in most versions even more faults are eliminated.
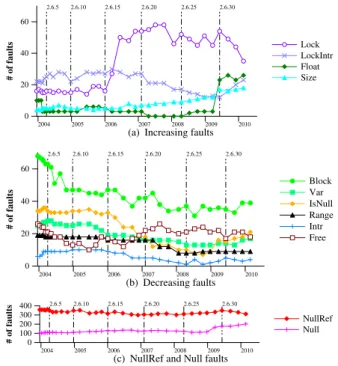
Figure 6 shows the number of each kind of fault found in Linux 2.6, separated for readability into those that have increased in number between the beginning and the end (Figure 6(a)) and those that have decreased in number in the same versions (Figure 6(b)). NullRef and Null are further separated from the others. For many fault kinds, the number of faults is essentially constant over the considered period.
Three notable exceptions to the stability in the number of Linux 2.6 faults are Lock, Null, and Float, in Linux 2.6.16 and 2.6.17, Linux 2.6.29, and Linux 2.6.30, re-spectively. In Linux 2.6.16, the functions mutex lock and mutex unlock were introduced to replace mutex-like occurrences of the semaphore functions down and up. 9 of the 11 Lock faults introduced in Linux 2.6.16 and 23 of the 24 Lock faults introduced in Linux 2.6.17 were in the use of mutex lock. In Linux 2.6.29, the file system btrfs was introduced, as seen in Figure 2. 31 Null faults were added with this code. 7 more Null faults were added in drivers/staging, which more
2004 2005 2006 2007 2008 2009 2010 0 200 400 600 800 # of faults 2.6.5 2.6.10 2.6.15 2.6.20 2.6.25 2.6.30 (a) Faults 2004 2005 2006 2007 2008 2009 2010 0.00 0.05 0.10 0.15 0.20 Faults per 1KLOC 2.6.5 2.6.10 2.6.15 2.6.20 2.6.25 2.6.30
(b) Fault density (Faults per 1KLOC)
2004 2005 2006 2007 2008 2009 2010 0 50 100 150 # of faults Elimination Introduction 2.6.5 2.6.10 2.6.15 2.6.20 2.6.25 2.6.30
(c) Introduction and elimination of faults
Figure 5: Faults in Linux 2.6.0 to 2.6.33
2004 2005 2006 2007 2008 2009 2010 0 20 40 60 # of faults Lock LockIntr Float Size 2.6.5 2.6.10 2.6.15 2.6.20 2.6.25 2.6.30
(a) Increasing faults
2004 2005 2006 2007 2008 2009 2010 0 20 40 60 # of faults Block Var IsNull Range Intr Free 2.6.5 2.6.10 2.6.15 2.6.20 2.6.25 2.6.30 (b) Decreasing faults 2004 2005 2006 2007 2008 2009 2010 0 100 200 300 400 # of faults NullRef Null 2.6.5 2.6.10 2.6.15 2.6.20 2.6.25 2.6.30
(c) NullRef and Null faults
Figure 6: Faults through time
than tripled in size at this time. 31 other Null faults were also added in this version. Finally, in Linux 2.6.30 there
INRIA
2004 2005 2006 2007 2008 2009 2010 0.0 0.5 1.0 1.5 % of faulty notes Average Block Null Var IsNull NullRef Range Lock Intr LockIntr Free Size 2.6.5 2.6.10 2.6.15 2.6.20 2.6.25 2.6.30
Figure 7: Fault rate per fault kind
2004 2005 2006 2007 2008 2009 2010 0 100 200 300 400 # of faults Staging Drivers Sound Arch FS Net Other 2.6.5 2.6.10 2.6.15 2.6.20 2.6.25 2.6.30
Figure 8: Faults per directory
was a substantial increase in the number of Comedi
drivers8in drivers/staging. All of the 21 Float
faults introduced in this version were in two Comedi files. These faults are still present in Linux 2.6.33. Re-call, however, that staging drivers are not included in Linux distributions.
As shown in Figure 7, the fault rate, i.e., the ratio
of observed faults to the number of notes,9for the
con-sidered fault kinds confirms the increase in reliability. As the number of notes increases roughly with the size of the Linux kernel while the number of faults is rela-tively stable, the fault rate tends to decline. The main in-creases, in Lock and Null, are due to the introduction of
mutex lockand btrfs, respectively, as mentioned
previously.
5.2
Where are the Faults?
The presence of a high rate of faults in a certain kind of code may signal a lack of code quality, indicating that this kind of code needs more attention. Indeed, Chou et al.’s work motivated studies of many kinds of driver faults, going beyond the fault kinds they considered. Nevertheless, many properties of the Linux kernel have changed since 2001, and so we reinvestigate what kind of
8http://www.comedi.org/
9Recall (Section 2.2) that we do not calculate notes for Float, and thus Float is omitted from the rate graphs.
2004 2005 2006 2007 2008 2009 2010 0.0 0.2 0.4 0.6 0.8 % of faulty notes Average Staging Drivers Sound Arch FS Net Other 2.6.5 2.6.10 2.6.15 2.6.20 2.6.25 2.6.30
Figure 9: Fault rate per directory
code has the highest rate of faults, to determine whether attention should now be placed elsewhere.
As shown in Figure 8, the largest number of faults is still in drivers, which indeed makes up around 57% of the Linux kernel source code. The second-largest number of faults is in arch, accompanied by fs and
drivers/staging in recent versions. In contrast
to the case of Linux 2.4.1, however, as shown in Fig-ure 9, drivers no longer has the largest fault rate, and indeed since Linux 2.6.19 its fault rate has been slightly below the average. There was not a large in-crease in the number of drivers notes at that time, so this decrease is indicative of the amount of attention drivers receive in the peer reviewing process. Arch on the other hand has many faults and relatively little code, and so it has the highest fault rate throughout most of Linux 2.6. Around 30% of the arch faults are Null faults, although there appears to be no pattern to their introduction. Drivers/staging, introduced in Linux 2.6.28, also has a high fault rate, exceeding that of arch. This directory is thus receiving drivers that are not yet mature, as intended. The introduction of drivers/staging, however, has no impact on the fault rate of drivers, as drivers/staging accommodates drivers that would not otherwise be ac-cepted into the Linux kernel source tree. Such drivers then benefit from the expertise of the Linux maintainers, and are updated according to API changes with the rest of the kernel.
For Linux 2.4.1, we observed that drivers had a much higher fault rate for certain types of faults than other directories. Figure 10 shows that drivers has a high rate of Intr faults in Linux 2.6.33 as compared to other directories, but there are very few such faults in this version. Sound, which was part of drivers in 2.4.1, has a very high rate of Range faults, as compared to the other directories, but again the actual number of faults is relatively small. Overall, while drivers has a high
12 Palix, Saha, Thomas, Calv`es, Lawall and Muller
Staging Drivers Sound Arch FS Net Other
0 2 4 6 8
Zero Zero Zero Zero Zero Zero Zero Zero Zero Zero Zero Zero Zero Zero Zero Zero Zero Zero Zero Zero Zero Zero Zero Zero Zero Zero
33.31 Block Null Var IsNull NullRef Range Lock Intr LockIntr Free Size
Figure 10: Fault rates compared to other directories
2004 2005 2006 2007 2008 2009 2010 1
2
Average faults per faulty file
Staging Drivers Sound Arch FS Net Other 2.6.5 2.6.10 2.6.15 2.6.20 2.6.25 2.6.30
Figure 11: Faults per faulty file per directory
rate as compared to other directories for some fault kinds, this is more common for staging, arch, and other, indicating again that the drivers that are intended for use in the Linux kernel are no longer the main source of faults.
Finally, in Figure 11, we consider the number of faults per file that contains at least one fault. The highest av-erage number of faults per faulty file is for fs in the versions prior to 2.6.12. In this case, there was a sin-gle file with many NullRef faults; as many as 45 in Linux 2.6.11. In later versions, the highest average is for drivers/staging, for which the average was over 2 in Linux 2.6.30. At that point, a large number of drivers had recently been introduced in this directory. Many of these faults have been corrected and the rate of entry of new drivers has slowed, and thus the average has dropped to around 1.5, close to that of other direc-tories. Sound had a relatively high number of faults per faulty file starting in Linux 2.6.16 with the intro-duction of mutex lock; faulty functions often contain more than one mutex lock, and thus a single omitted
mutex unlockmay result in multiple reports.
5.3
How long do Faults Live?
Eliminating a fault in Linux code is a three step process. First, the fault must be detected, either manually or using a tool. Then it must be corrected, and a patch submitted to the appropriate maintainers. Finally, the patch must
be accepted by a hierarchy of maintainers, until it is integrated into a release by Linus Torvalds. The lifespan of a fault is an indication of the efficiency of this process.
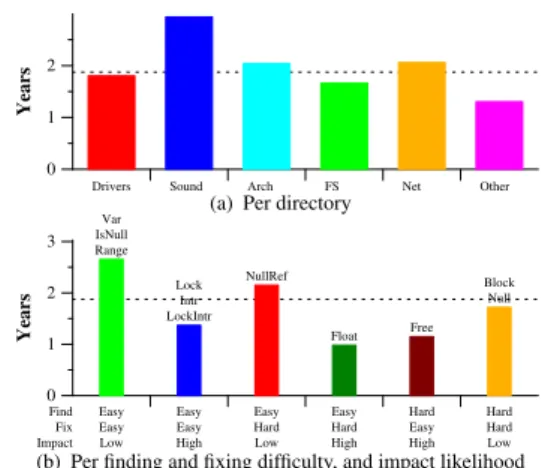
Fault lifespans Figure 12 presents the average
lifes-pan of faults across Linux 2.6, by directory and by fault kind. We omit drivers/staging because it was only introduced recently. Some faults were present be-fore Linux 2.6.0 and some faults were still present in Linux 2.6.33. For the average lifespan calculation, in the former case, we assume that the fault was introduced in Linux 2.6.0 and in the latter case, we assume that the fault was eliminated in Linux 2.6.34.
Drivers Sound Arch FS Net Other
0 1 2
Years
(a) Per directory
0 1 2 3 Years Find Fix Impact Easy Easy Low Easy Easy High Easy Hard Low Easy Hard High Hard Easy High Hard Hard Low Var IsNull Range Lock Intr LockIntr NullRef Float Free Block Null
(b) Per finding and fixing difficulty, and impact likelihood
Figure 12: Average fault lifespans (without staging)
The average fault lifespans vary somewhat by direc-tory. As shown in Figure 12(a), the average lifespan of faults in the drivers directory is less than the average lifespan of all faults, and indeed is less than the aver-age lifespan of faults in the sound, arch, and net directories. Sound faults now have the longest average lifespan. Sound used to be part of drivers; it may be that the sound drivers are no longer benefiting from the attention that other drivers receive.
For the fault kinds, Figure 12(b) shows that the aver-age lifespans correspond roughly to our assessment of the difficulty of finding and fixing the faults and their likelihood of impact (Table 1). In particular, all of the fault kinds we have designated as having high impact, meaning that the fault is likely to have an observable effect if the containing function is executed, are fixed relatively quickly. The ease of finding and fixing the faults has little impact on their lifespan, showing that
INRIA
developers are willing to invest in tracking down any faults that cause obvious problems.
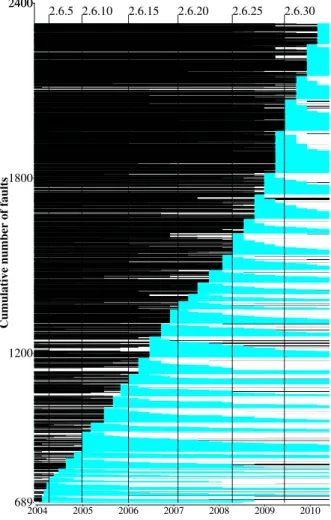
Origin of faults Figure 13 shows the lifetime of all
of the Linux 2.6 faults in our study, with Linux 2.6.1 at the bottom of the graph and Linux 2.6.33 at the top. The 689 faults in Linux 2.6.0 are omitted to save space; their lifetime within Linux 2.6 can be seen later as the leftmost curve in Figure 14, however, they may have been introduced earlier. In Figure 13, black lines indicate the period where the file containing the fault does not exist. Blue (grey) lines indicate the period where the fault is present. White lines indicate the period where the file is present but the fault is not. 37% of the faults introduced in or after Linux 2.6.1 were introduced with
the file.10 Similarly, 12% of the faults eliminated before
Linux 2.6.33 were eliminated with the file. For the faults in versions 2.6.0 and 2.6.33, the point of their introduction or elimination, respectively, is not within the period considered.
While we have seen that the total number of faults is essentially constant across the versions, Figure 13 shows that since Linux 2.6.27 a significantly larger number of faults have been introduced. Null and NullRef faults predominate, with for example 52% of the added faults in Linux 2.6.27 being NullRef faults, most of which were introduced in various drivers. In Linux 2.6.30 and Linux 2.6.32, 43% and 26% of the introduced faults were in drivers/staging. In each case, about half of the introduced faults were fixed within a few versions.
Figure 14 shows the number of faults in each version that are still present in each previous and successive ver-sion. The height and angle of all of the lines is fairly sim-ilar, except for the increase at Linux 2.6.29 and 2.6.30, as previously noted, indicating that the rate of introduc-tions and eliminaintroduc-tions of faults across the versions is relatively stable. These facts indicate a maturity in the Linux code and its development model.
Developer and maintainer activity In the Linux
de-velopment model, anyone (an author) can submit a patch, and the patch is then picked up by a maintainer, who
commitsit into his git repository that is then propagated
to Linus Torvalds. The number of patch authors is thus an indicator of the number of participants in the Linux development process, and the number of committers is an indicator of the amount of manpower that is available
10The degree to which this is visible depends on the image quality. It may be useful to print this page rather than view it on a screen.
2004 2005 2006 2007 2008 2009 2010 689 1200 1800 2400 2400
Cumulative number of faults
2.6.5 2.6.10 2.6.15 2.6.20 2.6.25 2.6.30
Figure 13: Lifetime of faults
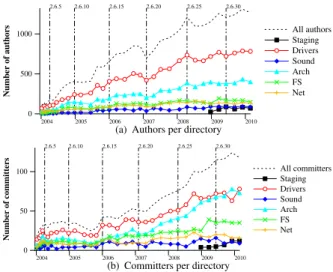
to begin the integration of patches into a release. Figure 15 shows the number of authors and committers associ-ated with the patches included in each version, both in total and broken down by directory.
For drivers, the numbers of authors and commit-ters are rising at the same rate, roughly at the rate of the increase in the code size. For arch and fs, however, where we have previously noted a higher fault rate, the number of authors is rising significantly more slowly than the number of committers. The lower number of authors may suggest that developers are not able to keep up with the number of new architectures and file systems (Figure 2). Finally, the small number of sound authors may explain the previously observed long life of sound faults (Figure 12(a)).
14 Palix, Saha, Thomas, Calv`es, Lawall and Muller 2004 2005 2006 2007 2008 2009 2010 0 200 400 600 # of faults Total v2.6.0 v2.6.1 v2.6.2 v2.6.3 v2.6.4 v2.6.5 v2.6.6 v2.6.7 v2.6.8 v2.6.9 v2.6.10 v2.6.11 v2.6.12 v2.6.13 v2.6.14 v2.6.15 v2.6.16 v2.6.17 v2.6.18 v2.6.19 v2.6.20 v2.6.21 v2.6.22 v2.6.23 v2.6.24 v2.6.25 v2.6.26 v2.6.27 v2.6.28 v2.6.29 v2.6.30 v2.6.31 v2.6.32 v2.6.33 2.6.5 2.6.10 2.6.15 2.6.20 2.6.25 2.6.30
Figure 14: Lifetime of faults across versions
2004 2005 2006 2007 2008 2009 2010 0 500 1000 Number of authors All authors Staging Drivers Sound Arch FS Net 2.6.5 2.6.10 2.6.15 2.6.20 2.6.25 2.6.30
(a) Authors per directory
2004 2005 2006 2007 2008 2009 2010 0 50 100 Number of committers All committers Staging Drivers Sound Arch FS Net 2.6.5 2.6.10 2.6.15 2.6.20 2.6.25 2.6.30
(b) Committers per directory
Figure 15: Authors and committers per version
Use of tools In principle, since the work of Chou et al.,
it has been possible to find all of the considered faults using tools. Figure 16 shows the number of patches in each Linux version that mention one of the fault-finding tools Coccinelle [17] (used in this paper), Coverity [4] (the commercial version of Chou et al.’s xgcc tool), sparse [20, 22], and smatch [24]. As developers are not obliged to mention the tools they use, these results may be an underestimation. Nevertheless, these results show that tools are being used regularly. As shown in Figure 5(c), many faults were eliminated in Linux 2.6.24, and we see a relatively large number of patches motivated
by the use of Coverity in this version. About half of these patches relate to the kinds of faults we consider, particularly Null, IsNull, NullRef, and Free. Overall, the results show a willingness on the part of the Linux developers to use fault-finding tools and to pay attention to the kinds of faults that they find. Finally, we observe that Coverity is relatively less referenced in recent years, suggesting a reluctance of open source developers to rely on closed source tools having restrictive licenses.
2006 2007 2008 2009 2010 0 50 100 150 Number of patches Coccinelle Coverity Smatch Sparse 2.6.12 2.6.15 2.6.20 2.6.25 2.6.30
Figure 16: Tool usage since the introduction of git
5.4
Is code quality predictable?
In the software engineering community substantial work has been done on identifying code metrics that predict code quality. We consider three possible metrics: code churn, file age, and function size. We also evaluate the quality of Linux code in light of the conjecture that open source code is more reliable because many people can see the code.
Churn Elbaum and Munson observed that code churn,
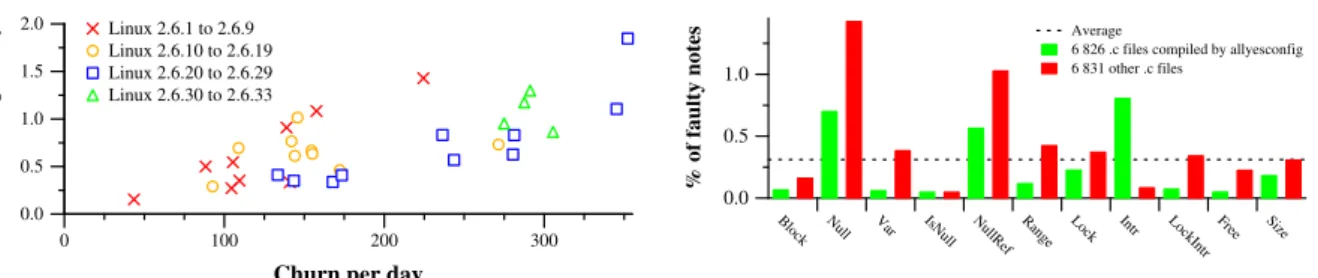
i.e., the number of times a file is modified, is a good predictor of fault rate [14]. Nagappan and Ball reached a similar conclusion in a study that used metrics re-lating to the development of Windows Server 2003 to predict SP1’s fault rate [15]. Figure 17 shows the rela-tionship between the average churn per day preceding each the release of each version and the number of the considered faults added in that version. The relation-ship between churn and fault rate is similar. There is an overall tendency of high-churn versions to contain more new faults, even if individual high-churn versions may have a smaller number of faults than lower churn versions. Recall, however, that in most versions, more faults were eliminated than added; the churn includes the elimination of faults as well.
Kernel configuration In “The Cathedral and the
Bazaar”[19], Eric S. Raymond formalized Linus’ law:
INRIA
0 100 200 300
Churn per day
0.0 0.5 1.0 1.5 2.0
New faults per day
Linux 2.6.1 to 2.6.9 Linux 2.6.10 to 2.6.19 Linux 2.6.20 to 2.6.29 Linux 2.6.30 to 2.6.33
Figure 17: Churn vs. new faults
“given enough eyeballs, all bugs are shallow.” But, in practice, code that is frequently executed, or at least frequently compiled, is more likely to be reviewed than the rest. When code is frequently executed, many users are likely to encounter any faults, and some may fix the faults themselves or submit a request that the faults be fixed by a kernel maintainer. When code is frequently compiled, even if it is not frequently executed, it can eas-ily be submitted to fault-finding tools that are integrated with the kernel compilation process. “Eyeballs” may also focus on faults in code that they are able to compile, as even standard compilers such as gcc perform some sanity checks that provide some confidence that a fix is correct, even if the code cannot be tested.
Figure 18 compares the number of faults found in the .c files that are compiled using the configuration generated on an x86 architecture by the Linux Make-file argument allyesconfig to the number of faults found in the .c files found in the rest of the Linux
ker-nel.11The Makefile argument allyesconfig creates
a configuration file that includes as many options as pos-sible without causing a conflict and without including drivers/staging. Thus, it can be assumed to trig-ger the compilation of a superset of what is normally included with a Linux distribution. In most cases, we do find that the allyesconfig files have a lower fault rate than the other files, as expected. The only exception is for Intr faults, but there are only 4 faults in total in this case.
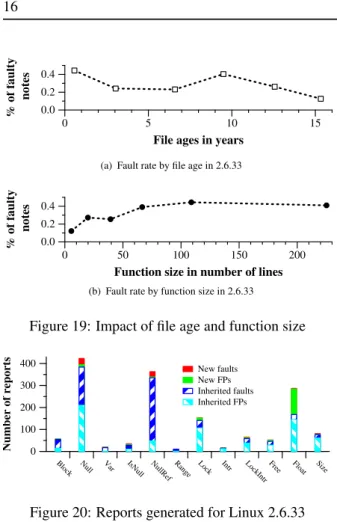
File age and function size One may expect that as
a file ages the number of faults would decrease, and that large functions would tend to harbor more faults. Indeed, Chou et al. found these trends in Linux 2.4.1, to a varying degree for the different fault kinds. Figure 19 considers the relationship between file age or function
11Compilation was done on an Ubuntu 10.04 (Lucid Lynx) installation with gcc4.4.3 and make 3.81.
Block Null Var IsNull NullRef Range Lock Intr LockIntr Free Size
0.0 0.5 1.0
% of faulty notes
Average
6 826 .c files compiled by allyesconfig 6 831 other .c files
Figure 18: Fault rate compared between configurations (2.6.33)
size and fault rate in Linux 2.6.33. Files and functions are organized by increasing age or size, respectively, then collected into buckets of exponentially decreasing age/size, from the smallest value to the largest. This strategy permits a fine degree of granularity for the files with smaller ages or sizes, respectively. Each graph then shows the average age or size of the files or functions in each bucket and their average fault rate.
Figure 19 shows that in Linux 2.6.33, the youngest half of the files, represented by the leftmost point accord-ing to the exponential bucketaccord-ing strategy, has a fault rate about twice that of the next youngest quarter of the files. For older files, however, the relation between age and fault rate is less clear, as the rate first increases and then decreases as the file age increases. On the other hand, the average fault rate clearly increases as the function size increases. Indeed, the bucket with the smallest func-tions, has a significantly lower fault rate than the next bucket. This suggests that larger functions may need more attention. As shown by our exponential bucketing strategy, most of these functions remain under 100 lines of code, meaning that it should be feasible to do this checking, either manually or using tools.
6
Processing New Versions
As presented in Section 2, the automatic report corre-lations provided by Herodotos make it easy to extend an existing set of results to the next version of Linux. For example, for the Block checker, suppose one starts with a set of already annotated reports for Linux versions 2.6.0 through Linux 2.6.32. For Linux 2.6.33, as shown in Figure 20, the checker produces 57 reports of potential faults of which 39 are faults inherited from Linux 2.6.32, and 15 are false positives also present in that version. Herodotos would annotate these reports automatically, leaving only three reports to be annotated by the user. In
16 Palix, Saha, Thomas, Calv`es, Lawall and Muller
0 5 10 15
File ages in years
0.0 0.2 0.4
% of faulty
notes
(a) Fault rate by file age in 2.6.33
0 50 100 150 200
Function size in number of lines
0.0 0.2 0.4
% of faulty
notes
(b) Fault rate by function size in 2.6.33
Figure 19: Impact of file age and function size
Block Null Var IsNull NullRef Range Lock Intr LockIntr Free Float Size
0 100 200 300 400 Number of reports New faults New FPs Inherited faults Inherited FPs
Figure 20: Reports generated for Linux 2.6.33
this case, all three are false positives. Overall, for Linux 2.6.33 there are 229 reports to consider. Over half of these are for Float, but most follow the same pattern, and can be dealt with in a few minutes.
7
Limitations
The main limitations of our work are in the choice of faults considered and the definition of the checkers. We have focused on the same kinds of faults as Chou et al., to be able to assess the changes in Linux since their work. Nevertheless, current checkers, including Coc-cinelle, consider other fault types, such as memory leaks. The considered set of faults also does not include concur-rency faults, which are becoming increasingly important with the prevalence of multicore architectures. Never-theless, a recent study of concurrency faults in infras-tructure software has shown that over 20% of deadlocks are caused by a thread reacquiring a resource it already holds [12], amounting to a double lock, as detected by our Lock checker.
Our checkers could also be improved to reduce the number of false positives. In particular, as we have seen for Float in Section 6, some kinds of false positives are due to recurring patterns specific to certain Linux files. Taking these patterns into account in the checkers would avoid generating large numbers of trivial false positive reports. Finally, we have tried to be conservative in our identification of real faults, and this may have lead to an underestimation of their number. By making our results available in a public archive, we hope to benefit from feedback from the Linux community to improve our classification strategies.
8
Related Work
Chou et al. briefly considered OpenBSD, as well as Linux [3]. Because of its wider use and more active development, we have focused only on Linux instead, comparing the properties of old and new versions.
Palix et al. have used Coccinelle to conduct a study of faults in versions of Linux and several other open source projects released between 2005 and 2009 [18]. They propose Herodotos, in order to correlate the faults between releases. They do not consider fault kinds re-quiring an interprocedural analysis, nor do they consider lock-related faults. As shown in Figure 6, these are among the most prevalent and also have high impact. Lawall et al. propose a methodology allowing to find interprocedural faults in Linux code, but consider only a single Linux version [10].
Israeli and Feitelson have studied 810 versions of the Linux kernel, from Linux 1.0 to Linux 2.6.25 [9]. They consider traditional source-code metrics to measure com-plexity [13] and maintainability [16], rather than actual numbers of faults. They find that the complexity per Linux function is decreasing, and the maintainability is increasing. Nevertheless, they do find that arch and
driversdo contain some very high complexity
func-tions, typically interrupt handlers or ioctl funcfunc-tions, and that arch and drivers code is somewhat less maintainable than the code in other parts of the kernel. Their work is complementary to ours, and reaches some of the same conclusions.
Song et al. have studied the reasons for software hangs in open source infrastructure software, such as MySQL and Apache [21]. They focus on bug reports rather than analysis of the source code. They find that most types of concurrency faults are fixed on average within 100 days. Nevertheless, they do not take into account the
INRIA
time elapsed between the introduction of the fault and the time when it was first detected, and so the actual fault lifetime may be more in line with what we have observed. Lu et al. also consider concurrency faults in infrastructure software, primarily focusing on the kinds of tools that would be helpful to address them [12].
9
Conclusion
During the last 10 years, much of the research in op-erating system reliability has been predicated on the assumption that drivers are the main problem. The ma-jor results of our study are first that drivers no longer have the highest fault rate in Linux kernel code, hav-ing been supplanted by the HAL, and second that even though faults are continually being introduced, the over-all code quality is improving. Our work thus shows the importance of being able to periodically repeat the study of faults in source code in order to revise research priori-ties as the fault patterns change in response to research efforts. Because the priorities of individuals and individ-ual institutions change over time, the need to repeat such studies implies that the tools and other data required must be available in an public archival repository.
Our study also shows that tools, while used, are under-exploited. Tools are indeed available to find all of the fault kinds considered in this paper. The fact that these kinds of faults remain and have a relatively long lifespan suggests that research is needed on how to design tools that are better integrated into the Linux development process. Another potential problem is the reactivity of maintainers. Indeed, some services have no maintainer, but remain in the kernel source tree. This may somewhat artificially increase the number of faults, however, any such faults can impact anyone who uses the code.
Our study has identified 723 faults in Linux 2.6.33, some of which have not yet been corrected in the current developer snapshot, linux-next. We are currently submitting patches based on our results.
References
[1] A. Aiken, S. Bugrara, I. Dillig, T. Dillig, B. Hack-ett, and P. Hawkins. An overview of the Saturn project. In Proceedings of the 7th ACM SIGPLAN-SIGSOFT Workshop on Program Analysis for Soft-ware Tools and Engineering, PASTE’07, pages 43– 48, San Diego, CA, June 2007.
[2] Checkpatch. http://www.codemonkey.
org.uk/projects/checkpatch/.
[3] A. Chou, J. Yang, B. Chelf, S. Hallem, and D. En-gler. An empirical study of operating systems errors. In Proceedings of the 18th ACM Sympo-sium on Operating System Principles, pages 73–88, Banff, Canada, Oct. 2001.
[4] Static source code analysis, static analysis, soft-ware quality tools by Coverity Inc. http://www. coverity.com/, 2008.
[5] A. Depoutovitch and M. Stumm. Otherworld – giving applications a chance to survive OS kernel crashes. In ACM EuroSys, pages 181–194, Paris, France, Apr. 2010.
[6] Fedora project, 2010. http://
fedoraproject.org/.
[7] J. N. Herder, H. Bos, B. Gras, P. Homburg, and A. S. Tanenbaum. Fault isolation for device drivers. In 2009 IEEE/IFIP International Conference on Dependable Systems and Networks (DSN), pages 33–42, Estoril, Portugal, June 2009.
[8] IEEE std 982.2-1988 IEEE guide for the use of IEEE standard dictionary of measures to produce reliable software, 1988.
[9] A. Israeli and D. G. Feitelson. The Linux kernel as a case study in software evolution. Journal of Systems and Software, 83(3):485–501, 2010. [10] J. L. Lawall, J. Brunel, R. R. Hansen, H. Stuart,
G. Muller, and N. Palix. WYSIWIB: A declarative approach to finding protocols and bugs in Linux code. In The 39th Annual IEEE/IFIP International Conference on Dependable Systems and Networks, pages 43–52, Estoril, Portugal, June 2009. [11] Z. Li and Y. Zhou. PR-Miner: automatically
ex-tracting implicit programming rules and detecting violations in large software code. In Proceedings of the 10th European Software Engineering Confer-ence held jointly with 13th ACM SIGSOFT Interna-tional Symposium on Foundations of Software En-gineering, pages 306–315, Lisbon, Portugal, Sept. 2005.
[12] S. Lu, S. Park, E. Seo, and Y. Zhou. Learning from mistakes: a comprehensive study on real world
18 Palix, Saha, Thomas, Calv`es, Lawall and Muller
concurrency bug characteristics. In Architectural Support for Programming Languages and Oper-ating Systems (ASPLOS), pages 329–339, Seattle, WA, USA, Mar. 2008.
[13] T. J. McCabe. A complexity measure. IEEE Trans-actions on Software Engineering, 2(4):308–320, July 1976.
[14] J. C. Munson and S. G. Elbaum. Code churn: A measure for estimating the impact of code change. In International Conference Software Maintenance (ICSM), pages 24–31, 1998.
[15] N. Nagappan and T. Ball. Use of relative code churn measures to predict system defect density. In 27th International Conference on Software En-gineering (ICSE), pages 284–292, St. Louis, Mis-souri, USA, May 2005.
[16] P. Oman and J. Hagemeister. Construction and testing of polynomials predicting software
main-tainability. Journal of Systems and Software,
24(3):251–266, 1994.
[17] Y. Padioleau, J. Lawall, R. R. Hansen, and G. Muller. Documenting and automating collat-eral evolutions in Linux device drivers. In Eu-roSys 2008, pages 247–260, Glasgow, Scotland, Mar. 2008.
[18] N. Palix, J. Lawall, and G. Muller. Tracking
code patterns over multiple software versions with Herodotos. In Proc. of the ACM International Con-ference on Aspect-Oriented Software Development, AOSD’10, pages 169–180, Rennes and Saint Malo, France, Mar. 2010.
[19] E. S. Raymond. The Cathedral and the Bazaar: Musings on Linux and Open Source by an Acci-dental Revolutionary. O’Reilly & Associates, Inc., 2001.
[20] D. Searls. Sparse, Linus & the Lunatics, Nov. 2004. Available at http://www.linuxjournal. com/article/7272.
[21] X. Song, H. Chen, and B. Zang. Why software hangs and what can be done with it. In Interna-tional Conference on Dependable Systems and Net-works (DSN 2010), Chicago, IL, USA, June 2010.
[22] Sparse. https://sparse.wiki.kernel.
org/index.php/Main_Page.
[23] M. M. Swift, M. Annamalai, B. N. Bershad, and H. M. Levy. Recovering device drivers. ACM Transactions on Computer Systems, 24(4):333– 360, 2006.
[24] The Kernel Janitors. Smatch, the source
matcher, 2010. Available at http://smatch. sourceforge.net.
[25] Ubuntu, 2010. http://www.ubuntu.com/.
[26] D. Wheeler. Flawfinder home page. Web
page: http://www.dwheeler.com/ flawfinder/, Oct. 2006. [27] D. A. Wheeler. SLOCCount. http://www. dwheeler.com/sloccount/.
Appendix
Locking functions: {mutex,spin,read,write} lock, {mutex,spin,read,write} trylockInterrupt disabling functions: cli, local irq disable Functions combining both:
{read,write,spin} lock irq,
{read,write,spin} lock irqsave, local irq save, save and cli
INRIA
Centre de recherche INRIA Paris – Rocquencourt
Domaine de Voluceau - Rocquencourt - BP 105 - 78153 Le Chesnay Cedex (France)
Centre de recherche INRIA Bordeaux – Sud Ouest : Domaine Universitaire - 351, cours de la Libération - 33405 Talence Cedex Centre de recherche INRIA Grenoble – Rhône-Alpes : 655, avenue de l’Europe - 38334 Montbonnot Saint-Ismier Centre de recherche INRIA Lille – Nord Europe : Parc Scientifique de la Haute Borne - 40, avenue Halley - 59650 Villeneuve d’Ascq
Centre de recherche INRIA Nancy – Grand Est : LORIA, Technopôle de Nancy-Brabois - Campus scientifique 615, rue du Jardin Botanique - BP 101 - 54602 Villers-lès-Nancy Cedex
Centre de recherche INRIA Rennes – Bretagne Atlantique : IRISA, Campus universitaire de Beaulieu - 35042 Rennes Cedex Centre de recherche INRIA Saclay – Île-de-France : Parc Orsay Université - ZAC des Vignes : 4, rue Jacques Monod - 91893 Orsay Cedex
Centre de recherche INRIA Sophia Antipolis – Méditerranée : 2004, route des Lucioles - BP 93 - 06902 Sophia Antipolis Cedex
Éditeur
INRIA - Domaine de Voluceau - Rocquencourt, BP 105 - 78153 Le Chesnay Cedex (France)