HAL Id: hal-02980442
https://hal.archives-ouvertes.fr/hal-02980442
Preprint submitted on 27 Oct 2020HAL is a multi-disciplinary open access
archive for the deposit and dissemination of sci-entific research documents, whether they are pub-lished or not. The documents may come from teaching and research institutions in France or abroad, or from public or private research centers.
L’archive ouverte pluridisciplinaire HAL, est destinée au dépôt et à la diffusion de documents scientifiques de niveau recherche, publiés ou non, émanant des établissements d’enseignement et de recherche français ou étrangers, des laboratoires publics ou privés.
A unified physiological framework of transitions between
seizures, status epilepticus and depolarization block at
the single neuron level
Damien Depannemaecker, Anton Ivanov, Davide Lillo, Len Spek, Christophe
Bernard, Viktor Jirsa
To cite this version:
Damien Depannemaecker, Anton Ivanov, Davide Lillo, Len Spek, Christophe Bernard, et al.. A unified physiological framework of transitions between seizures, status epilepticus and depolarization block at the single neuron level. 2020. �hal-02980442�
1
Full title: A unified physiological framework of transitions between seizures, status epilepticus
and depolarization block at the single neuron level
Short Title: Dynamics of pathologic behaviors at single neuron level
Authors: Damien Depannemaecker1,2,°,✉, Anton Ivanov1, Davide Lillo1, Len Spek1,#,
Christophe Bernard1,*, and Viktor Jirsa1,*
Affiliations: 1Aix Marseille Univ, INSERM, INS, Institut des Neurosciences des Systèmes,
Marseille, France, 2Disciplina de Neurociência, Departamento de Neurologia e Neurocirurgia,
Universidade de Federal de São Paulo, São Paulo, Brazil.
*equally contributing last authors
actual addresses:
°Department of Integrative and Computational Neuroscience, Institut Neuro -PSI, CNRS, Gif-sur-Yvette, France
#Department of Applied Mathematics, University of Twente, Enschede, The Netherlands
✉ damien.d@cnrs.fr
Abstract
The majority of seizures recorded in humans and experimental animal models can be described by a generic phenomenological mathematical model, The Epileptor. In this model, seizure-like events (SLEs) are driven by a slow variable and occur via saddle node (SN) and homoclinic bifurcations at seizure onset and offset, respectively. Here we investigated SLEs at the single cell level using a biophysically relevant neuron model including a slow/fast system of four equations. The two equations for the slow subsystem describe ion concentration variations and the two equations of the fast subsystem delineate the electrophysiological activities of the neuron. Using extracellular K+ as a slow variable, we report that SLEs with
SN/homoclinic bifurcations can readily occur at the single cell level when extracellular K+
reaches a critical value. In patients and experimental models, seizures can also evolve into status epilepticus (SE) and depolarization block (DB), activities which are also parts of the dynamic repertoire of the Epileptor. Increasing extracellular concentration of K+ in the model to
values found during experimental SE and DB, we show that SE-like events and DB can also occur at the single cell level. Thus, seizures, SE and DB, which have been first identified as network events, can exist in a unified framework of a biophysical model at the single neuron level and exhibit similar dynamics as observed in the Epileptor.
2
Author Summary
Epilepsy is a neurological disorder characterized by the occurrence of seizures. Seizures have been characterized in patients in experimental models at both macroscopic and microscopic scales using electrophysiological recordings. Experimental works allowed the establishment of a detailed taxonomy of seizures, which can be described by mathematical models. We can distinguish two main types of models. Phenomenological (generic) models have few parameters and variables and permit detailed dynamical studies often capturing a majority of activities observed in experimental conditions. But they also have abstract parameters, making biological interpretation difficult. Biophysical models, on the other hand, use a large number of variables and parameters due to the complexity of the biological systems they represent. Because of the multiplicity of solutions, it is difficult to extract general dynamical rules. In the present work, we integrate both approaches and reduce a detailed biophysical model to sufficiently low-dimensional equations, and thus maintaining the advantages of a generic model. We propose, at the single cell level, a unified framework of different pathological activities that are seizures, depolarization block, and status epilepticus.
Introduction
Seizures are part of the repertoire of built-in activities of neuronal networks as they can be triggered in most brain regions from most species [1]. Several conceptual frameworks have been proposed to explain seizure dynamics [2–8]. The predominant framework assumes that the majority of seizure onsets and offsets correspond to bifurcations in the electrophysical variables [1,9], although there exist other non-bifurcation types [10]. This framework has been generalized by Saggio and col. [11,12]. A phenomenological mathematical model, called The Epileptor, describes the dynamics of a majority of seizures recorded in drug-resistant patients, and most seizures recorded in experimental models [1,12]. A qualitative analysis of the Epileptor reveals that seizures, SE and DB co-exist, and that multiple types of transitions from
3
one type of activity to the other are possible, as verified experimentally [11,13,14]. Since it is phenomenological, the Epileptor model does not provide direct insight regarding underlying biophysical mechanisms. The phenomenological model imposes strong constrains in terms of dynamics. Numerous neuronal network models, including biophysically realistic ones, have been developed to study seizures, SE or DB mechanisms [2,4,15–21]. These models contain too many parameters to perform a detailed bifurcation analysis, thus preventing bridging the gap between phenomenological and biophysical approaches. However, with the guidance of phenomenological modeling, design of neuronal spiking network including several biophysical features has been performed [3]. In this work, transitions between states of the neuronal network are ensured by slow variable representing extracellular environmental fluctuation.
Although seizures and DB are generally observed at the neuronal network scale, their dynamical equivalence can be found at the single cell level [22–29], which can be used to study human epilepsy [30–32]. Moreover, previous works [3,33,34] show that dynamical features are preserved when going from the network to the single cell level. It therefore seems appropriate to consider a biophysical model at the single cell scale exhibiting dynamic properties identified in the generic model and in which the transitions between the different states are provided by a slow variable describing the variations within the extracellular milieu. Bursting activity in neurons can be described in terms of bifurcations [35,36], and different single cell biophysical models have been proposed, which can model SLE and DB, but not SE-like events [22,25,26,29,37–41], although, to the best of our knowledge, these activities have not been observed experimentally in isolated neurons. They are slow/fast systems, where a slow subsystem drives the fast subsystem between different states. In such models, the studied fast subsystem delineates the neuronal membrane electrophysiological activities. The slow subsystem can be represented by variations of different slow variables including ion concentration [22,25,26,29,37–40], oxygen level [38,42], volume [37,40] and interaction with glial cells [29,40]. These models provide mechanistic insights, in particular how the slow variable influences neuronal activity, including the transitions from “healthy” regimes to
4
“pathological” ones like SLEs and DB. However, none of these models, including the extracellular slow variations, could be reduced to four variables, while presenting a bursting pattern corresponding to the most common ones encountered at the network level, i.e. the SN/homoclinic pair [1]. Since SLEs, SE and DB pertain to the dynamic repertoire of The Epileptor and of biological neuronal networks [11,13], biophysical models should be able to reproduce all three types of activities. The goal of the present study is to identify candidate mechanisms from physiology robustly leading to the time scale separation and trajectories in SLEs. We will take guidance from the careful dynamic analyses performed in previous works.
In generic models, the dynamics is well understood [1,11] but these models rarely offer direct biophysical insight as they use abstract parameters. Important works have been done to understand the link between phenomenological and biophysical models [3,43]. In order to explore the dynamics repertoire, the high dimensionality of detailed biophysical models must be reduced. A minimal model of interictal and SLEs has been introduced as Epileptor-2, using increase in [K]o to trigger burst discharges and restoration of the K+ gradient via the
sodium-potassium pump to stop SLEs [22]. The work of Saggio et al. [11] is a generalization of the dynamics found in Epileptor and Epileptor-2. However, Epileptor-2 does not produce the SN/homoclinic bifurcation consistently found experimentally, and the model does not generate SE or DB. Moreover, when the fast discharges stop, the slow variables of Epileptor-2 continue oscillating, whereas that of Epileptor 1 do not. This can be understood on the basis of the results of Saggio et al.[11]. In the present reduction, we used a Hodgkin-Huxley-like single cell model, and we imposed several constraints: SLE, SE and DB [13], as well as the SN/homoclinic bifurcation must be present. We have thus generated a minimal slow/fast system preserving biophysical representation and satisfying these constraints. A variable acting on a slow time scale is necessary to drive the system through different activities (e.g. from SLE to DB). In a cell, numerous processes can occur on a slow time scale and act as a slow variable, including changes in ion concentration, metabolism, phosphorylation levels, and transcription. Ion homeostasis regulation is critical to maintaining neuron function, and many
5
sub-cellular mechanisms are involved in this process [44]. Fluctuations of ion concentrations in the extracellular space modulate the electrophysiological activity of a single neuron [26,42]. The present work focuses on extracellular potassium ([K]o) concentration because it increases
during seizures [45–49], even in the absence of synaptic activities [50,51]. Augmentation of [K]o is also observed in head injury [52,53], which can be a starting point for epilepsy [54].
Computational simulations show that potassium could be responsible for local synchronization [55] and is an important parameter in neural dynamics [26,39,41,42]. In addition, in experimental models, the transition to DB correlates with a much larger increase of [K]o as
compared to SLEs [13,56]. We here consider the slow modulatory effects of [K]o variations. In
our model, the slow sub-system describes ionic concentration variations. The fast subsystem characterizes the dynamics of trans-membrane ion flows through voltage-gated and the sodium-potassium pump, and so allows tracing the membrane potential. We report that this single cell model accounts for the SN/homoclinic bifurcation pair and that it reproduces SLEs, SE and DB, reproducing patterns found in single neurons recorded experimentally during seizures.
Results
Our goal was to construct a biophysical single neuron model that can reproduce the different firing patterns recorded when extracellular potassium is experimentally increased, while keeping it sufficiently simple to allow a bifurcation analysis. The model is schematized in Fig.1 (see methods section for the equations). It is a simplification of the classical Hodgkin-Huxley formalism, which includes three compartments (external bath, extracellular space, intracellular space).
6
Figure 1: Diagram of characteristics and mechanisms described by the model. Three
compartments are represented. A passive diffusion of potassium exists between the external bath and the extracellular space. Na+, K+ and Cl- ions can be exchanged between the
extracellular and intracellular compartments via the Na/K-pump and voltage-gated channels. This model can reproduce the typical patterns of the membrane potential Vm,shown in the
bottom left subplot, including tonic firing, bursting, seizure like events (SLE), status epilepticus (SE) and depolarization block (DB).
Numerous experiments show that seizures and SLEs are associated with an increase in [K]o [45,47] and that increasing of external [K]can trigger SLEs [57,58]. The model presented
here takes into account the regulation of potassium, via the possible diffusion towards the external bath compartment and its associated potassium concentration [K]bath. Changing [K]bath
7
the removal of excess potassium from the extracellular compartment. When [K]bath is low, the
bath compartment can pump out the extracellular potassium; but it fails to do so when it is saturated by potassium. We thus explored the response of the model as the concentration of [K]bath was increased. The gradual increase in potassium led to 7 sequential qualitative firing
patterns: Resting State (RS), Spike Train (ST), Tonic Spiking (TS), Bursting, seizure like events (SLE), status epilepticus (SE)-like event, and Depolarization Block (DB). The corresponding changes of membrane potential for all these patterns are shown in Fig.2.
The number of firing patterns is higher than in the original Hodgkin-Huxley model. This is due to the fact that the model takes into account the variations of concentration, as evidenced by the variation of the Nernst potentials. The changes in Nernst potentials for sodium and potassium ion species are shown in Fig.2. In some cases, the Nernst potentials display a transient change before reaching a steady-state, as observed during RS, TS, SE-like event and DB. During periodic events, (ST, Bursting, SLE), oscillations are observed in Nernst potentials. These oscillations are directly linked to the observed oscillations in the slow variables of the model (Eq.(3) and Eq.(4)) describing concentration changes. The rate of oscillation of the slow variables thus explain the duration of periodic events, in line with the assumed essential role of ionic homeostatic regulation.
Each of the firing patterns can be associated to a different behavior, observable experimentally at different scales. The correspondence is established on the basis of their shape and their order of appearance as [K]bath is increased. Tonic and bursting patterns are
prototypical. We consider the activity shown on Fig. 2d as SLE at the neuronal scale, as it is similar to the activity typically recorded in individual neurons [59], in particular the transient episode of depolarization block, in different experimental preparations during SLEs at the network scale (e.g. Fig. 6 in [60]; Fig. 1 in [23] or Fig. 8 in [1]). Although it is possible to generate SE-like events in vitro [61], the corresponding intracellular activity is not known, however the sustained firing pattern in the model cell resembles the regular field activity recorded during SE-like events in vitro [61]. The sustained DB at the single cell level corresponds to what is
8
observed experimentally during network spreading depolarization when [K]o reaches high
levels [62].
Increasing [K]bath leads to different regimes of variation of external potassium (Fig.3).
These different regimes are associated with a specific dynamic (i.e. type of bifurcation) of the excitability of the membrane. It is therefore possible to link the membrane potential to the variations in extracellular potassium, because of exchanges existing between compartments (i.e. via the slow variable), as shown in Fig.4. In the next subsection, we detailed these dynamical interactions for the different patterns of activity, following the order of appearance when [K]bath increase.
9
Figure 2: qualitative mode of behavior of the membrane potential and Nernst potentials.
In blue: time series of the membrane potential Vm for the following patterns of activity: (a) Spike
train, (b) Tonic spiking (TS), (c) Bursting, (d) Seizure-like event (SLE), (e) Status epilepticus (SE)-like event, (f) Depolarization Block (DB). In red: Nernst potential of sodium, in green: Nernst potential of potassium with specific Y axis on the right side. If the value of [K]bath stays
below 6 mM, the system remains in resting state around -72 mV. Specific patterns of activities start to appear with a diminution of the Nernst potential of sodium and an increase of the Nernst potential of potassium. When periodic events are occurring (panels c and d), oscillations can also be observed in the Nernst potential of both ions.
10
Resting states, spike train and tonic spiking in low [K]bath
Resting state is found when [K]bath is around the normal value of [K]o (called [K]0,o , see
Methods section). If [K]bath is smaller than [K]0,o the membrane potential slowly hyperpolarizes,
due to a diffusion of potassium in the direction of the external bath. When [K]bath slightly
increases (> 7 mM), ST appears through a SNIC bifurcation. The offset is also a SNIC bifurcation. In this case, the onset and offset bifurcations can be easily identified by their characteristic features [11], and confirmed by numerical methods (using SymPy [63] and SciPy [64] libraries). With higher value of [K]bath (> 8 mM), TS occurs. In this condition, [K]o stabilizes
(Fig.3), and the neuron fires at a constant frequency (Fig. 2b). The occurrence of regular spiking due to an increase of [K]o through diffusion from the bath is consistent with experiments
[29].
Figure 3: Variation of extracellular potassium concentration as a function of [K]bath. Minimal and maximal external potassium [K]o and mean (dash line) concentration observed
during simulations done for different values of the parameter [K]bath. Due to diffusion from the
external bath, increasing [K]bath leads to variations in [K]o. Different patterns are observed for
each range of [K]bath: (a) resting state, (b) spike train, (c) regular spiking, (d) burst, (e) seizure
like event, (f) status epilepticus like event, (g) depolarization block. The periodic events (spike train, burst and seizure-like event) correspond to the range of [K]bath where [K]o periodically
11
Bursting and Seizure-like events
Bi-stable behavior occurs when the slow system starts to oscillate when [K]bath is further
increased. The model (with parameters listed in Table 1) displays bursting and SLE, successively. Bursts are square-wave bursts (SN/Homoclinic bifurcations) and SLEs also show SN and Homoclinic bifurcations at onset and offset, respectively (See supplementary information: S1, S2, S3, S4). Here, the slow subsystem oscillates in a self-sustained manner (Fig. 4a-f), generating recurrent bursting or SLEs, with important variations of [K]o, due to
oscillations in the slow subsystem. The combined effects of oscillations of ∆[K]I and [K]g explain
the changes in the Nernst potential of potassium (and sodium, which is linked to potassium in the model), thus changing neural excitability. During spiking activity, voltage-gated potassium channels open increasing potassium current IK. The influence of IK in the equation of ∆[K]I
(eq.3), explains the decrease of ∆[K]I,hence the increase of [K]o through equations (eq.16) and
(eq.20). This is consistent with the observations described in [45]. The increase in [K]o starts
with the occurrence of burst and SLEs. Thus, it is not the cause of the event but a consequence of homeostasis dysregulation (i.e. augmentation of [K]bath).
13
Figure 4: Time series of membrane potential, ∆[K]i, [K]g, and [K]o. obtained thanks to
numerical methods using SciPy library [64], x-axis in millisecond. (a) spike train with [K]bath =
7.5 mM, (b) spike train with [K]bath = 7.5 mM and γ = 0.04, ε= 0.002, (c) Burst with [K]bath = 12.5
mM, (d) Burst with [K]bath = 12.5 mM, and γ = 0.06, ε = 0.002, (e) SLE with [K]bath = 16 mM, (f)
SLE with [K]bath = 16 mM and γ = 0.08, ε = 0.0008, (g) SE with [K]bath = 17.5 mM, (h) DB with
[K]bath = 20 mM. If not specified, the parameter values used here are the reference parameters
described in the method section. Variations of ∆[K]I and [K]g induce different patterns of activity.
The combined effects lead to the observed variations in [K]o. The time scale of the slow
variables γ and ε influence the shape of Vm allowing the system to exhibit SN or SNIC
bifurcation at the onset of the events.
Steady states, SE-like events and DB, in high [K]bath conditions
SE-like events (Fig. 2g) appears for [K]bath around 17.5 mM (Figs. 3 & 4), i.e. above the
threshold value for SLEs as reported experimentally [13]. If no other mechanisms act to stop it, these oscillations remain constant (analogous to refractory status epilepticus). Permanent DB occurs for even higher values of [K]bath (> 18.0 mM, Fig. 3) as also reported experimentally
[13]. In these cases, after a peak value (Fig. 4h), [K]o stabilizes, explaining the short range of
variation (Fig. 3). These steady-states start like a SLEs (Fig. 2e and 2f), then the slow variables stabilize and [K]o remains constant at a high value (Figs. 4g-h).
We conclude that the model behaves as expected from the biological observations, when experimentally increasing of [K]bath. These simulations were obtained when using a
“healthy” situation, i.e. as if recording a “control” neuron. In the next section, we model a "pathological" situation for which where the regulatory mechanisms of neuronal homeostasis are affected.
Influence of other parameters
We then aimed to identify relevant parameters that could describe “healthy” and “pathological” states. Experimental data show that impairment in potassium buffering by glial cells leads to pathological behavior [65–68]. Three model parameters correspond to homeostasis regulation, involving two mechanisms: the ion exchange capacity between compartments (ε and γ parameters in the model), and the maximum capacity of the Na/K pump (ρ in the model). A variation of ε corresponds to a degradation of the interaction with glial cells
14
[67,69–71] which normally ensures the regulation of the extracellular concentration of K+.
Homeostasis of intracellular ions is also critical, and a variation of γ corresponds to an impairment of such mechanisms, not detailed in this model, such as co-transporters and exchangers [72,73]. Changes in both parameters can also be considered. In the model, they are equivalent to a change in volume while keeping the β ratio constant. Varying the time constants of the slow subsystem (ε and γ), leads to different bi-stable behaviors. Two examples are shown in Fig. 4, (b) with γ = 0.04, ε= 0.002, (d) γ = 0.06, ε = 0.002, and (f) γ = 0.08, ε = 0.0008, in these situations the shape of the oscillations of potassium concentration are affected leading to a change in the duration of the events. For burst and SLE shown in Fig4. d and f, the model exhibits a different class of onset bifurcation. For both, a saddle-node on invariant cycle (SNIC) bifurcation at the onset and homoclinic bifurcation at the offset can be identified, thanks to their specific dynamics and resulting shapes [11,74].
The other key parameter to consider is the pump rate ρ. The Na/K-ATPase is described by Eq. (8) in the model. In a biological neuron, the pump depends on ATP and during SE, the ATP concentration augments due to high needs and then decreases [24]. The ATP concentration is not taken into account in the model, but the maximal Na/K-pump rate is modulated by the parameter ρ. This parameter also influences the shape of Ipump response as
a function of [Na]i and [K]o (Fig.5a). For large values of ρ, the pump is activated for lower value
of [Na]i and [K]o (Fig. 5a). We find that burst duration changes with ρ for a fixed [K]bath (Fig. 5b),
where a faster activation (higher ρ) leads to shorter bursts. The augmentation of ρ does not necessary lead to an increase of Ipump; it affects the general dynamics of the whole system (Fig.
15
Figure 5: Influence of the activity of the Na/K-pump. (a) Ipump function for ρ= 25 (green), ρ=
1000 (orange), ρ= 2500 (blue). The initial slope when the system moves away from the concentrations at rest is affected, explaining the modification of the influence of Ipump in the
dynamic of the system. (b) Burst duration as a function of ρ for [K]bath = 14.0 mM. Bursts have
shorter durations for higher value of ρ. (c) Minimal and maximal pump current, Ipump, observed
during simulation done with [K]bath = 14.0 mM. The range of Ipump decreases for higher ρ values.
All these observations show that the model presents a behavior consistent with experimental observations. Importantly, the biophysical model is able to reproduce general patterns of activities (i.e. periodic events) as generated by the phenomenological model [13]. Phenomenological models, which present a minimal number of variables and parameters, allow an exhaustive study of the dynamics. The biophysical model used here contains too many parameters for an exhaustive study of the dynamics, but reducing the number of
16
variables will allow a comparison with the generic model. In the next section, we analyze the dynamics of the model.
Dynamical observations
The model can be divided into the fast (V, n, respectively Eq.1 and Eq.2) and the slow subsystems (∆[K]i, [K]g, respectively Eq.3 and Eq.3). The slow system can oscillate and drive
the fast system between different behaviors, in particular switching between resting state and fast oscillations to obtain bursting-like activity. This type of phenomenon, corresponding to slow fast systems, has been extensively studied from a theoretical point of view, in particular for neural activity [11,35]. In this subsection, to allow a better correspondence with the theoretical framework, we call burster a system allowing these periodic events. To create the oscillation in the slow subsystem, theoretical works show that two mechanisms are possible [11,74]: Slow-Wave (SW) burster, where the slow subsystem is made of two equations, independent of the fast system, or Hysteresis-Loop (HL) burster where the slow subsystem is made of only one equation that depends on the fast system. Each has typical onset/offset bifurcation pairs. These specific paths for bursting have been identified in the generic model [11], and are reproduced in fig.6a. We first verified if the relations between the equations of the slow and fast systems allow the existence of the mechanisms described previously. In our model, two equations describe the slow subsystem (Eq.(3), (4)). Because IK (Eq.(6)) depends on V and n,
the Eq.(3), depends on the fast system. This corresponds to a relation that exists in an HL burster. The second equation of the slow subsystem, Eq.(4), also depends on the Eq.(3), through the Eq. (20). Thus, there exists a relation between the two equations of the slow system, enabling oscillation such as in a SW burster. These relations between the variables of our model allow obtaining the two types of bursters previously described.
We therefore tested for possible correspondences between our model and the generic model. We were able to identify the regions in the generic model capturing the dynamics reproduced by our model in Fig.6a. The center of the region of interest has been marked with a yellow star in fig. 6a. for the generic model and its correspondence in the bifurcation diagram
17
of our model in Fig. 6b. In this bifurcation diagram we show two possible paths of our model, for burst behavior (Fig. 6b, top) and for SLE (Fig. 6b, bottom). It crosses regions of stable resting state (in white), depolarized (red), and bistable (light red). It is therefore possible to establish a non-exhaustive list of the correspondences between the paths of the two models. The paths for the periodic events have been listed in Fig. 6c. The spike train, Bursting and SLE behaviors correspond to paths, c5, c2 and c10, respectively. The bursting behavior with changes in ε and γ (Fig. 4b) that represents the SNIC/SH bifurcation corresponds to the path c6. The model proposed here, consistent with biophysics, fits into the framework of the generic model.
18
Figure 6: Comparison with the generic model. (a) Paths for bursting activity of the generic
model proposed by Saggio et al. adapted from [11], for hysteresis-loop burster (left) and slow-wave burster (right), the yellow star corresponds to the center of the region captured by our model. (b) Bifurcation diagram of our model, where the white area corresponds to ‘resting state only’ region, the dark red corresponds to a depolarized region, and the light-red region is the region of bi-stability. The yellow star corresponds to the point also found in the generic model, where the SH, SNIC and SN bifurcations intersect. In the top diagram, the green line corresponds to the path taken by the burster, in the bottom one to the path taken by the SLE. (c) Classes of bursters found in the model, and the corresponding path in the generic model.
19
Since our biophysical model reproduces the bifurcations of the generic model for different types of network activities, it becomes possible to investigate the ionic mechanisms underlying the onset/offset bifurcations. The fast subsystem can be described fixing all parameters (tables 1 and 2) and considering the two slow variables as parameters. Fixed points can thus be found for different values of ∆[K]i and [K]g as shown in Fig. 7. Importantly,
some parameter values allow a bi-stable behavior. It is thus possible to understand the direct relationship between the biophysical variations in potassium concentration and the type of bifurcations by observing the trajectory of the membrane potential in this space for periodic events identified previously. During periodic oscillatory behavior, the neuron is initially in resting state (blue plane). The membrane potential slowly increases due to the rise in extracellular potassium, until it reaches a SN (green plane) and then encounters a limit cycle. The slow subsystem then drives it to a negative value of ∆[K]i, were the limit cycle meets a SN
producing homoclinic bifurcation. These bifurcations are observed at the onset and offset of bursting and SLE behaviors in the model. To have a better understanding of these trajectories, animations with the dynamics of the fast subsystem are available in supplementary material (Fig. S1, S2, S3, S4). We therefore have here a means of bringing together the biophysical aspects, described previously, with the phenomenological vision of dynamical systems approach.
20
Figure 7: Fixed points of the fast subsystem. Fixed point of the fast subsystem (Vm)
considering the variables from the slow subsystem as parameters. We used a numerical methods with SymPy [63] and SciPy [64] libraries, to find the roots and the eigenvalues of the Jacobians of the 2D fast subsystem, and thus the stability considering the existence and the sign of real and imaginary parts of the eigenvalues of the Jacobians. Blue: stable node, green: saddle node, cyan: stable focus, magenta: unstable focus, red: unstable node. Two different angles of view are presented, illustrating the manifold that permits bi-stability.
Discussion
The aim of this work is to develop a minimal biophysical model at single neuron level based on time scale separation, where the system is able reproduce the dynamics which have been identified in experiments [1,23,60,61,75] and described by generic models [1,11] . For this purpose, we developed a three-compartment model: a cell equipped with voltage-gated channels to generate action potentials, and Na+/K+ pump to maintain stable ion concentration, an extracellular space surrounding the cell and an external bath that can uptake/release potassium from/to extracellular space. We managed to describe the interaction between these compartments using a system of four differential equations describing two fast and two slow variables. The fast variables delineate excitability while the slow ones, outline potassium changes from the first and third compartments. The sodium concentration changes are not excluded from our model but are linked to potassium through the electroneutrality principle. We have shown that despite its simplicity the model was able to mimic six electrophysiological behaviors classically recorded in neurons and neuronal networks (SLE and SE-like event), via
21
the variation of only one parameter. All parameter values were within biophysical ranges (Table1) [72,73]. The model has two main limitations. The fast system describes only intrinsic excitability and does not include synaptic currents. And, the slow system is based (only) on potassium concentration. Introducing synaptic inputs would increase the dimension of the system. We propose that synaptic inputs would act as a noise generator increasing the probability to reach the bifurcation as demonstrated experimentally [1]; including them should not change the general behavior of the model. Furthermore, ion homeostasis is not reduced solely to potassium. Potassium is just one candidate among many others for the slow system. Numerous studies have reported large changes in concentration of Ca2+ [76], Cl- [77,78] and
neurotransmitters during seizures [79,80]. Likewise, decreasing extracellular Ca2+ leads to
seizures [50], which are characterized by SN/homoclinic bifurcations [1]. Since it is possible to trigger similar SLEs via totally different biophysical mechanisms [1], we propose that the K+
-dependent mechanism we describe, is one among many the possible paths leading to the same end point. In our model, changes in potassium constitute the causal factor driving the neuron through different types of activities. Although similar changes in potassium are measured experimentally when networks (and not cells) undergo such transitions, causality has not been demonstrated experimentally, only correlation. Another limitation exists due to the formalism used. If [K]bath tends to zero then membrane potential goes to infinite
hyperpolarization. We reach here the limit of the conductance-based model from Hodgkin-Huxley formalism. Due to the expression of the Nernst potential, if the ratio [K]o/[K]i approaches
zero, then the IK current increases towards infinity, which is not physiologically plausible.
Another factor to consider is that the dynamics of the single cell is driven by slow changes of extracellular variables, which, in a biological system, is shared with neighboring cells. So, these slow variables can also be responsible for the genesis of network activity [3]. As these mechanisms exist both at the network and single neuron level, it would be simplistic to conclude that a seizure at the network level is due to the combined expression of seizures at the single cell level. Since a neuronal network can be seen as a complex system of many components, coupled in a non-linear manner, seizures may just be an emergent property,
22
perhaps taking advantage of the fact that they are already encoded at the single cell level. The same consideration applies to other pathological activities such as SE and DB, which corresponding pattern have been found in dynamics of our model.
However, we only studied the dynamics for variations of few chosen parameters based on physiological observations identified in previous works. The parameters explored here show that the model can produce different combinations of onset/offset bifurcations. Numerous studies used ion concentration variations in biophysical models to generate various types of activity [21,26,38–40,42,43,81]. Descriptions of ion concentration dynamics for bursting have been done by Barreto et al. [39], based on a slow/fast system. In this work, the bifurcations for SLEs are SNIC and Hopf. This approach, based on ion concentration dynamics, permits the unification of spike, seizure and spreading depression proposed by Wei and al. [37]. As different models can lead to similar dynamics [82], this may suggest that different minimalist models are possible to obtain a unified framework. In our work, we proposed a conductance-based model of the neuronal membrane, exhibiting an extended repertoire of behavior and introducing status epilepticus-like events in a unified framework. Another difference with previous work is that our model can exhibit bi-stable modes saddle-node/homoclinic bifurcations, which are the most commonly observed in recordings from patients and experimental animal models [1]. Our model does not take into account variation of volume or oxygen homeostasis as in [37] but, only variations of ion concentrations, driven by diffusion of potassium from EB. It seems intuitive that other biological variables could be considered as slow variables to drive the fast subsystem in a reduced biophysical model. The work of Øyehauget al.[40] presents interesting dynamical features with saddle-node/homoclinic bifurcations for SLEs. However, this model is much more complex as it describes numerous biological features and mechanisms. In comparison to previous works [21,38–40], our model is reduced to only four equations. We sought to include only a minimal number of mechanisms necessary to reproduce neural dynamics. Chizhov et al. [22] proposed a biophysical model (Epileptor-2) of ictal activities based on the Epileptor [1], using different differential equations.
23
In high potassium conditions, Epileptor-2 produces bursts of bursts, described as ictal-like discharges. However, the most common form of seizure belongs to the saddle-node/homoclinic form, which starts with low voltage fast activity, and ends with bursts slowing down in a logarithmic fashion. The latter was reproduced in the present model, including the period during which neurons stop firing (depolarization block) after seizure onset. Another difference lies in K+ dynamics. In Epileptor-2, neuronal firing ends when extracellular K+ returns
to baseline level (see Fig 10. in [22]), whereas in the present model, there is a delay, as consistently found experimentally, as a result of glial cell action. This phenomenon in our model can be visualized by observing the evolution of [K]o in Fig. 4. Although the Epileptor-2 is not
an “intrinsic” Slow/Fast dynamical system, indeed, this model does not describe an independent node as it takes in account the influence from synaptic inputs from neuronal population. In our model, the observed dynamics, is only due to internal interactions between three compartments.
In conclusion, we developed a biophysical model of a single neuron that, despite its simplicity, is able to generate, in a unified framework, many patterns of neuronal network activity found in experimental recording as well as in generic mathematical models. We show that transition from physiological to paroxysmal activity can be obtained by variation of model parameters relating to ion homeostasis while excitability parameters remained constant. Thus, we proposed a simple biophysical model comparable to generic models [1,11,13], offering the possibility of a biological interpretation of observed dynamics. Neuronal networks increase in complexity from flies to humans, but the basic properties of neurons are roughly conserved. The present study shows that acting on an external variable allows single neurons to go through various patterns of activities, which are also found at the network level in the form of seizures, status epilepticus and depolarization block [1,83]. We propose that they constitute one of the most primitive forms of activities, appearing as soon as neurons are present.
24
Materials and Methods
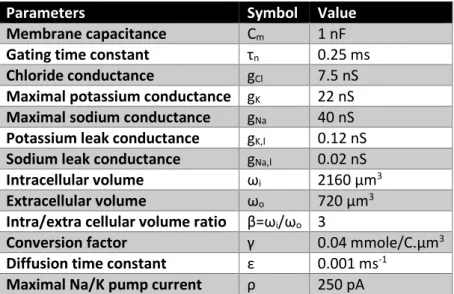
In this project we aim to build a minimal biophysical model that describes different electrophysiological states of a single neuron, the model is schematized in Fig.1. The model describes three compartments: the intracellular space (ICS), the extracellular (ECS) space and the external bath (EB). Parameters chosen correspond to values observed in whole cell recording. The ion exchange between the ICS and the ECS is carried out by the current flowing through the sodium, potassium, and chloride voltage-gated channels (eq.(5),(6) and (7)), and by the sodium-potassium pump generated current (eq.(8)). Parameters values for these currents have identified in [72,84,85] and the membrane capacitance in [86]. Passive diffusion of potassium exists (eq.(4)), between EB and ECS. The EB is mimicking the K+ buffering of vasculature/astrocytes. In ICS and ECS actualization of potassium and sodium concentrations are done (eq.(14)-(20)). The γ parameter has the same unit as the inverse of the Faraday constant, and it is a scaling parameter that permit to include all the mechanisms not detailed in this model which affect the concentration variations (such as co-transporter, exchangers). The values of all the parameters used are given in table 1 and physiological reference and initial values are given in table 2 and table 3.
Table 1. Parameters values
Parameters Symbol Value
Membrane capacitance Cm 1 nF
Gating time constant τn 0.25 ms
Chloride conductance gCl 7.5 nS
Maximal potassium conductance gK 22 nS
Maximal sodium conductance gNa 40 nS
Potassium leak conductance gK,l 0.12 nS
Sodium leak conductance gNa,l 0.02 nS
Intracellular volume ωi 2160 µm3
Extracellular volume ωo 720 µm3
Intra/extra cellular volume ratio β=ωi/ωo 3
Conversion factor γ 0.04 mmole/C.µm3
Diffusion time constant ε 0.001 ms-1
25
Table 2. Physiological reference values Ion Concentration External bath [K]bath [2-30] mM
Extracellular [K]0,o 4.8 mM [Na]0,o 138 mM [Cl]0,o 112 mM Intracellular [K]0,i 140 mM [Na]0,i 16 mM [Cl]0,i 5 mM
Table 3. Initial values
The model is a slow-fast dynamical system based on 4 equations. The fast system describes the membrane potential eq.(1) and potassium conductance gating variable eq.(2). The slow system describes intracellular potassium concentration variation eq.(3) and extracellular potassium buffering by external bath eq.(4).
(1)
dVdt= −
C1 m(I
Cl+ I
Na+ I
K+ I
pump)
(2)
dndt=
n∞(V)− nτ n(3)
d∆[K]dt i= −
γ ωi(I
K− 2 I
pump)
(4)
𝑑[𝐾]𝑑𝑡𝑔= 𝜀([K]
bath− [K]
o)
Variable Initial value[K]o [K]0,o
[Na]o [Na]0,o
[Cl]o [Cl]0,o
[K]i [K]0,i
[Na]i [Na]0,i
[Cl,i [Cl]0,i
Δ[K]i 0
[Kg] 0
V -70 mV
26
With currents: (5) 𝐼𝑁𝑎= (𝑔𝑁𝑎,𝑙+ 𝑔𝑁𝑎𝑚∞(𝑉)ℎ(𝑛))(𝑉 − 26.64 log([𝑁𝑎]𝑜[𝑁𝑎]𝑖)) (6) 𝐼𝐾= (𝑔𝐾,𝑙+ 𝑔𝐾𝑛)(𝑉 − 26.64 log([𝐾]𝑜[𝐾]𝑖)) (7) 𝐼𝐶𝑙 = 𝑔𝐶𝑙(𝑉 + 26.64 log([𝐶𝑙]𝑜 [𝐶𝑙]𝑖)) (8) 𝐼𝑝𝑢𝑚𝑝= 𝜌 1 1+exp (12(21−[𝑁𝑎]𝑖)) 1 1+exp (5.5−[𝐾]𝑜)And conductance variables:
(9)𝑛∞(V) =1+exp (11
18(−19−V))
(10)𝑚∞(V) =1+exp (11
12(−24−V))
(11) ℎ(n) = 1.1 −1+exp (−8(n−0.4))1
The fast subsystem of the model, (eq. (1)&(2)), is a reduction and simplification of conductance-based models, first describe by Hodgkin–Huxley (HH). From the original publication [87] the activation variable of K+ channels is determined by the equation (eq.12):
(12) dn
dt = αn(1 − n) − βnn
Where β(V) and α(V) are the voltage-dependent rate constants determining the probability of transitions between, respectively, opened and closed state of the ion channel. To simplify the model, we propose to describe the variable n, through the voltage-dependent parameter ninf(V)
and a constant parameter τn. In our model, ninf(V) is the probability to find a channel at open
state at a given membrane potential while τn is the fixed time constant that described the speed
for channels to respond to the change of membrane potential. Based on available data in the literature [87,88], and considering that the mean number of channels opened at a given potential is constant, we could qualitatively estimate this relationship (eq.9). In the HH model,
27
the time constant is dependent on the membrane potential due to the formalism used (eq.12). The HH model has been build thanks to experiments done on the squid giant axon, which present differences from on recording of mammalians neurons. We compare the ninf(V) of our
model and 1/τ(V), and ninf(V) of the HH model in Fig. 8(a). The shape has been kept from the
HH model but starts to increase for lower values of membrane potential. For the voltage-gated sodium channels, variables for opening, m, and for closing, h, have been described[87]. With the same logic, we can consider the percentage of all population of channels opened. But because this is a very fast mechanism [72], it can be considered as an instantaneous function of V [74] (eq.10). Krinskii and Kokoz[89] showed that n(t)+h(t) is almost constant, so h can be considered as a function of n. Because of the previous modification, we adapted this fitting to obtain the equation of h(n) (eq.11). Due to these simplifications, the interdependence of gating variables makes the spiking rate dependent on τ, as shown in Fig.8(b).
Figure 8: modification in gating variables. (a) ninf of our model in blue, and ninf and 1/τ of the
Hodgkin-Huxley model respectively in dash blue and red, function of the membrane potential. (b) Response of the fast subsystem of our model to step current stimulation (red) with three different values of τ (0.1, 0.25, 0.5). The value of τ influence the frequency rate spike for a same injected current.
To be able to take into account concentration variation limiting the number of equations we applied reductions. Inspired by the work of Hübel [29,90], electroneutrality permits the Eq.(12), and so to the Eq.(13). The ratio (Cm γ)/ωi is very small (<10-5) and so, the right-hand side of
28
be small and regulated by mechanisms which are not described in our model [91]. So, in our model, the chloride concentration remains constant.
(12)𝑑𝑉 𝑑𝑡 = ωi Cmγ ( d∆[K]i dt + d∆[N a]i dt + d∆[Cl]i dt ) (13)∆[K]i+ ∆[N a]i + ∆[Cl]i =Cmγ ωi (V – V0)
Thanks to these reductions, concentration variations are calculated as follow: (14)∆[N a]i = −∆[K]i (15)∆[N a]o = −β∆[N a]i (16)∆[K]o = −β∆[K]i (17)[K]i= [K]0,i + ∆[K]i (18)[N a]i= [N a]0,i + ∆[N a]i (19)[N a]o = [N a]0,o + ∆[N a]o (20)[K]o = [K]0,o + ∆[K]o + [K]g
29
References
1. Jirsa VK, Stacey WC, Quilichini PP, Ivanov AI, Bernard C. On the nature of seizure dynamics. Brain. 2014;137: 2210–30. doi:10.1093/brain/awu133
2. Stefanescu RA, Shivakeshavan RG, Talathi SS. Computational models of epilepsy. Seizure. W.B. Saunders; 2012. pp. 748–759. doi:10.1016/j.seizure.2012.08.012
3. Naze S, Bernard C, Jirsa V. Computational Modeling of Seizure Dynamics Using Coupled Neuronal Networks: Factors Shaping Epileptiform Activity. Graham L, editor. PLOS Comput Biol. 2015;11: e1004209. doi:10.1371/journal.pcbi.1004209
4. Naze S. Multiscale Computational Modeling of Epileptic Seizures : from macro to microscopic dynamics. Http://WwwThesesFr. 2015. Available: https://www.theses.fr/2015AIXM4023 5. Soltesz I, Staley K. Computational neuroscience in epilepsy. Academic; 2008. Available:
http://booksdescr.org/ads.php?md5=4430D0D436850CEFEB6D8A23B267E8BB
6. Wendling F, Benquet P, Bartolomei F, Jirsa V. Computational models of epileptiform activity. J Neurosci Methods. 2016;260: 233–251. doi:10.1016/J.JNEUMETH.2015.03.027
7. Staley K. Molecular mechanisms of epilepsy. Nat Neurosci. 2015;18: 367–72. doi:10.1038/nn.3947
8. Wang Y, Trevelyan AJ, Valentin A, Alarcon G, Taylor PN, Kaiser M. Mechanisms underlying different onset patterns of focal seizures. Lytton WW, editor. PLOS Comput Biol. 2017;13: e1005475. doi:10.1371/journal.pcbi.1005475
9. Saggio ML, Spiegler A, Bernard C, Jirsa VK. Fast-Slow Bursters in the Unfolding of a High Codimension Singularity and the Ultra-slow Transitions of Classes. J Math Neurosci. 2017;7: 7. doi:10.1186/s13408-017-0050-8
10. Blenkinsop A, Valentin A, Richardson MP, Terry JR. The dynamic evolution of focal-onset epilepsies - combining theoretical and clinical observations. Eur J Neurosci. 2012;36: 2188– 2200. doi:10.1111/j.1460-9568.2012.08082.x
11. Saggio ML, Spiegler A, Bernard C, Jirsa VK. Fast--Slow Bursters in the Unfolding of a High Codimension Singularity and the Ultra-slow Transitions of Classes. J Math Neurosci. 2017;7: 7. doi:10.1186/s13408-017-0050-8
12. Saggio ML, Crisp D, Scott JM, Karoly P, Kuhlmann L, Nakatani M, et al. A taxonomy of seizure dynamotypes. Elife. 2020;9. doi:10.7554/eLife.55632
13. El Houssaini K, Ivanov AI, Bernard C, Jirsa VK. Seizures, refractory status epilepticus, and depolarization block as endogenous brain activities. Phys Rev E. 2015;91: 010701. doi:10.1103/PhysRevE.91.010701
14. Houssaini K El, Bernard C, Jirsa VK. The epileptor model: A systematic mathematical analysis linked to the dynamics of seizures, refractory status epilepticus, and depolarization block. eNeuro. 2020;7. doi:10.1523/ENEURO.0485-18.2019
15. Kim CM, Nykamp DQ. The influence of depolarization block on seizure-like activity in networks of excitatory and inhibitory neurons. J Comput Neurosci. 2017;43: 65–79.
doi:10.1007/s10827-017-0647-7
16. Holt AB, Netoff TI. Computational modeling of epilepsy for an experimental neurologist. Exp Neurol. 2013;244: 75–86. doi:10.1016/j.expneurol.2012.05.003
30
17. Lytton WW. Computer modelling of epilepsy. Nat Rev Neurosci. 2008;9: 626–37. doi:10.1038/nrn2416
18. Jirsa VK, Proix T, Perdikis D, Woodman MM, Wang H, Gonzalez-Martinez J, et al. The Virtual Epileptic Patient: Individualized whole-brain models of epilepsy spread. Neuroimage. 2017;145: 377–388. doi:10.1016/J.NEUROIMAGE.2016.04.049
19. Proix T, Bartolomei F, Chauvel P, Bernard C, Jirsa VK. Permittivity Coupling across Brain Regions Determines Seizure Recruitment in Partial Epilepsy. J Neurosci. 2014;34: 15009– 15021. doi:10.1523/JNEUROSCI.1570-14.2014
20. Traub RD, Wong RK. Cellular mechanism of neuronal synchronization in epilepsy. Science. 1982;216: 745–7. Available: http://www.ncbi.nlm.nih.gov/pubmed/7079735
21. Krishnan GP, Filatov G, Shilnikov A, Bazhenov M. Electrogenic properties of the Na+/K+ ATPase
control transitions between normal and pathological brain states. J Neurophysiol. 2015;113: 3356–74. doi:10.1152/jn.00460.2014
22. Chizhov A V., Zefirov A V., Amakhin D V., Smirnova EY, Zaitsev A V. Minimal model of interictal and ictal discharges “Epileptor-2.” Bazhenov M, editor. PLOS Comput Biol. 2018;14:
e1006186. doi:10.1371/journal.pcbi.1006186
23. Bikson M, Hahn PJ, Fox JE, Jefferys JGR. Depolarization Block of Neurons During Maintenance of Electrographic Seizures. J Neurophysiol. 2003;90: 2402–2408. doi:10.1152/jn.00467.2003 24. Lietsche J, Imran I, Klein J. Extracellular levels of ATP and acetylcholine during
lithium-pilocarpine induced status epilepticus in rats. Neurosci Lett. 2016;611: 69–73. doi:10.1016/j.neulet.2015.11.028
25. Kager H, Wadman WJ, Somjen GG. Simulated Seizures and Spreading Depression in a Neuron Model Incorporating Interstitial Space and Ion Concentrations. J Neurophysiol. 2000;84: 495– 512. doi:10.1152/jn.2000.84.1.495
26. Cressman JR, Ullah G, Ziburkus J, Schiff SJ, Barreto E. The influence of sodium and potassium dynamics on excitability, seizures, and the stability of persistent states: I. Single neuron dynamics. J Comput Neurosci. 2009;26: 159–170. doi:10.1007/s10827-008-0132-4 27. Bragin A, Penttonen M, Buzsáki G. Termination of epileptic afterdischarge in the
hippocampus. J Neurosci. 1997;17: 2567–79. Available: http://www.ncbi.nlm.nih.gov/pubmed/9065516
28. McCormick DA, Contreras D. On The Cellular and Network Bases of Epileptic Seizures. Annu Rev Physiol. 2001;63: 815–846. doi:10.1146/annurev.physiol.63.1.815
29. Hübel N, Dahlem MA. Dynamics from Seconds to Hours in Hodgkin-Huxley Model with Time-Dependent Ion Concentrations and Buffer Reservoirs. Ermentrout B, editor. PLoS Comput Biol. 2014;10: e1003941. doi:10.1371/journal.pcbi.1003941
30. Truccolo W, Donoghue JA, Hochberg LR, Eskandar EN, Madsen JR, Anderson WS, et al. Single-neuron dynamics in human focal epilepsy. Nat Neurosci. 2011;14: 635–41.
doi:10.1038/nn.2782
31. Tankus A. Exploring human epileptic activity at the single-neuron level. Epilepsy Behav. 2016;58: 11–17. doi:10.1016/j.yebeh.2016.02.014
32. Merricks EM, Smith EH, McKhann GM, Goodman RR, Bateman LM, Emerson RG, et al. Single unit action potentials in humans and the effect of seizure activity. Brain. 2015;138: 2891–906. doi:10.1093/brain/awv208
31
33. Montbrió E, Pazó D, Roxin A. Macroscopic Description for Networks of Spiking Neurons. Phys Rev X. 2015;5: 021028. doi:10.1103/PhysRevX.5.021028
34. Jirsa VK, Stefanescu RA. Neural Population Modes Capture Biologically Realistic Large Scale Network Dynamics. Bull Math Biol. 2011;73: 325–343. doi:10.1007/s11538-010-9573-9 35. Izhikevich E. Dynamical Systems In Neuroscience : The Geometry of Excitability and Bursting.
MIT Press. 2007.
36. Izhikevich EM. NEURAL EXCITABILITY, SPIKING AND BURSTING. Tutorials Rev Int J Bifurc Chaos. 2000. Available: http://math.la.asu.edu/
37. Wei Y, Ullah G, Schiff SJ. Unification of neuronal spikes, seizures, and spreading depression. J Neurosci. 2014;34: 11733–11743.
38. Wei Y, Ullah G, Ingram J, Schiff SJ. Oxygen and seizure dynamics: II. Computational modeling. J Neurophysiol. 2014;112: 213–23. doi:10.1152/jn.00541.2013
39. Barreto E, Cressman JR. Ion concentration dynamics as a mechanism for neuronal bursting. J Biol Phys. 2011;37: 361–73. doi:10.1007/s10867-010-9212-6
40. Øyehaug L, Østby I, Lloyd CM, Omholt SW, Einevoll GT. Dependence of spontaneous neuronal firing and depolarisation block on astroglial membrane transport mechanisms. J Comput Neurosci. 2012;32: 147–165. doi:10.1007/s10827-011-0345-9
41. Ullah G, Schiff SJ. Assimilating seizure dynamics. PLoS Comput Biol. 2010;6: e1000776. doi:10.1371/journal.pcbi.1000776
42. Wei Y, Ullah G, Schiff SJ. Unification of Neuronal Spikes, Seizures, and Spreading Depression. J Neurosci. 2014;34: 11733–11743. doi:10.1523/JNEUROSCI.0516-14.2014
43. Bernard C, Naze S, Proix T, Jirsa VK. Modern concepts of seizure modeling. Int Rev Neurobiol. 2014;114: 121–53. doi:10.1016/B978-0-12-418693-4.00006-6
44. Dubyak GR. Ion homeostasis, channels, and transporters: an update on cellular mechanisms. Adv Physiol Educ. 2004;28: 143–154. doi:10.1152/advan.00046.2004
45. Fisher RS, Pedley TA, Moody WJ, Prince DA. The role of extracellular potassium in hippocampal epilepsy. Arch Neurol. 1976;33: 76–83. Available:
http://www.ncbi.nlm.nih.gov/pubmed/1252153
46. de Curtis M, Uva L, Gnatkovsky V, Librizzi L. Potassium dynamics and seizures: Why is potassium ictogenic? Epilepsy Res. 2018;143: 50–59. doi:10.1016/j.eplepsyres.2018.04.005 47. Fröhlich F, Bazhenov M, Iragui-Madoz V, Sejnowski TJ. Potassium dynamics in the epileptic
cortex: new insights on an old topic. Neuroscientist. 2008;14: 422–33. doi:10.1177/1073858408317955
48. Wang L, Dufour S, Valiante TA, Carlen PL. Extracellular Potassium and Seizures: Excitation, Inhibition and the Role of Ih. Int J Neural Syst. 2016;26: 1650044.
doi:10.1142/S0129065716500441
49. Lux HD, Heinemann U, Dietzel I. Ionic changes and alterations in the size of the extracellular space during epileptic activity. Adv Neurol. 1986;44: 619–39. Available:
http://www.ncbi.nlm.nih.gov/pubmed/3518349
50. Jefferys JG, Haas HL. Synchronized bursting of CA1 hippocampal pyramidal cells in the absence of synaptic transmission. Nature. 1982;300: 448–50. Available:
32
51. de Almeida A-CG, Rodrigues AM, Scorza FA, Cavalheiro EA, Teixeira HZ, Duarte MA, et al. Mechanistic hypotheses for nonsynaptic epileptiform activity induction and its transition from the interictal to ictal state-Computational simulation. Epilepsia. 2008;49: 1908–1924.
doi:10.1111/j.1528-1167.2008.01686.x
52. Katayama Y, Becker DP, Tamura T, Hovda DA. Massive increases in extracellular potassium and the indiscriminate release of glutamate following concussive brain injury. J Neurosurg. 1990;73: 889–900. doi:10.3171/jns.1990.73.6.0889
53. Reinert M, Khaldi A, Zauner A, Doppenberg E, Choi S, Bullock R. High extracellular potassium and its correlates after severe head injury: relationship to high intracranial pressure.
Neurosurg Focus. 2000;8: e10. Available: http://www.ncbi.nlm.nih.gov/pubmed/16924778 54. Lowenstein DH. Epilepsy after head injury: An overview. Epilepsia. 2009;50: 4–9.
doi:10.1111/j.1528-1167.2008.02004.x
55. Durand DM, Park E-H, Jensen AL. Potassium diffusive coupling in neural networks. Philos Trans R Soc Lond B Biol Sci. 2010;365: 2347–62. doi:10.1098/rstb.2010.0050
56. Gloveli T, Albrecht D, Heinemann U. Properties of low Mg2+ induced epileptiform activity in rat hippocampal and entorhinal cortex slices during adolescence. Brain Res Dev Brain Res. 1995;87: 145–52. Available: http://www.ncbi.nlm.nih.gov/pubmed/7586496
57. Traynelis SF, Dingledine R. Potassium-induced spontaneous electrographic seizures in the rat hippocampal slice. J Neurophysiol. 1988;59: 259–276. doi:10.1152/jn.1988.59.1.259
58. Traynelis SF, Dingledine R. Modification of potassium-induced interictal bursts and electrographic seizures by divalent cations. Neurosci Lett. 1989;98: 194–199. doi:10.1016/0304-3940(89)90509-0
59. Haglund MM, Schwartzkroin PA. Role of Na-K pump potassium regulation and IPSPs in seizures and spreading depression in immature rabbit hippocampal slices. J Neurophysiol. 1990;63: 225–39. doi:10.1152/jn.1990.63.2.225
60. Uva L, Trombin F, Carriero G, Avoli M, de Curtis M. Seizure-like discharges induced by 4-aminopyridine in the olfactory system of the in vitro isolated guinea pig brain. Epilepsia. 2013;54: 605–15. doi:10.1111/epi.12133
61. Quilichini PP, Diabira D, Chiron C, Ben-Ari Y, Gozlan H. Persistent epileptiform activity induced by low Mg2+ in intact immature brain structures. Eur J Neurosci. 2002;16: 850–60. Available: http://www.ncbi.nlm.nih.gov/pubmed/12372021
62. Somjen GG. Mechanisms of spreading depression and hypoxic spreading depression-like depolarization. Physiol Rev. 2001;81: 1065–96. doi:10.1152/physrev.2001.81.3.1065 63. Meurer A, Smith CP, Paprocki M, Čertík O, Kirpichev SB, Rocklin M, et al. SymPy: symbolic
computing in Python. PeerJ Comput Sci. 2017;3: e103. doi:10.7717/peerj-cs.103
64. Millman KJ, Aivazis M. Python for Scientists and Engineers. Comput Sci Eng. 2011;13: 9–12. doi:10.1109/MCSE.2011.36
65. Scholl UI, Choi M, Liu T, Ramaekers VT, Häusler MG, Grimmer J, et al. Seizures, sensorineural deafness, ataxia, mental retardation, and electrolyte imbalance (SeSAME syndrome) caused by mutations in KCNJ10. Proc Natl Acad Sci U S A. 2009;106: 5842–7.
doi:10.1073/pnas.0901749106
66. Rangroo Thrane V, Thrane AS, Wang F, Cotrina ML, Smith NA, Chen M, et al. Ammonia triggers neuronal disinhibition and seizures by impairing astrocyte potassium buffering. Nat Med.
33
2013;19: 1643–8. doi:10.1038/nm.3400
67. Coulter DA, Steinhäuser C. Role of astrocytes in epilepsy. Cold Spring Harb Perspect Med. 2015;5: a022434. doi:10.1101/cshperspect.a022434
68. Hubbard JA, Binder DK. Astrocytes and epilepsy.
69. Walz W. Role of astrocytes in the clearance of excess extracellular potassium. Neurochem Int. 2000;36: 291–300. Available: http://www.ncbi.nlm.nih.gov/pubmed/10732996
70. Kofuji P, Newman EA. Potassium buffering in the central nervous system. Neuroscience. 2004;129: 1045–56. doi:10.1016/j.neuroscience.2004.06.008
71. Olsen ML, Khakh BS, Skatchkov SN, Zhou M, Lee CJ, Rouach N. New Insights on Astrocyte Ion Channels: Critical for Homeostasis and Neuron-Glia Signaling. J Neurosci. 2015;35: 13827–35. doi:10.1523/JNEUROSCI.2603-15.2015
72. Hille B. Ion channels of excitable membranes. Sinauer; 2001. Available: https://global.oup.com/ushe/product/ion-channels-of-excitable-membranes-9780878933211?cc=us&lang=en&#
73. Kandel, Eric R., Schwartz James H., Jessell Thomas M. al. Principles of neural science.
74. Izhikevich EM. Dynamical systems in neuroscience : the geometry of excitability and bursting. MIT Press; 2007. Available:
https://books.google.fr/books?hl=fr&lr=&id=kVjM6DFk-twC&oi=fnd&pg=PR15&dq=E+Izhikevich.+Dynamical+systems+in+neuroscience+:+The+geome try+of+excitability+and+bursting.+MIT+Press,+2007.&ots=KUAAkXe2wf&sig=Z3uE89CQQUv4T 0iaSxAjyY1uK74#v=onepage&q=E Izhikevich. Dynamical systems in neuroscience %3A The geometry of excitability and bursting. MIT Press%2C 2007.&f=false
75. Somjen GG. Mechanisms of Spreading Depression and Hypoxic Spreading Depression-Like Depolarization. Physiol Rev. 2001;81: 1065–1096. doi:10.1152/physrev.2001.81.3.1065 76. Heinemann U, Konnerth A, Pumain R, Wadman WJ. Extracellular calcium and potassium
concentration changes in chronic epileptic brain tissue. Adv Neurol. 1986;44: 641–61. Available: http://www.ncbi.nlm.nih.gov/pubmed/3518350
77. Miles R, Blaesse P, Huberfeld G, Wittner L, Kaila K. Chloride homeostasis and GABA signaling in temporal lobe epilepsy. Jasper’s Basic Mechanisms of the Epilepsies. National Center for Biotechnology Information (US); 2012. Available:
http://www.ncbi.nlm.nih.gov/pubmed/22787654
78. Raimondo J V., Burman RJ, Katz AA, Akerman CJ. Ion dynamics during seizures. Front Cell Neurosci. 2015;9: 419. doi:10.3389/FNCEL.2015.00419
79. Chapman AG, Westerberg E, Premachandra M, Meldrum BS. Changes in Regional
Neurotransmitter Amino Acid Levels in Rat Brain During Seizures Induced by l-Allylglycine, Bicuculline, and Kainic Acid. J Neurochem. 1984;43: 62–70.
doi:10.1111/j.1471-4159.1984.tb06679.x
80. During MJ, Spencer DD. Extracellular hippocampal glutamate and spontaneous seizure in the conscious human brain. Lancet. 1993;341: 1607–1610. doi:10.1016/0140-6736(93)90754-5 81. Florence G, Dahlem MA, Almeida A-CG, Bassani JWM, Kurths J. The role of extracellular
potassium dynamics in the different stages of ictal bursting and spreading depression: A computational study. J Theor Biol. 2009;258: 219–228. doi:10.1016/j.jtbi.2009.01.032 82. Prinz AA, Bucher D, Marder E. Similar network activity from disparate circuit parameters. Nat
34
Neurosci. 2004;7: 1345–1352. doi:10.1038/nn1352
83. Cunliffe VT, Baines RA, Giachello CNG, Lin WH, Morgan A, Reuber M, et al. Epilepsy research methods update: Understanding the causes of epileptic seizures and identifying new treatments using non-mammalian model organisms. Seizure. W.B. Saunders Ltd; 2015. pp. 44–51. doi:10.1016/j.seizure.2014.09.018
84. Läuger P (Peter). Electrogenic ion pumps. Sinauer Associates; 1991.
85. Hamada K, Matsuura H, Sanada M, Toyoda F, Omatsu-Kanbe M, Kashiwagi A, et al. Properties of the Na +/K + pump current in small neurons from adult rat dorsal root ganglia. Br J
Pharmacol. 2003;138: 1517–1527. doi:10.1038/sj.bjp.0705170
86. Golowasch J, Thomas G, Taylor AL, Patel A, Pineda A, Khalil C, et al. Membrane capacitance measurements revisited: Dependence of capacitance value on measurement method in nonisopotential neurons. J Neurophysiol. 2009;102: 2161–2175. doi:10.1152/jn.00160.2009 87. Hodgkin, A. L., Huxley F. A quantitative description of membrane current and its application to
conduction and excitation in nerve. J Physiol. 1952;117: 500–544.
88. Bekkers JM. Distribution and activation of voltage-gated potassium channels in cell-attached and outside-out patches from large layer 5 cortical pyramidal neurons of the rat. J Physiol. 2000;525 Pt 3: 611–20. doi:10.1111/J.1469-7793.2000.T01-2-00611.X
89. Krinskii,V.I. , Kokoz YM. Analysis of equations of excitable membranes-I. Reduction of the Hodgkin-Huxley equations to a second order system. Biophysica. 1973;18: 533–539. Available: https://www.researchgate.net/publication/279566216_Analysis_of_equations_of_excitable_ membranes-I_Reduction_of_the_Hodgkin-Huxley_equations_to_a_second_order_system 90. Hübel N. Local dynamics of ion based neuron models for cortical spreading depression, stroke
and seizures. Technische Universität Berlin, Fakultät II - Mathematik und Naturwissenschaften. 2015. doi:http://dx.doi.org/10.14279/depositonce-4367
91. Doyon N, Vinay L, Prescott SA, De Koninck Y. Chloride Regulation: A Dynamic Equilibrium Crucial for Synaptic Inhibition. Neuron. 2016;89: 1157–1172.
![Figure 3: Variation of extracellular potassium concentration as a function of [K] bath](https://thumb-eu.123doks.com/thumbv2/123doknet/14224651.484359/11.892.111.783.538.952/figure-variation-extracellular-potassium-concentration-function-k-bath.webp)