Publisher’s version / Version de l'éditeur:
Vous avez des questions? Nous pouvons vous aider. Pour communiquer directement avec un auteur, consultez la
première page de la revue dans laquelle son article a été publié afin de trouver ses coordonnées. Si vous n’arrivez pas à les repérer, communiquez avec nous à [email protected].
Questions? Contact the NRC Publications Archive team at
[email protected]. If you wish to email the authors directly, please see the first page of the publication for their contact information.
https://publications-cnrc.canada.ca/fra/droits
L’accès à ce site Web et l’utilisation de son contenu sont assujettis aux conditions présentées dans le site LISEZ CES CONDITIONS ATTENTIVEMENT AVANT D’UTILISER CE SITE WEB.
Proceedings of the 12th International Conference on Alkali-Aggregate Reaction in
Concrete: 15 October 2004, Beijing, China, pp. 154-162, 2004-10-01
READ THESE TERMS AND CONDITIONS CAREFULLY BEFORE USING THIS WEBSITE. https://nrc-publications.canada.ca/eng/copyright
NRC Publications Archive Record / Notice des Archives des publications du CNRC :
https://nrc-publications.canada.ca/eng/view/object/?id=82c1d727-b969-4512-a2e3-3eefc9560f2a https://publications-cnrc.canada.ca/fra/voir/objet/?id=82c1d727-b969-4512-a2e3-3eefc9560f2a
NRC Publications Archive
Archives des publications du CNRC
This publication could be one of several versions: author’s original, accepted manuscript or the publisher’s version. / La version de cette publication peut être l’une des suivantes : la version prépublication de l’auteur, la version acceptée du manuscrit ou la version de l’éditeur.
Access and use of this website and the material on it are subject to the Terms and Conditions set forth at
The Mechanistic differences between alkali silica and alkali carbonate
reactions as studied by X-ray diffraction
The Mechanistic differences between alkali silica and
alkali carbonate reactions as studied by X-ray
diffraction
Mitchell, L.D.; Grattan-Bellew, P.E.; Margeson, J.;
Fournier, B.
NRCC-47353
A version of this document is published in / Une version de ce document se trouve dans :
Proceedings of the 12
thInternational Conference on Alkali-Aggregate Reaction in Concrete,
Beijing, China, Oct. 15-19, 2004, pp. 154-162
THE MECHANISTIC DIFFERENCES BETWEEN ALKALI SILICA AND
ALKALI CARBONATE REACTIONS AS STUDIED BY X-RAY
DIFFRACTION
Lyndon Mitchella*, Patrick Grattan-Bellewa, James Margesona & Benoit Fournierb
a
Institute For Research in Construction, National Research Council Canada, Montreal Road, Ottawa, Ontario Canada K1A 0R6
b
CANMET Materials Technology Laboratory, Minerals and Metals Sector, Natural Resources Canada, 405 Rochester Street, Ottawa, Ontario, Canada K1A 0G1
ABSTRACT:
The differences in the expansive mechanisms of both Alkali Silica (ASR) and Alkali Carbonate Reactive (ACR) rock samples were examined using X-ray diffraction techniques. Reactive aggregates were ground and placed in 1 molar NaOH solution at both 80 and 20°C. Multiple measurements were taken over a 150 day time period. Volume and composition changes were noted. Composition changes were tracked using quantitative Rietveld analysis methods. The observation of a new semi-crystalline tobermorite-like phase common to both ASR and ACR samples raises the possibility of similar mechanisms at work in both processes. However the tobermorite-like phase is less abundant in the alkali silica samples. This new phase only occurred at 80°C, hence the possibility of a temperature induced mechanistic changes is debated.
Keywords: X-ray diffraction, Alkali aggregate reaction
1. INTRODUCTION
Alkali Carbonate reaction has been debated for a long time. In particular the dolomitic limestone from Kingston, in Ontario, Canada, has been researched extensively. In recent years a joint effort between the National Research Council Canada and CANMET to investigate this reaction has been initiated.
To aid this work a large sample (3 tonnes) of Kingston Limestone was collected from a single geographical location within the quarry. In this way it was hoped aggregate uniformity would be maintained throughout the study. A comparison of this sample to Spratt limestone has been undertaken using X-ray diffraction.
1.1 Alkali Carbonate Reaction
Workers first noticed the adverse effects of Kingston Limestone in 1957 [1]. Since then a considerable body of work has been completed, the latest being presented at the 11th International Conference on Alkali Aggregate Reaction in 2000 [2].
Early workers compared the excessive expansion and cracking found in concrete made from Kingston Limestone with that found in Alkali Silica Reaction (ASR) [1]. Tentative conclusions were drawn that the expansion was due to the dedolomitization of the aggregate. Since then other workers have extensively studied this possibility [3].
Feldman & Sereda [4] explored the sorption and expansion isotherms of the dolomitic limestone from Kingston. They found evidence of a gel like material and concluded that the mechanism was similar to that of ASR.
Subsequently workers have used low alkali cements and pozzolanic materials [5,6] to arrest the expansion found in carbonate rocks with only limited success. 1.2 Aims
It is presumed that the expansion of aggregate during Alkali aggregate reaction is caused by the expansive products formed when de-dolomitization occurs within the aggregate. This explanation leaves several questions unanswered. For example, why is expansion only observed in rocks containing 40-60% dolomite? When 100% dolomite is used little expansion is observed. Why is there no expansion Tel: (613) 998 8462; Fax: +1 (613) 954 5984
when the aggregate is crushed to a dust when large expansions are observed when the same rock is used as course aggregate?
The aim of this study was to further the knowledge of expansion and reaction rates within the Kingston aggregate. Previous X-ray diffraction results obtained from accelerated treatment of Kingston limestone wafers yielded evidence of a layered silicate from the presence of a low angle reflection at around 7.3º 2θ [7]. This apparent 'fingerprint' for reactivity in Kingston limestone lead to this wider comparative study of different aggregate materials.
2. EXPERIMENTAL
Samples of both Kingston Dolomitic limestone and Spratt limestone were prepared by grinding. The samples were then separated into 1 gram lots and conditioned in approximately 25 ml of 1M NaOH solution at two temperatures 20 & 80°C. Each sample was placed in a separate polyethylene sample bottle and conditioned. A single sample was retrieved at each measurement interval over a 150 day time period. At the appropriate time the samples were cooled (if necessary) filtered and washed with distilled water. Samples were then dried in an air circulating oven for 1 hour at ~65 ± 5°C. The 1 gram samples were then transferred to an air tight glass sample jar for storage. Samples were immediately X-rayed. The X-ray diffraction (XRD) measurements were used to characterise the deterioration and phase changes of the two limestones.
The glass sample jars containing the samples were lined up in date order, and a photograph taken. This gave a rough indication of the volume changes and rates of reaction that occurred within the samples. XRD measurements were carried out with a Scintag XDS-2000 diffractometer, using CuKα radiation and a graphite diffracted-beam monochromator. Samples were mounted onto the horizontal stage and scanned from 5 to 65° 2 theta at a step of 0.05° and a count time of 2 seconds. The data was analysed using both Bruker's Topas version 2.1 [8] and Jade version 6.5 software.
Rietveld analysis was developed in the late 1960s for structural refinement of crystalline phases from powder neutron diffraction data [9]. The Rietveld analysis technique has developed in scope and rigor, to the stage where accurate quantitative analysis of complex mixtures of crystalline phases using laboratory X-ray diffractometers may be attempted [10].
3. RESULTS AND DISCUSSION
3.1. Kingston Stone at 80°C
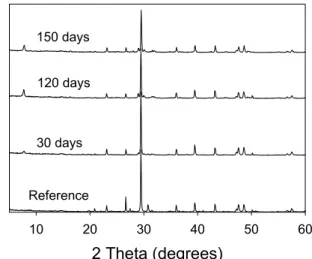
Figure 1 shows X-ray data at different time periods for Kingston stone conditioned in 1M NaOH at 80°C. The most interesting thing to note is the low angle peak that developed at 7.8° 2 theta. This has been assigned to a semi-crystalline tobermorite-like phase.
2 Theta (degrees) 10 20 30 40 50 60 Reference 30 days 120 days 150 days
Figure 1. Diffractograms of Kingston limestone conditioned in 1M NaOH at 80°C for different time periods
Figure 1 also shows that the dolomite peak at 31° 2 theta and the quartz peak at 26.6° deteriorated with time as did the clay mineral phase assigned to albite. The data shown in Figure 1 were analysed quantitatively using Rietveld analysis. An example of the fitting obtained is shown in Figure 2, and the results can be seen in Figure 3
Figure 2. Rietveld difference plot of the analysis of 80ºC Kingston limestone after 150 days.
Tobermorite is a crystalline calcium silicate phase most often associated with autoclaved calcium silicate materials. It appears in 3 distinct polymorphs 9, 11, & 14 Å tobermorite. The main difference
between these polymorphs is the amount of water found between the calcium silicate layers. In this case the best fit seems to be 11 Å tobermorite. Within the 120 and 150 day traces minor tobermorite peaks could be seen either side of the main calcite peak at 30° 2 theta.
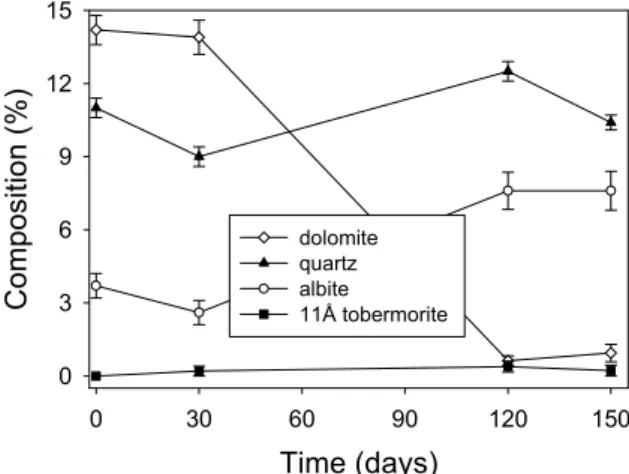
Figure 3 shows that the clay mineral and the dolomite rapidly deteriorated, and were virtually gone by 120 days. The quartz deteriorated rapidly to start with and levelled off at about 5 %. This result was at first surprising. It is known that the Kingston stone has a bi-modal quartz composition [11]; large grain embedded within the calcite matrix and finer grained materials dispersed throughout the stone. It was surmised that the fine-grained material dissolved rapidly leaving the courser materials behind.
Even at room temperatures most siliceous materials, including quartz, will dissolve in solutions above pH 10. In this case 1M NaOH was used to create a pH of 14. The rate of dissolution and the saturation points of silica will increase dramatically with both increased pH and temperature.
Figure 3. Quantitative phase analysis of the Kingston limestone with time. Results were obtained by Rietveld analysis of the data shown in Figure 1
In a pure water environment the saturation point of silica is approximately 2 milli-molar. This can be dramatically influenced by the addition of cations. Divalent ions, such as calcium and magnesium, tend to lower silica's saturation point whilst monovalent ions, such as sodium, will increase it [12]. Thus, it is perhaps not unexpected, that at 80°C and at pH 14 the silica dissolved out of the rock to become available for reaction into a tobermorite-like phase.
Rietveld analysis, along with other techniques that model powder diffraction peak profiles, has the
ability to extract microstrutural information, including crystallite size, from a diffractogram. The size information obtained from powder diffraction data is different from that obtained by techniques such as laser scattering particle size analysis.
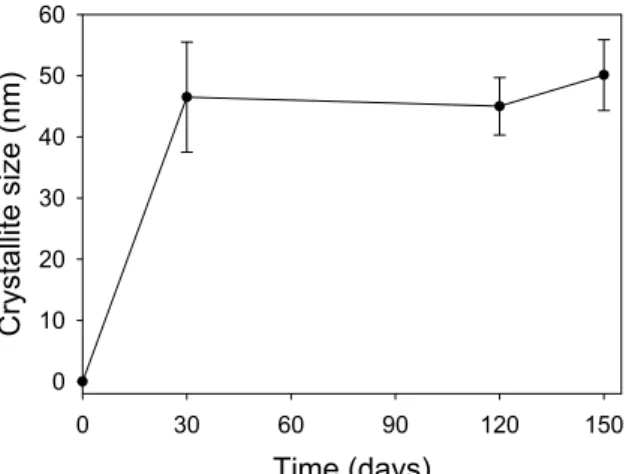
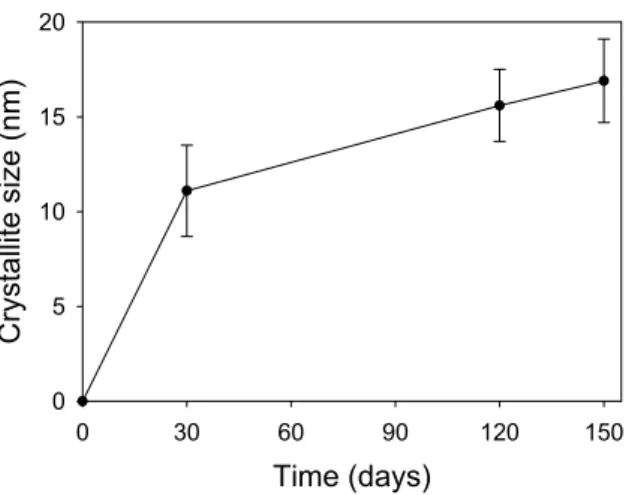
Conventional particle size analysis characteristically measures agglomerates where they are present in a material whereas X-ray diffraction techniques are 'blind' to agglomerates, and only detect 'crystallites'. A crystallite comprises of a number of crystallographic unit cells systematically grouped together to form a coherently diffracting domain [13]. Typically a grain or a particle will consist of agglomerated crystallites. Crystallites are arguably the primary particles in any material, and often govern many of the properties of a material. Figure 4 shows the crystallite size data collected for the newly formed tobermorite-like phase. It shows rapid crystallite size growth to around 50nm; the growth then stopped even though the materials concentration continued to increase. This indicates that the tobermorite material nucleated randomly in the pore waters, and did not grow preferentially on existing crystallites. Time (days) 0 30 60 90 120 150 Comp osition (%) 0 5 10 15 20 25 30 35 dolomite quartz albite 11Å tobermorite
Figure 4. Graph showing the crystallite size of the newly formed tobermorite-like phase
Figure 5 and Figure 6 show the volume changes observed when equal weights of ground Kingston
limestone powder are reacted at 80°C and 20°C. It can easily be seen that the volume change in the 80°C sample was far larger than that of the 20°C sample.
Time (days) 0 30 60 90 120 150 Crys ta llit e size (nm) 0 10 20 30 40 50 60
Figure 5. Picture of the ground Kingston limestone samples after various time periods of reaction at 80°C in 1M NaOH. Samples were filtered and washed with distilled water
Figure 6. Picture of the ground Kingston limestone samples after various time periods of reaction at 20°C in 1M NaOH. Samples were filtered and washed with distilled water
3.2. Kingston Limestone at Room Temperature Figure 7 shows X-ray scans at different time periods for Kingston stone conditioned in 1 molar NaOH at room temperature. The most interesting thing to note is the low angle peak at 7.8° 2 theta assigned to a semi-crystalline tobermorite-like phase, did not develop.
Figure 7. Diffractograms of Kingston limestone conditioned in 1M NaOH at room temperature for different time periods
Figure 8 shows that the dolomite rapidly deteriorated, as it did in the samples at 80°C. The quartz and the clay minerals did not deteriorate, unlike the samples at 80°C. The tobermorite-like phase did not develop at room temperature within the 150 day period of this study.
It is theorised that the lower temperature changed both the rates of reaction and the saturation points of the Kingston limestone phases. Thus the silica and the clay minerals didn't become available for reaction within the pore waters - hence the tobermorite-like phase didn't develop. It is interesting to note that the decomposition of the dolomite, which must have released both calcium and magnesium ions into the pore waters, did not cause a significant change in the 150 day pattern.
XRD is not a sensitive technique; phase detection levels are restricted to the 1-2% level. It is conceivable that 150 days isn't long enough to detect the development of a tobermorite-like phase at room temperature. Alternatively the tobermorite-like phase could be a direct result of the increased temperatures used rather than insufficient reaction time. If this hypothesis is correct then a mechanism change is indicated, bringing with it questions as to the validity of an 80°C test. Time (days) 0 30 60 90 120 150 Composition (%) 0 3 6 9 12 15 dolomite quartz albite 11Å tobermorite 2 Theta (degrees) 10 20 30 40 50 60 30 days 120 days 150 days Reference
Figure 8. Quantitative phase analysis of the Kingston limestone with time. Results obtained by Rietveld analysis of the graphs shown in Figure 7
3.3. Spratt Limestone at 80°C
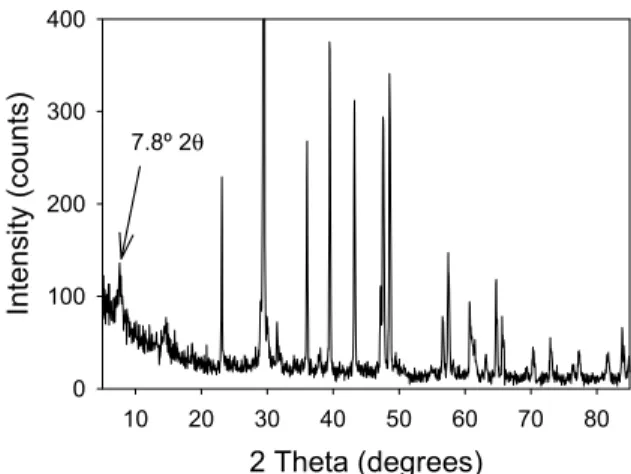
Figure 9 shows X-ray scans at different time periods for Spratt limestone conditioned in 1 molar NaOH at 80°C. The most interesting thing to note is that the low angle peak still developed at 7.8° 2 theta. However in this stone the peak never developed the high levels of intensity found in the Kingston stone.
2 Theta (degrees) 10 20 30 40 50 60 70 80 Intens ity (c ounts ) 0 100 200 300 400 7.8º 2θ
In fact to see the peak an enhancement of the Y-axis is necessary, see Figure 10. The peak, as before, was assigned to a semi-crystalline tobermorite like phase. Also interesting to note is the presence of dolomite, rendering the most significant difference between the phase compositions of the two stones the clay minerals. Within the Kingston stone there is a minor phase present that was assigned to albite, this was not observed in the Spratt limestone.
Figure 11 shows that the quartz and the dolomite rapidly deteriorated, and were virtually gone by 120 days. Although the quartz deteriorated rapidly, it did not level off at 5 % as was observed in the Kingston. It is known that the Spratt doesn't have the bi-modal quartz composition found in the Kingston; there are no large grains embedded within the calcite matrix, it is all finer grained materials dispersed throughout the stone. It was surmised that the finer grained material dissolved quite rapidly.
Figure 9. Diffractograms of Spratt limestone conditioned in 1M NaOH at 80°C for different time periods
Within the samples studied, the quantities of quartz found in the two reference materials were 11% for the Kingston and 8% for the Spratt. The Kingston levelled off at around 5%, leaving 6% in solution. All of the 8% quartz that was found in the Spratt dissolved. So although there was more silicate available for reaction in the Spratt, the result was a significantly lower level of reaction product, tobermorite.
Figure 10. Diffractogram of the 120 day Spratt limestone conditioned in 1M NaOH at 80°C. The Y-axis scaling has been changed to emphasise the existence of the 7.8° peak.
Within the samples studied, the quantities of quartz found in the two reference materials were 11% for the Kingston and 8% for the Spratt. The Kingston levelled off at around 5%, leaving 6% in solution. All of the 8% quartz that was found in the Spratt dissolved. So although there was more silicate available for reaction in the Spratt, the result was a significantly lower level of reaction product, tobermorite. 2 Theta (degrees) 10 20 30 40 50 60 Reference 30 days 120 days 150 days Time (days) 0 30 60 90 120 150 Composition (%) 0 3 6 9 12 15 18 dolomite quartz 11Å tobermorite
Figure 11. Quantitative phase analysis of the Spratt limestone with time. Results obtained by Rietveld analysis of the graphs shown in Figure 9
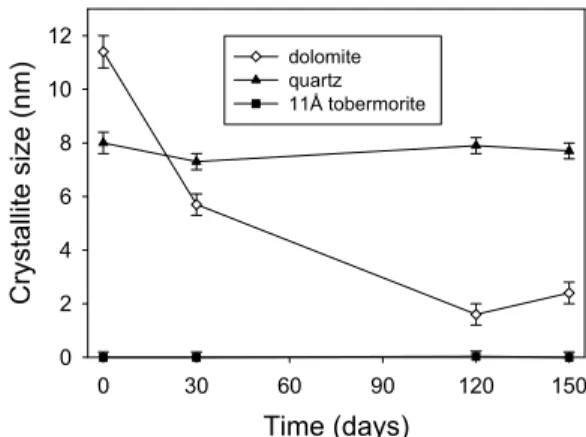
Figure 12 shows the crystallite size data collected for the newly formed tobermorite-like phase within the Spratt. It shows a completely different profile to the Kingston. Rather than a rapid crystallite growth to around 50nm; the growth shows a gradient indicating a gentler, perhaps less traumatic event. This could indicate that the tobermorite-like material nucleated in the pore waters and then grew preferentially on existing crystallites.
Figure 13 and Figure 14 show the volume changes observed when equal weights of ground Spratt limestone powder are reacted at 80°C and 20°C. It can easily be seen that, as in the Kingston limestone, the volume change in the 80°C sample is greater than that of the 20°C sample.
Figure 12. Graph showing the crystallite size of the newly formed tobermorite-like phase
Figure 13. Picture of the ground Spratt limestone samples after various time periods of reaction at 80°C in 1M NaOH. Samples were filtered and washed with distilled water
Figure 14. Picture of the ground Spratt limestone samples after various time periods of reaction at 20°C in 1M NaOH. Samples were filtered and washed with distilled water
3.4. Spratt Stone at Room temperature
Again at this temperature the low angle peak at 7.8° 2 theta assigned to a semi-crystalline tobermorite like phase, did not develop. Figure 14 shows that the dolomite rapidly deteriorated, as it did in the samples at 80°C. The quartz did not deteriorate, unlike the samples at 80°C. No tobermorite-like phase developed at room temperature within the 150 day period of this study.
Time (days) 0 30 60 90 120 150 Crys ta llit e size (nm) 0 5 10 15 20
It is theorised that the cooler temperature changed both the rates of reaction and the saturation points of the Kingston limestone phases. This seems to have occurred in the Spratt as well. The decomposition of the dolomite did not cause a significant change in the 150 day pattern.
If the hypothesis of the formation of the tobermorite like phase being a direct result of the increased temperatures is correct, then the same mechanistic change is also indicated within the Spratt. This again calls into question the validity of an 80°C test.
3.5. Chinese Limestone Studies
In addition to Kingston limestone, alkali carbonate reaction has been reported in a Chinese dolomitic limestone. The authors also studied this aggregate using XRD. Rietveld analysis of this material was not carried out due to the presence of a large number of unidentified minor phases, e.g. clays, feldspars, etc. However, the X-ray patterns did reveal a low angle reflection at around 6.7º 2θ, as indicated in figure 15.
Figure 15. Quantitative phase analysis of the Spratt limestone at room temperature with time. Results obtained by quantitative Rietveld analysis.
Figure 16. Diffractogram of a Chinese limestone treated in NaOH at 80°C for 120 days
Figure 17. Picture of the ground Chinese limestone samples after various time periods of reaction at 80°C in 1M NaOH. Samples were filtered and washed with distilled water
Figure 17 shows the volume changes observed when equal weights of ground Chinese limestone powder are reacted at 80°C. It can easily be seen that, as in the Kingston and the Spratt limestones, the volume change in the 80°C sample is significant. Clearly all of these rock types are expansive under
these conditions. Volume changes can be accounted for in several ways, changes in particle size, exfoliation of layered crystalline materials and reaction from one composition to the next. All of these suggested mechanisms by definition involve density change. It seems difficult however to explain these apparently large volume changes without invoking exfoliation as a mechanism.
Time (days) 0 30 60 90 120 150 Crystallite size (nm) 0 2 4 6 8 10 12 dolomite quartz 11Å tobermorite
4. GENERAL DISCUSSION
The low angle peaks (~7.8° 2θ) reported here are similar to those discussed by Cole et al (1981). Cole's samples were extracted from a 30-year-old Australian dam. Cole found that it did not correspond to any known compound, but likened it to zeolite A [14]. Later it was likened to rhodesite [15], because of the characteristic 12 Å peak. It should be noted that the shape of the peak observed by Cole et al (1981,1983) was narrow and sharp indicating a high degree of crystallinity - the peaks observed in this study are broader. Cole et al also observed associated peaks that are not present here. Higher levels of crystallinity would be expected in a 30 year old material - as opposed to 150 days. Cole et al concluded that their 12 Å phase irreversibly transformed into okenite (CaO.2SiO2.2H2O) with K and Na substituting for Ca, on drying [15]. 2 Theta (degrees) 10 20 30 40 50 60 In tensity (cou nts) 0 200 400 600 800 1000 1200 6.7º 2θ
It seems that the reaction products found in this study were subtly different. It is commonly reported that ASR gels in concrete tend to change composition over time, usually accumulating calcium from the surrounding paste [16]. Calcium to silica ratio is not only an important factor in ASR gel it is also import in defining the type of C-S-H gel produced on hydration of Ordinary Portland Cement (OPC) [17]. It seems quite likely that the calcium and silicate levels attained within the pore waters control the type of gel or reaction product formed. These levels are in turn controlled by equilibrium and solubility constants, which will change with temperature and pH.
Tobermorite formation can be described by the following equation.
5Ca(OH)2 + 6SiO2→ Ca5(OH)2Si6O16 ·4H2O
The above reaction hardly occurs unless both reactants are present as fine particles and form an ideal solid solution. Normally these conditions are rarely met. Therefore, tobermorite is most often thought of as being synthesised by autoclave. It has however been synthesised at room temperatures using a planetary ball mill [18]. According to the thermodynamic data, the yield of the reaction is highly dependent on the molar ratios of the reactants.
High yields are achieved at ratios of 0.8-1.0 Ca2+ to SiO42- [19].
From the above discussion it can be observed that the conditions to make tobermorite have to be precise. Thus it is suggested that the formation of the tobermorite-like phase found is a direct result of the increased temperatures, rather than the duration of the study.
There are subtle differences that occur with changes in sample type and preparation. Experience has shown that the exact position of the low angle reflection varies considerably, e.g. solid wafers tend to exhibit different angle reflections than ground powders [7]. This behaviour indicates that the layers within the tobermorite-like structure vary in spacing. The variation in the low angle peak position also occurs with different types of limestones and the environment that they are kept in. The previously discussed expansion mechanism of exfoliation could account for these varying positions seen in the low angle reflection. This observation coincides with the previously reported dependence of Kingston Limestone expansion on aggregate size [20]. More work is needed to investigate and interpret the observed variation in peak position.
5. CONCLUSIONS
All three carbonate rock types studied here showed excessive volume changes when treated with 1 molar NaOH at 80°C. This behaviour is difficult to explain without invoking a mechanism involving exfoliation. Rietveld analysis showed the presence of up to 28% of an unknown layered material in one of the limestones studied here. This layered material is thought to have a tobermorite-like structure. Hence it has been shown that Rietveld analysis can be an effective way of studying AAR.
The excessive expansions and the tobermorite-like phase were always observed together. Both characteristics were found within the samples conditioned at 80°C. Neither excessive expansion nor the tobermorite-like phase were found in the samples conditioned at room temperature. The x-ray diffraction data of the various phase evolutions suggest different rates of dissolution and formation at different temperatures. This is perhaps an indication of mechanism change induced by temperature.
6. REFERENCES
1. E.G.Swenson, "A Canadian Reactive Aggregate Undetected by ASTM tests", ASTM Bulletin, (1957) 48-51.
2. P. E. Grattan-Bellew, C. A. Rogers, "Expansion due to Alkali Carbonate reaction: Laboratory Prognosis versus Field Experience", in: Proceedings of the 11th International Conference on Alkali Aggregate Reaction In Concrete, Quebec City, Canada, June 2000, pp. 41-50.
3. T.Liang, T.Mingshu, "Correlation Between Reaction and Expansion of Alkali-Carbonate Reaction", Cem Concr Res, 25 (1995) 470-476.
4. R.F.Feldman, P.J.Sereda, "Characteristics of Sorption and Expansion Isotherms of Reactive Limestone Aggregate", Journal of The American Concrete Institute, 58 (1961) 203-214.
5. C. A. Rogers, R. D. Hooton, "Comparison Between Laboratory and Field Expansion of Alkali-Carbonate Reactive Concrete", in: The 9th International Conference on Alkali-Aggregate Reaction in Concrete, Westminster, London 1992
6. D.A.Williams, C.A.Rogers, Field Trip Guide to Alkali-Carbonate Reaction in Kingston, Ontario. Ontario Ministry of Transportation. (1991). MI-145,
7. L.D.Mitchell & J.Margeson. "Alkali Carbonate Reaction", Unpublished Report (2001)
8. Bruker AXS, TOPAS V2.1: General profile and structure analysis software for powder diffraction data. Bruker AXS. (2003). User Manual,
9. H.M.Rietveld, "Line profiles of neutron powder-diffraction peaks for structure refinement.", Acta Cryst., 22 (1967) 151-152.
10. R.J.Hill, C.J.Howard, "Quantitative phase analysis from neutron powder diffraction data using the Rietveld method.", J.Appl.Crystallogr., 20 (1987) 467-474.
11. J.E.Gillott, "Petrology of Dolomitic Limestones, Kingston, Ontario, Canada", Bulletin of the Geological Society of America, 74 (1963) 759-778.
12. R.Iler, "The Chemistry of Silica", John Wiley and Son, New York, 1979.
13. R.Jenkins & R.L.Snyder, "Introduction to X-ray Powder Diffractometry", John Wiley and Sons, New York, 1996.
14. W.F.Cole, C.J.Lancucki, "Products formed in an aged concrete", Cem Concr Res, 11 (1981) 443-454.
15. W.F.Cole, C.J.Lancucki, "Products formed in an aged concrete. The occurrence of Okenite", Cem Concr Res, 13 (1983) 611-618.
16. S. Diamond, "Chemistry and Other Characteristics of ASR Gels", in: M.A.Bérubé, B.Fournier, B.Durand (Eds), Proceedings of the 11th International Conference on Alkali Aggregate Reaction In Concrete, Quebec City, Canada, June 2000, pp. 31-40.
17. H.F.W.Taylor, "Cement Chemistry", Academic Press Ltd, London, 1990.
18. M.Guomin, S.Fumio, H.Mitsuo,
"Mechanochemical synthesis of tobermorite by wet grinding in a planetary ball mill", Powder Technology, 93 (1997) 77-81. 19. H. F. W. Taylor, "A review of autoclaved
calcium silicates", in: Symposium on Autoclaved Calcium Silicate Building Products, School of Pharmacy, University of London, May 1965, pp. 195-205.
20. E.G.Swenson, J.E.Gillott, "Characteristics of Kingston Carbonate Rock Reaction", HRB Bulletin, 275 (1960) 18-31.