Publisher’s version / Version de l'éditeur:
Tunnel Management International Journal, 7, December 4, pp. 1-10, 2004-12-01
READ THESE TERMS AND CONDITIONS CAREFULLY BEFORE USING THIS WEBSITE.
https://nrc-publications.canada.ca/eng/copyright
Vous avez des questions? Nous pouvons vous aider. Pour communiquer directement avec un auteur, consultez la
première page de la revue dans laquelle son article a été publié afin de trouver ses coordonnées. Si vous n’arrivez pas à les repérer, communiquez avec nous à PublicationsArchive-ArchivesPublications@nrc-cnrc.gc.ca.
Questions? Contact the NRC Publications Archive team at
PublicationsArchive-ArchivesPublications@nrc-cnrc.gc.ca. If you wish to email the authors directly, please see the first page of the publication for their contact information.
NRC Publications Archive
Archives des publications du CNRC
This publication could be one of several versions: author’s original, accepted manuscript or the publisher’s version. / La version de cette publication peut être l’une des suivantes : la version prépublication de l’auteur, la version acceptée du manuscrit ou la version de l’éditeur.
Access and use of this website and the material on it are subject to the Terms and Conditions set forth at
CFD simulations of in-situ fire tests in road tunnels Kashef, A.; Bénichou, N.; Lougheed, G. D.; Debs, A.
https://publications-cnrc.canada.ca/fra/droits
L’accès à ce site Web et l’utilisation de son contenu sont assujettis aux conditions présentées dans le site LISEZ CES CONDITIONS ATTENTIVEMENT AVANT D’UTILISER CE SITE WEB.
NRC Publications Record / Notice d'Archives des publications de CNRC:
https://nrc-publications.canada.ca/eng/view/object/?id=42e24b7c-8262-40b2-a33d-801e6e22282b https://publications-cnrc.canada.ca/fra/voir/objet/?id=42e24b7c-8262-40b2-a33d-801e6e22282b
CFD simulations of in-situ airflow measurements in road tunnels
Kashef, A.; Bénichou, N.; Lougheed, G.; Debs, A.
NRCC-47707
A version of this document is published in / Une version de ce document se trouve dans: Tunnel Management International Journal, v. 7, no. 4, Dec. 2004, pp. 1-10
CFD SIMULATIONS OF IN-SITU AIRFLOW MEASUREMENTS IN ROAD TUNNELS
Ahmed Kashef, Noureddine Benichou, Gary Lougheed, National Research Council of Canada
Alexandre Debs, Ministère des Transports du Québec, Canada
ABSTRACT
To investigate the performance of current emergency ventilation strategies for an existing road tunnel system in the event of a fire, a research project is being conducted by the National Research Council (NRC) of Canada. The primary objectives of the study are: a) to assess and validate the ability of emergency ventilation strategies to control smoke spread and minimize the impact of smoke on tunnel users; and b) to recommend guidelines for improving the ventilation operation to maximize intervention effectiveness. This will allow future development of an intelligent ventilation system based on a pre-established ventilation scenario activated using automatic fire detection. The current paper presents the initial investigation of comparing the predictions of a CFD model against the onsite flow measurements conducted in the tunnel.
1 INTRODUCTION
At present, a study is underway to investigate the emergency operating procedures for a tunnel emergency ventilation system. Some of these procedures date back to the design of the tunnel. Following a recent fire, the fire department had concerns regarding the operation of the ventilation system. The operating instructions were revised and formalized according to the total capacity of the in-place ventilation systems. In this project the operating instruction will be validated.
The research study consists of two phases, a numerical modelling and an experimental phase. The numerical phase will use Computational Fluid Dynamics (CFD) models to study smoke ventilation in the tunnel. Two potential CFD models, Solvent[1] and Fire Dynamic Simulator (FDS)[2], will be explored. The results of both Solvent and FDS will be compared against data measured in-situ. Based on the results of the comparisons, a model will be selected for use in the remainder of the research study.
Onsite airflow measurements were used to establish the boundary conditions for the CFD models. Airflow measurements were made throughout the ventilation system and the tunnel for selected ventilation scenarios. In addition, the range of airflow conditions at the tunnel portals was established. The results of these tests are documented in this paper. In a later stage of the project, a second set of in-situ tests will be conducted using a clean-burning fire source developed for the project. Various clean burning fuel arrangements have been developed for this application. This includes alcohol pan fires, propane burners and oil-fuelled burners. In order to simulate a fire scenario, the heat source must produce a buoyant airflow. As such, cold smoke systems or electrical systems that produce primarily radiant heat are not applicable. The heat source must convert a substantial portion of the energy to heating the air to produce a convective airflow. Artificial smoke will be added for visualization purposes.
The current paper presents the initial efforts in the research study. The results of applying the Solvent based model are compared to onsite flow measurements conducted in the tunnel. The CFD model includes aerodynamically-significant physical features of the tunnel.
1.1 Tunnel Ventilation System
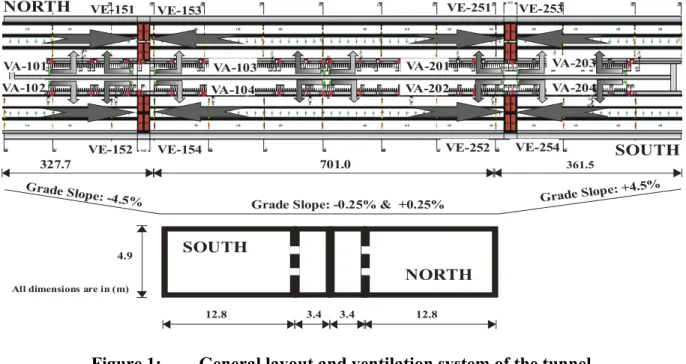
The L.-H.-La Fontaine road tunnel (Figure 1), built in 1964, is located in Montreal, Quebec, Canada, and travels underwater in a north-south direction. The tunnel is 1.8 km long with three lanes in each direction, inside two concrete tubes. Two ventilation towers are located at the ends of the underwater section. A control and monitoring centre for the tunnel is located at the North tower. A central section separates the two tubes. Galleries located in this section are used to supply air along the tunnel length via openings distributed along the walls. These galleries can also be used as evacuation routes. Doors at various locations along the length of the tunnel provide access to the gallery for the other traffic tube. The wall openings have adjustable dampers to ensure uniformity of air distribution. The side vents are situated in two rows, upper and lower. The lower and the upper rows are located at heights of 1.0 and 3.9 m above the tunnel floor, respectively, and at intervals of approximately 6 m. The two rows of vents are offset by 3 m.
327.7 701.0 361.5
Grade Slope: -4.5%
Grade Slope: +4.5%
Grade Slope: -0.25% & +0.25%
SOUTH
12.8 3.4 3.4 12.8
4.9
VA-101 VA-103 VA-201 VA-203
VA-102 VA-104 VA-202 VA-204
VE-152 VE-153 VE-154 VE-251 VE-252 VE-253 VE-254 NORTH NORTH SOUTH
All dimensions are in (m)
VE-151
Figure 1: General layout and ventilation system of the tunnel
The tunnel ventilation is provided by a semi-transverse ventilation system with local extraction points (Figure 1). The ventilation system is composed of 8 ceiling exhaust fans (4 fans for each roadway) and 8 fans that supply air through side vents uniformly distributed along one wall for each roadway. All fans can operate in reverse mode. Therefore, fresh air may be supplied at either the ceiling (fans VE-151 through VE-254), or by fans VA-101 through VA-204 through the side vents. In the exhaust mode, fans VE-151 through VE-254 can operate at 30 or 60 Hz, and in the supply mode they can only operate at 60 Hz. In the supply mode, fans VA-101 through VA-204 can operate at: 30, 40, or 60 Hz. In the exhaust mode, these fans can only operate at 60 Hz.
1.2 CFD Model
SOLVENT was developed as a tunnel ventilation model that can simulate the interactive effects of a tunnel fire and the ventilation system to determine the tenable regions in the tunnel. The model is applicable to different ventilation modes, including longitudinal ventilation using jet fans, transverse ventilation, and natural ventilation[1].
SOLVENT is based on the general-purpose CFD code COMPACT-3D[3]. It employs the
buoyancy-augmented k-ε model[4] to represent turbulent transport and includes component models for jet fans, ventilation ducts, fire, radiation heat transfer, and smoke. The SIMPLE algorithm is used to calculate the pressure field. The algebraic equations are solved using the line-by-line TriDiagonal-Matrix Algorithm supplemented by a block-correction procedure.
The wall boundary is treated using the wall function approach. The fire is represented as a source of heat and mass. The model does not simulate the combustion process. Instead, the heat release rate due to combustion is prescribed as a volumetric heat source in a postulated fire region.
The boundary conditions at the tunnel portals can be specified as inflow/outflow boundaries or as "free" boundaries with known values of pressure, depending on the physical situation being modeled. At an inflow boundary, values of all variables are specified. At an outflow boundary, the diffusion flux is assumed to be zero and the normal velocity components are adjusted to ensure the overall conservation of mass. The model also has provision for the introduction of entrance loss and differential pressures at the portals to represent wind effects.
2 AIRFLOW MEASUREMENTS
Assuming a fire located between the north ventilation tower and the mid-tunnel in the North Roadway (at a distance in the range of 355 to 615 m from the north portal), two fire scenarios were used for the ventilation tests. One fire scenario is located near the mid-tunnel (at a distance in the range of 555 to 615 m from the north portal) and the second close to ventilation fan VE-153 (at a distance in the range of 355 to 555m from the north portal), Figure 1. For these fire locations, one emergency ventilation scenario (hereinafter referred to as “main scenario”) was activated which used the fans: VA-103 (supply mode – 60 Hz), VA-201 (supply mode – 60 Hz), VE-151 (exhaust mode – 60 Hz), and VE-153 (exhaust mode – 60 Hz). After conducting flow measurements of the main scenario, VE-251 fan was activated in the supply mode, in addition to the already-active fans of the main scenario (hereinafter referred to as “secondary scenario”). Airflow temperature and pressure difference (at side vents) measurements were made for both the main and secondary scenarios at selected side vents (VA-101, VA-103, and VA-201), ceiling vents (VE-151, VE-153, VE-251, and VE-253) and at several tunnel cross-sections. Additional measurements were conducted using weather stations at the two portals, in the tunnel, and within the evacuation passage (VA-103 duct). Flow measurements were also conducted at a few locations across the tunnel for the secondary scenario. Air temperatures were used to compute the air density.
Air speed and temperature were measured using a vane anemometer. The meter uses a remote wheel that freely rotates in response to airflow, and has a built-in thermostat. The vane anemometer can measure air velocity and temperature in the range of 0.40 to 25 m/s and 0 to 60oC, respectively, with resolutions of 0.1 m/s and 0.1oC. The accuracies of measurements are ±2% of the reading for the velocity and ±0.8oC for the temperature. The pressure difference was
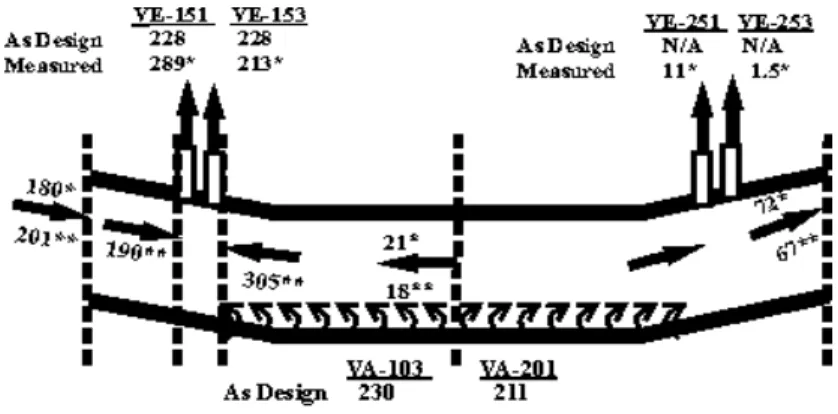
measured using a digital micro-manometer. The device is capable of measuring both air velocity (up to 100 m/s) and pressure difference (up to ±6000 Pa) with high resolution (0.1 m/s and 0.1 Pa). The airflow conditions were also measured using a weather station at several cross-sections in the tunnel. The weather station data was compared with data measured using the vane anemometers. The comparisons are shown in Figures 2 and 3.
Figure 2: Flow distributions in the tunnel – main scenario
The airflow balance in the tunnel was carefully considered during the tests, especially for the main scenario, as a check of the various airflow measurements. The net airflow (out of the tunnel) was calculated to be about 34.5 m3/s or 43.1 kg/s (assuming an air density
of 1.25 kg/m3 at an ambient
temperature of 9oC). As will be demonstrated in the numerical section, it is believed that this net airflow out of the tunnel may be attributed to the underestimation of airflow at the south portal.
Figure 3: Flow distributions in the tunnel - secondary scenario
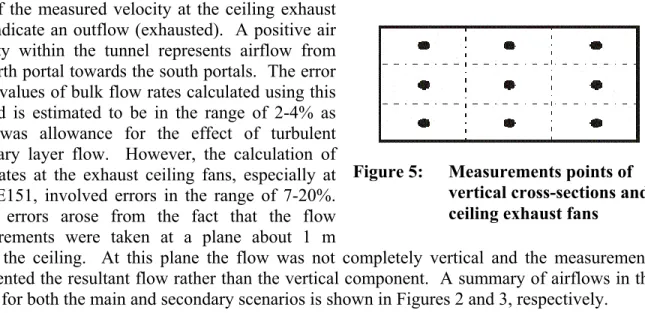
Air temperatures and speeds were measured at selected upper and lower side vents in the North Roadway. The differential pressure between the tunnel environment and the evacuation passage was also measured at the lower vents. The selected side vents were located at the beginning, quarter points, and the end of the side ventilation ducts to provide information on airflow in each duct. The air speed was measured at 5 points for the lower vents and at 3 points for the upper vents (Figure 4). Air velocities were also measured at 9 points
at the two portals and the middle of the tunnel (Figure 5). Figure 4: Measurements points of side vents In order to determine the bulk flow at a given location, the cross-section was divided into 3, 5, or 9 sub-areas associated with the measurements points. The velocity of air at each point was considered to represent the entire sub-area. The bulk flow was then computed by multiplying the air velocity by its corresponding sub-area and then adding the results for all sub-areas. A positive
sign of the measured velocity at the ceiling exhaust fans indicate an outflow (exhausted). A positive air velocity within the tunnel represents airflow from the north portal towards the south portals. The error in the values of bulk flow rates calculated using this method is estimated to be in the range of 2-4% as there was allowance for the effect of turbulent boundary layer flow. However, the calculation of flow rates at the exhaust ceiling fans, especially at fan VE151, involved errors in the range of 7-20%. These errors arose from the fact that the flow measurements were taken at a plane about 1 m
below the ceiling. At this plane the flow was not completely vertical and the measurements represented the resultant flow rather than the vertical component. A summary of airflows in the tunnel for both the main and secondary scenarios is shown in Figures 2 and 3, respectively.
Figure 5: Measurements points of vertical cross-sections and ceiling exhaust fans
A positive pressure difference value indicates that the pressure inside the ventilation duct is larger than that in the tunnel roadway, resulting in airflow from the duct into the tunnel (positive velocity). It is important to ensure positive values of pressure difference to maintain a smoke-free escape route in the duct for tunnel users.
2.1 Results
The airflow measurements at the side-vents indicated negative airflow velocities at some vents within the ventilation ducts VA-103 and VA-201. The negative airflows are attributed to the high airflow inside the ventilation ducts that created a local flow vorticity inside the thick vent opening. This introduced a region of reversed airflows and therefore negative velocities. However, these local effects did not affect the main flow direction from the ventilation duct into the tunnel area.
This phenomenon was confirmed by releasing cold smoke bombs at different locations in the tunnel, representing smoke and fire effluent sources. No smoke was observed within the two ventilation ducts and the results indicated airflow was into the tunnel. The ventilation fan VA-101 was not activated as part of the selected ventilation scenario. However, low positive airflow velocities were measured at the side vents in this section of the supply system. The airflow conditions were also measured, using the weather station, within the ventilation duct VA-103. The air speed was 14.5 m/s indicating a dynamic pressure of approximately 131 Pa.
During the cold smoke tests, it was observed that smoke was efficiently cleared when the smoke source was placed close to exhaust fans VE-151 and VE-153. However, when the source was placed near the middle section of the tunnel, it took longer for the smoke to clear as a result of low airflow velocities in this section of the tunnel (Figure 2). Further investigation will be done with other scenarios for a fire assumed to be in the middle of the tunnel.
By activating the fan VE-251 in the supply mode, higher air velocities were recorded near the middle section of the tunnel (Figure 3). This in turn improved smoke clearance. However, examining the airflow distribution shown in Figure 3, only a small portion of the air supplied by VE-251 (141 m3/s) was directed towards the middle section of the tunnel (about 23 m3/s), which increased the flow at mid-tunnel from 21 to 44 m3/s. The remaining portion of supplied air (118
m3/s) was directed towards the south portal, which increased the flow exiting the portal from 72 to 189 m3/s.
Also shown in Figures 2 and 3, the airflow introduced at the side vents of fan VA-103, together with the air pulled through the north portal, almost balanced the exhausted air at fans VE-151 and VE-153. This, in turn, increased the resistance for air to be drawn from the middle of the tunnel, causing lower airflow velocities at mid-tunnel and beyond. Even with the activation of fan VE-251 in supply mode (secondary scenario), the airflow was mainly directed to the south portal, resulting in little improvement in airflow velocities at the middle of the tunnel. It is believed that most of the flow exiting the south portal is fresh air supplied by fans VA-201 and VE-251.
3 NUMERICAL SIMULATIONS 3.1 Geometry and Boundary Conditions
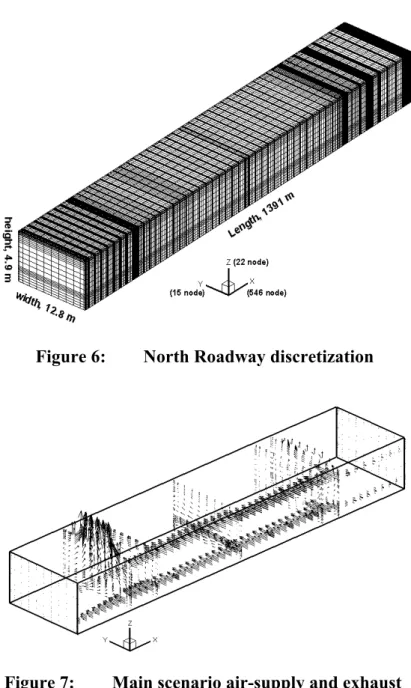
Only the North Roadway of the tunnel was simulated with a mesh consisting of 160,230 control volumes (Figure 6). The mesh was refined around the vents. Two simulations were conducted to represent the two ventilation scenarios: the main and secondary. Both simulations were conducted as a steady state simulation with constant air density (i.e., the energy equation was not solved – cold smoke case). Free boundaries, with the pressure equal to the static ambient pressure, were assumed at the north and south portals. A wall roughness of 0.003 was used to represent the roughness of the concrete
wall surface. Figure 6: North Roadway discretization
3.2 Main Ventilation Scenario
Figure 7 shows the air supply (side walls) and exhaust (tunnel ceiling) boundary conditions of the main scenario. The behaviour of the airflow in the tunnel plays a major role in determining the longitudinal air velocity and, consequently, the ability of a ventilation configuration to clear the smoke and fire products.
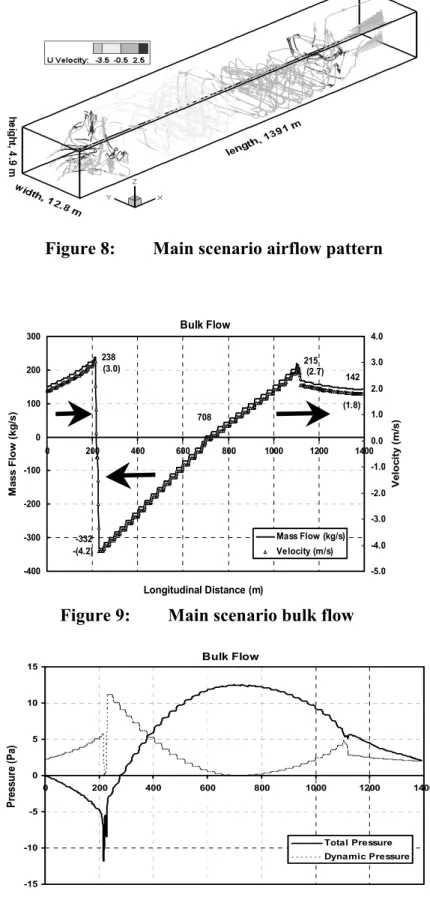
Figure 8 represents the general flow pattern in the tunnel for the main scenario. In Figure 8, the airflow pattern is represented by streamlines of the
velocity vector field. The air supplied through the lower and upper side vents created regions of turbulent flows. Furthermore, the air from the larger upper vents was faster than that from the lower vents, which resulted in more air injected at the top of the tunnel. The air jets forced airflow downwards and created rotational movement of the air. As a result, only a small portion of the tunnel had a longitudinal airflow, near the two portals. These results are in agreement with the field observations that indicated low longitudinal air velocities in the middle section of the tunnel.
Figure 8: Main scenario airflow pattern
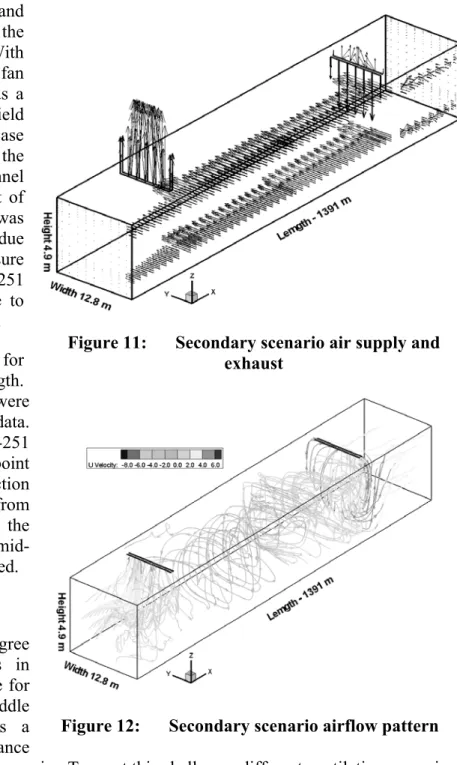
Figure 9 shows the bulk flow for cross sections along the tunnel length. The mass flow compared reasonably with the measured results. The results indicated that there was a stagnant flow zone at the middle of the tunnel (at 708 m from the north portal).
The main goal of the emergency ventilation system is to provide and maintain a smoke-free path for safe evacuation. The L.-H.-La Fontaine tunnel uses the central section that separates the two tubes for evacuation purposes in the event of a fire. It is important, therefore, to maintain a positive differential pressure between the tunnel environment and the evacuation passage to ensure a “smoke-free” escape route. Also, firefighters may use this passage in trying to extinguish the fire. The dynamic pressure was measured inside the ventilation duct VA-103, to be about 131 Pa. Figure 10 shows the average pressure values across the tunnel, indicating that the maximum positive total pressure (near the middle of the tunnel) was less than 15 Pa. Under these conditions, it is expected that most parts of the evacuation path would be smoke-free. Bulk Flow 142 215 708 -332 238 (1.8) (2.7) -(4.2) (3.0) -400 -300 -200 -100 0 100 200 300 0 200 400 600 800 1000 1200 1400 Longitudinal Distance (m) M a ss Fl o w ( k g/ s) -5.0 -4.0 -3.0 -2.0 -1.0 0.0 1.0 2.0 3.0 4.0 V e lo c ity (m /s ) Mass Flow (kg/s) Velocity (m/s)
Figure 9: Main scenario bulk flow
Bulk Flow -15 -10 -5 0 5 10 15 0 200 400 600 800 1000 1200 1400 Longitudinal Distance (m) P ress u re ( P a) Total Pressure Dynamic Pressure
3.3 Secondary Ventilation Scenario
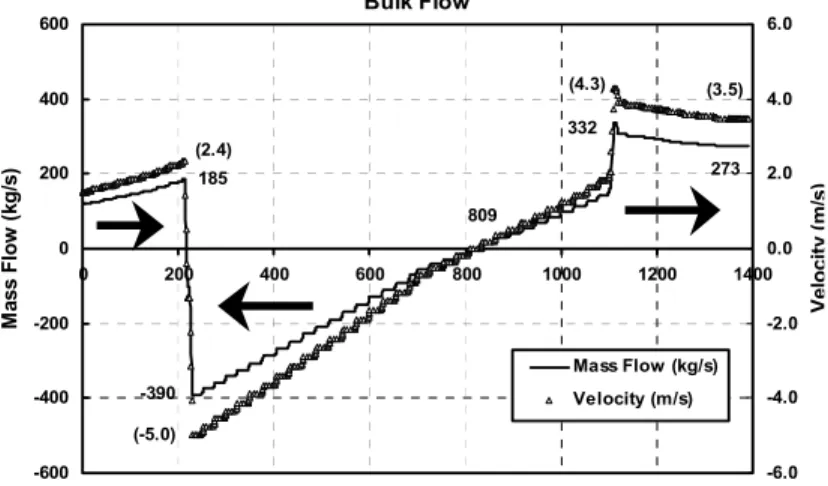
Figure 11 shows the air supply and exhaust boundary conditions under the secondary ventilation scenario. With the activation of ventilation fan VE-251 in supply mode, there was a minimal modification to the flow field in the tunnel. However, as in the case of the field measurements, the conditions at the middle of the tunnel were improved (Figure 12). Most of the flow supplied by VE-251 was directed towards the south portal due to the relatively high positive pressure (about 27 Pa) produced by fan VE-251 (Figure 14) that creates resistance to the flow at the middle of the tunnel. Figure 13 shows the bulk flow for cross sections along the tunnel length. Again, the values of mass flow were comparable to the measured data. Figure 13 shows that, with fan VE-251 operating, the location of zero point velocity moved in the direction opposite to the airflow direction from the fan (809 m versus 708 m for the main scenario). As a result, the mid-tunnel velocity was slightly increased.
Figure 11: Secondary scenario air supply and exhaust
4 CONCLUSIONS
The numerical simulations agree with the field measurements in indicating that smoke clearance for a fire located at or near the middle of the tunnel scheme poses a challenge for smoke clearance
under the activated ventilation scenario. To meet this challenge, different ventilation scenario should be activated with the main goal of increasing the mid-tunnel velocity. This may involve activating fan VE253 in a supply mode which will further push the point of zero velocity towards the south portal allowing for an increase of the mid-tunnel velocity. Another possibility is to activate fan VA103 in the exhaust mode, which is expected to significantly increase the mid-tunnel velocity. However, in this case VA103 duct can not be used as a escape route as the evacuees will be exposed to high temperatures and to the danger of inhaling smoke and fire effluents. For a fire at other locations, it is believed that the current ventilation strategies are sufficient.
No smoke was observed inside the ducts for supply fans VA-103 and VA-201 during the field measurements. This was confirmed from the numerical simulation by examining the pressure values in the tunnel. However, this does not reflect the actual situation of a fire incident where the smoke and fire effluents are hot and buoyant and, therefore, will produce different dynamics. To establish proper operating instructions, the phenomena related to a real fire should be reproduced [5].
The VA ventilation fans can operate with different cycles; 30, 40 or 60 Hz and, therefore, they could discharge airflow over a wide range. They can also be operated in a reverse mode. In this mode, the upper side vents could be useful in extracting smoke from the upper layer. However, in this scenario, the ventilation ducts could not be used for evacuation purposes. Further numerical investigation will be useful in determining the best use of the side vents to achieve both a “smoke-free” escape route and minimal air disturbance throughout the tunnel.
Bulk Flow 273 332 -390 185 (4.3) (3.5) (-5.0) (2.4) 809 -600 -400 -200 0 200 400 600 0 200 400 600 800 1000 1200 1400 Longitudinal Distance (m) M ass F lo w ( k g /s) -6.0 -4.0 -2.0 0.0 2.0 4.0 6.0 V e loc it y (m /s ) Mass Flow (kg/s) Velocity (m/s)
Figure 13: Secondary scenario bulk flow
Bulk Flow -10 -5 0 5 10 15 20 25 30 0 200 400 600 800 1000 1200 1400 Longitudinal Distance (m) P re s su re ( P a) Total Pressure Dynamic Pressure
Figure 14: Secondary scenario pressure distribution
The air velocity in the evacuation passage was 14 m/s with VA-103 at maximum capacity. It might be difficult to walk against such a high airflow during evacuation. Lower velocities should be used to facilitate movement in the evacuation passage (11 m/s [6]).
The main purpose of the paper is to compare the predicted against the measured flow values. Therefore, escape doors were assumed closed. However in a fire event, some doors will be opened intermittently during evacuation and fire fighting, and some doors may even be blocked open. In principal, when a door is opened in the fire region, airflow through the door should be sufficient to prevent smoke backflow. This is achieved by marinating a positive pressure difference between the escape routes (fan ducts) and the roadway. Further numerical simulations should be conducted to investigate the effect of opening certain doors especially those doors close to the air supply injection point.
5 REFERENCES
1. Innovative Research, Inc./Parsons Brinker-hoff, Inc., “Solvent Version 1.0”, Innovative Research, Inc./Parsons Brinkerhoff, Inc., 2000.
2. K.B. McGrattan, H.R. Baum, R.G. Rehm, G.P. Forney, J.E. Floyd, and S. Hostikka., “Fire Dynamics Simulator (Version 2), Technical Reference Guide”, Technical Report NISTIR 6783, National Institute of Standards and Technology, Gaithersburg, Maryland, August 2001. 3. Innovative Research, “Reference Manual for COMPACT-3D”, Innovative Research, Inc.,
Minneapolis, 1998.
4. Wilcox, D.C., Turbulence Modeling of CFD, DCW Industries, Inc., California 91011, 1993. 5. Lacroix D., “The New PIARC Report on Fire and Smoke Control in Road Tunnels”, Third
International Conference on Safety in Road and Rail Tunnels, Nice, France, p. 185-97, 1998. 6. National Fire Protection Association, “NFPA 502 Standard for Road Tunnels, Bridges, and