HAL Id: hal-03188333
https://hal.archives-ouvertes.fr/hal-03188333v2
Submitted on 10 Apr 2021
HAL is a multi-disciplinary open access
archive for the deposit and dissemination of
sci-entific research documents, whether they are
pub-lished or not. The documents may come from
teaching and research institutions in France or
abroad, or from public or private research centers.
L’archive ouverte pluridisciplinaire HAL, est
destinée au dépôt et à la diffusion de documents
scientifiques de niveau recherche, publiés ou non,
émanant des établissements d’enseignement et de
recherche français ou étrangers, des laboratoires
publics ou privés.
Lithium niobate ultrasound transducers for
high-resolution focused ultrasound surgery
Spiros Kotopoulis, Han Wang, Sandy Cochran, Michiel Postema
To cite this version:
Spiros Kotopoulis, Han Wang, Sandy Cochran, Michiel Postema. Lithium niobate ultrasound
trans-ducers for high-resolution focused ultrasound surgery. 2010 IEEE Ultrasonics Symposium (IUS), Oct
2010, San Diego, CA, United States. pp.72-75, �10.1109/ULTSYM.2010.5935943�. �hal-03188333v2�
Lithium Niobate Ultrasound Transducers for
High-Resolution Focused Ultrasound Surgery
Spiros Kotopoulis
1,2, Han Wang
3, Sandy Cochran
3, Michiel Postema
1,21 Emmy-Noether Group, Institute of Medical Engineering, Department of Electrical Engineering and Information Sciences,
Ruhr-Universität Bochum, D-44780 Bochum, Germany
2 Department of Engineering, The University of Hull, Kingston upon Hull HU6 7RX,
United Kingdom
3 Institute for Medical Science and Technology, University of Dundee, Dundee DD2 1FD, United Kingdom
spiros.kotopoulis@googlemail.com
Abstract — Focused ultrasound surgery (FUS) is usually based
on frequencies below 5 MHz, typically around 1 MHz. Whilst this allows good penetration into tissue, it limits the minimum lesion dimensions that can be achieved. In the study reported here, we investigated devices to allow FUS at much higher frequencies, therefore in principle reducing the minimum lesion dimensions. We explain the methodology we have used to build high-frequency high-intensity transducers using Y-36o cut
lithium niobate. This material was chosen as its low losses give it the potential to allow very high-frequency operation at harmonics of the fundamental operating frequency. A range of single element transducers with a centre frequency between 6.6 MHz and 20.0 MHz was built and the transducers’ efficiency and acoustic power output were measured. A focussed 6.6-MHz transducer was built with multiple elements operated together and tested using an ultrasound phantom and MRI scans. It was shown to increase phantom temperature by 32OC in a localised
area of 2.5 mm × 3.4 mm in the plane of the MRI scan. This study therefore demonstrates that it is feasible to produce high-frequency transducers capable of high-resolution focused ultrasound surgery using lithium niobate.
Keywords- FUS; high frequency; lithium niobate; high resolution; transducer manufacture; MRI compatibility
I. INTRODUCTION
Focused ultrasound surgery (FUS) is based on the application of high intensity focused ultrasound (HIFU) to heat tissue to a temperature that causes protein denaturation and coagulative necrosis [1]. The required temperature is typically around 60oC. The frequency of ultrasound used is generally around 1 MHz, generating characteristic ellipsoidal lesions on the order of 1 cm in length. Higher frequencies in the region of 4 MHz are also used where more precise treatment is needed, for example in the prostate. At such frequencies, conventional piezoelectric transducers can be used, based on hard piezoceramic with high drive capability.
In this paper, we consider the type of device that could be used to apply HIFU at much higher frequencies, with our research ultimately targeting 50 – 100 MHz. Piezoceramic is expected to be incapable of sustaining sufficiently high-power operation at such frequencies and, instead, we have based our investigation on lithium niobate, LiNbO3 [2]. As a single
crystal, this can be thinned easily, it can sustain high electric fields, and its low losses allow harmonics to be used.
II. METHODOLOGY
A. Lithium niobate
As it was expected that piezoceramics would be unable to produce HIFU because of de-poling or cracking, we have explored Y-36o LiNbO3. As well as its basic advantages, it
has a high resonant frequency of 3.3 MHz mm-1, thus
allowing for thicker elements at high frequencies for cost effective manufacturing compared to piezoceramics.
Figure 1. Transducer manufacturing: (a) position of plates in single wafer used for the transducers, (b) dimensions of plates for each transducer, (c) computer-aided design representations of transducers, and (d) completed
transducers. This work has been supported by DFG Emmy Noether Programme
Grant 38355133, and UK EPSRC Grants EP/F037025/1 and EP/G01213X/1.
B. Transducer manufacture
Three different transducer designs were prepared as shown in Fig. 1: unfocused single elements with 17 mm square LiNbO3 plates (Txdr 1); a 2D faceted bowl with three
pentagonal and four hexagonal plates to mimic a spherically-focused device (Txdr 2); and a 1D faceted cylindrical section with five rectangular plates to mimic a cylindrically focused device (Txdr 3). Txdr 2 had an equivalent radius of curvature of 50 mm and Txdr 3 an equivalent radius of curvature of 30 mm.
To prepare the plates for each transducer, Y-36o cut,
3-inch diameter, 0.5-mm thick LiNbO3 wafers (Boston
Piezo-Optics, Inc, Boston, MA, USA) were obtained, polished on one side and lapped on the other. Figure 1 shows the position of each element from each wafer for each of the three transducer designs. Separation of the plates was performed with a programmable APD1 saw (Logitech Ltd, Glasgow, UK) with a spindle speed of 2900 rpm and a feed rate of 0.160 mm s–1.
For the Txdr 1 devices, the 11 square elements cut from a single wafer were lapped individually in steps of 30 µm starting from 500 µm down to 200 µm using a PM5 precision lapping and polishing machine (Logitech, Glasgow, UK). The force applied during lapping was adjusted depending on the sample size, typically in the range 400 - 900 g. A slurry of 20-µm calcined Al2O3 powder in water was used as abrasive.
Once the elements reached within 25 µm of the target thickness, 9-µm calcined Al2O3 powder was used to avoid
scratching. The lapping machine was programmed to ensure maximum flatness.
The true thicknesses of the samples were measured and verified at regular intervals. Once each element was flat at the desired thickness, it was removed from the glass plate, cleaned and re-measured to verify the thickness. The elements were continuously checked using a stereo microscope for flaws which could act to concentrate stress and lead to cracking.
An electrode was painted on to the lapped side using ELECTRODAG 1415 silver paint (Acheson Colloids BV, Scheemda, Netherlands). Excess paint around the edges was removed using a scalpel and acetone. The polished side of each element was then attached to the adhesive side of Adwill D-210 UV tape (Lintec of America, Inc., AZ, USA). RG174A/U 50 Ω coaxial cable was used, connected to the plates with Ag-loaded conductive epoxy, curing taking place at 80 oC for 10 min.
For Txdr 1 devices, Cu tubing with an internal diameter of 28 mm was cut into lengths of 50 mm and placed over the LiNbO3 plates onto the adhesive side of the UV tape. Epoxy
was then introduced around the LNO plate to join it to the Cu tube. The case for the 2D faceted array, Txdr 2, had a height of 75 mm, outer diameter of 70 mm and wall thickness of 2 mm. The case for the curvilinear array, Txdr 3, had a height of 75 mm, outer diameter of 50 mm and wall thickness of 1.5 mm.
For operation within a magnetic resonance imaging (MRI) system, the cases for Txdr 2 and 3 were plastic and coated with a thin layer of Ag paint so that they could be used as the
electrical ground connection to the front face of the transducer.
To support the fragile LiNbO3, Epofix resin (Struers,
Solihull, UK) was mixed with S38 glass microballoons (Lawrence Industries, Tamworth, UK) with a weight ratio of 65:35. The microballoon-epoxy mix was poured into the transducer shell. Txdr 1 devices were filled to a depth of 16 mm and Txdr 2 and 3 to a depth of 22 mm, respectively. It was found that the acoustic output with the backing material was reduced by 5% compared to devices made without backing. The backing was left to cure at room temperature. The earth cable was attached to the shell using conductive Ag epoxy. The UV tape was then exposed to UV light and peeled off. Any remaining residue of adhesive was removed manually.
The exposed polished surface of LiNbO3 was cleaned with
solvent then the front surface and part of each case were painted with Ag paint. The cases were then filled with 5368 silicone (Henkel AG & Co. KGaA, Düsseldorf, Germany) to waterproof the cables, and 50-Ω BNC RG-174 plugs were connected to the coaxial cables.
C. Acoustic pressure
Each transducer was driven by a continuous wave at its fundamental frequency, generated by a waveform generator (AFG3102, Tektronix, Berkshire, UK). The signal was passed through a –20-dB attenuator before being used as the input to a power amplifier. The single element transducers were tested using a +55-dB RF amplifier (3100LA, Electronics & Innovation, NY, USA). To test Txdr 2, the pentagonal elements were linked and driven by a +50-dB RF amplifier (2100LA, Electronics & Innovation, NY, USA) and the hexagonal elements were linked and driven by the 3100LA amplifier. The pressure outputs were measured using a calibrated fibre-optic hydrophone (Precision Acoustics, Dorset, UK). Txdr 3 was tested using a 150A250, 150W RF amplifier (Amplifier Research, PA, USA). The acoustic
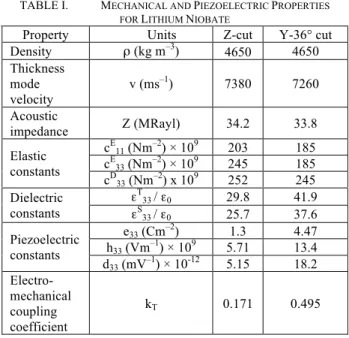
TABLE I. MECHANICAL AND PIEZOELECTRIC PROPERTIES FOR LITHIUM NIOBATE
Property Units Z-cut Y-36° cut
Density ρ (kg m–3) 4650 4650 Thickness mode velocity v (ms –1) 7380 7260 Acoustic impedance Z (MRayl) 34.2 33.8 cE 11 (Nm–2) × 109 203 185 cE 33 (Nm–2) × 109 245 185 Elastic constants cD33 (Nm–2) x 109 252 245 εT33 / ε0 29.8 41.9 Dielectric constants εS33 / ε0 25.7 37.6 e33 (Cm–2) 1.3 4.47 h33 (Vm–1) × 109 5.71 13.4 Piezoelectric constants d33 (mV–1) × 10-12 5.15 18.2 Electro-mechanical coupling coefficient kT 0.171 0.495
pressure was measured 13 mm from the transducer face using a piezoelectric hydrophone (HGL-0200, Onda, CA, USA).
D. LNO properties
Data available for the properties of Y-36o LiNbO 3 were
found to be limited and incomplete in the literature so values for one-dimensional simulation were obtained with PRAP version 2.2 software (TASI Technical Software Inc, Ontario, Canada) using electrical impedance data from a plate measured with an impedance analyser (4395A, Agilent, CA, USA). Table 1 shows the measured properties for Y-36o cut
LiNbO3, with figures for Z-cut material shown for
comparison. The resonance frequencies of the transducers were also measured using the same impedance analyser.
E. Acoustic radiation
The acoustic radiation force output of the transducers was measured using an EMS Model 67 ultrasound radiation force balance (EMS Physio Ltd, Oxfordshire, UK). The transducers were placed within 20 mm of the surface of the ultrasound absorber in this balance to ensure that effectively the total radiated flux was incident on it. The output voltage of the waveform generator was increased and the amplifier forward and reflected power, and the transducer acoustic power were recorded.
F. MRI temperature measurements
MRI guidance is used for FUS [3] as it allows precise targeting of the HIFU field and direct temperature measurement at the focus. For MRI-guided focused ultrasound surgery (MRgFUS) tests in the present work, Txdr 3 and a DQA Gel Phantom (ATS Laboratories, CT, USA) were placed in a GE Signa HDx 1.5 T MRI system (GE Healthcare, CT, USA). A gradient echo planar image (EPI) was recorded with TE = 17.0 ms, ER = 230.0 ms and BW at 62.0 kHz to capture the temperature increase of the phantom. Txdr 3 was turned on at t = 0 s with an input voltage of 101 V pk-pk, equivalent to 8 W acoustic power and 32 W electrical power. The transducer was turned off after 55 s. The size of
the acoustic focus was determined by the area heated to above the surrounding ambient temperature.
III. RESULTS AND DISCUSSION
A. LNO properties
The resonant frequency and third harmonic of the Txdr 1 devices made with different LiNbO3 thicknesses are compared
to one-dimensional modelling (ODM) for both Z-cut and Y-36° cut LiNbO3 in Fig. 2. Although the Z-cut material gives
a higher frequency for a given material thickness, other key properties such as d33 and kT are much lower, hence the
preference for Y-36° cut material.
B. Acoustic pressure
Txdr 1 devices produced maximum pk-pk pressure of 14 MPa at the natural acoustic focus at 12 mm at the fundamental frequency of 6.6 MHz, and over 6 MPa and 4 MPa at the 3rd and 5th harmonics respectively, corresponding to frequencies (wavelengths) of 21 MHz (77 µm) and 35 MHz (44 µm). Txdr 2 generated a sound field with a modulated output envelope frequency of 550 kHz, because of the use of the two power amplifiers, and a signal frequency of 6.6 MHz with a pk-pk pressure of 24.3 MPa, equivalent to a mechanical index, MI = 4.7. The modulation could be varied by changing the relative phase of the two groups of elements. Txdr 3 generated a maximum pk-pk pressure of 16.7 MPa at the fundamental frequency of 6.6 MHz, equivalent to MI = 3.3.
C. Acoustic radiation
The acoustic power generated by the Txdr 1 devices is shown in Fig. 3. Efficiency for these devices was found to be 33 ± 5% throughout the frequency spectrum. A commercial 3.28-MHz, 50-mm diameter HIFU transducer made with piezoceramic was found to have an efficiency of 20 ± 1%. Txdr 3 had an efficiency of 25 ± 2%.
Figure 3. Acoustic power as a function of transducer input voltage for single element LiNbO3 transducers.
Figure 2. Resonance frequency and third harmonic as a function of element thickness for single element LNO microsphere backed
transducers. Grey lines show 3rd harmonic.
Z-cut LiNbO3 simulations
Experimental measurements Y-36° cut LiNbO3 simulations
D. MRI temperature measurements
Fig. 4 is an MRI image of Txdr 3 positioned on the DQA gel phantom. There are cavitation-related artefacts in the vicinity of the front face of the transducer but none at its focus. Fig. 5 shows the area heated by Txdr 3 in the plane of the MRI scan, aligned with its focus. The surface area of heating after 55 s of sonication was 2.5 mm × 3.4 mm. Within 31 s the temperature in the acoustic focus of the transducer had increased 18oC above ambient to a temperature of 38oC.
A peak temperature of 52 oC was reached after 55 s of
sonication, 32 oC above ambient, as shown in Fig. 6.
IV. CONCLUSIONS
In conclusion, we have shown that it is feasible to manufacture high-frequency, high-intensity, focussed ultrasound transducers based on Y-36° cut LiNbO3. In a range
of tests, we have demonstrated operating frequencies up to more than 50 MHz using the 3rd harmonic of 200-µm thick
LiNbO3, focal pressures of 4 MPa at 35 MHz, and MI = 4.7 at
6.6 MHz. Two of the devices we made, with faceted bowl and faceted cylindrical sections respectively, were designed to be operated under MRI guidance. We have shown that this design was successful and have used one of the devices to increase the temperature within a gel phantom, measured with MRI, to more than 50oC following sonication of 55 s.
As the work reported here was exploratory, improvements could be made in the transducer manufacture. Thin film Cr-Au would be better acoustically and electrically than electrodes of conductive Ag paint. The cases of the devices for MRI guidance were made with plastic tubing coated with Ag paint. Elsewhere, we report use of Cu-epoxy [4] which would aid manufacture and reliability. The thin LiNbO3
piezoelectric elements were supported by microballoon-filled epoxy backing; this reduced the transducer output so it would be worth exploring still lower acoustic impedance materials or other ways to support the plates. Finally, electrical impedance matching was neglected. However, as frequency increases, electrical impedance decreases and sustained operation would be enhanced by electrical impedance matching.
ACKNOWLEDGEMENTS
The authors thank Logitech Ltd, Glasgow, UK for the lapping / polishing and dicing equipment and InSightec Ltd, Haifa, Israel for assistance with the MRI measurements.
REFERENCES
[1] J.-R.Wu and W.Nyborg (Eds.). Emerging Therapeutic Ultrasound. World Scientific, Hackensack, 2006.
[2] R. S. Weis and T.K. Gaylord, “Lithium niobate: Summary of physical properties and crystal structure,” Appl. Phys. A, vol. 37, pp. 191–203, 1985.
[3] F.A.Jolesz and K.A.Hynynen (Eds.). MRI-guided focused ultrasound
surgery. Informa Healthcare, New York, 2007.
[4] B.Gerold, S.Reynolds, A.Melzer, and S.Cochran, “Early Exploration of MRI-compatible Diagnostic Ultrasound Transducers”, Proc. IEEE Ultrason. Symp., 2010.
Figure 6. Temperature increase as a function of time for Txdr 3 at acoustic focus in ultrasonic phantom measured with MRI. The grey
line indicates the temperature of the eight surrounding pixels.
Figure 4. MRI scan of sonication setup showing phantom and transducer. The transducer generated negligible artefacts in the MRI
image.
Figure 5. MRI scan of sonication area. The focal region has a size of 2.5 mm × 3.4 mm. The green area represents pixels of equal temperature, the blue area is the expected acoustic path, whereas the red area represents


![[PDF] Support de formation d’initiation à l'administration de PrestaShop | Formation à télécharger en PDF](data:image/gif;base64,R0lGODlhAQABAIAAAP///wAAACH5BAEAAAAALAAAAAABAAEAAAICRAEAOw==)