Thomas J. Allen
WP# 3251-91-BPS January 1991
© 1991 Massachusetts Institute of Technology
Sloan School of Management Massachusetts Institute of Technology
50 Memorial Drive Cambridge, MA 02139
The authors wish to thank the management and engineers of the two firms, who must remain anonymous but without whose help and encouragement this study would not have been possible.
three levels: design, analysis, and communication. Seventy-five engineers in two gas turbine engine manufacturing companies were surveyed to understand the relationship between these three types of CAD use and engineering performance. The results show strong links between different
types of CAD use: use for design enables use for analysis;
three-dimensional design enables use for communication. Use of CAD communication features strongly relates to engineering performance. The results have implications for the design, implementation, management, and use of CAD systems.
INTRODUCTION
Computer-Aided Design (CAD) has, in recent years, become an important and widely used technology. CAD systems have the potential to improve design quality, cut design costs, and shorten the development time of new products. Companies have invested large amounts in the systems and are becoming very dependent on CAD technology for the development of new products. Yet the effective application of CAD technology has proven to be a difficult task in many companies. Many managers feel that CAD systems have not delivered the benefits expected of them (Wells 1987). The results of years of CAD research show mixed and inconclusive results (Majchrzak and Salzman 1989). Even when CAD technology is applied in ways that produce ostensible gains, these gains may not translate into overall improvements in product development effectiveness (Adler 1990).
The mixed results, reported by both the analysts and practitioners, can be attributed to widely varying perceptions of the technology and its capabilities. These perceptions affect how CAD technology is applied, and will thus affect the benefits received from the technology. In a previous paper, Robertson and Allen (1990) developed a framework which categorizes perceptions of CAD systems. This forms the basis for the hypotheses tested in the present study. The hypotheses are tested using data from a field study conducted in two major companies.
2
Design Engineering
To understand the relationship between CAD systems and engineering performance, it is necessary to understand the nature of engineering work. Design engineering involves the balancing of multiple constraints, each of which must be satisfied and some of which may be contradictory. For example, customer requirements for a gas turbine engine may include such factors as price, weight, fuel economy and performance. An engineer designing engine parts must consider these factors as well as others such as producibility, thermal and mechanical stress, maintainability, and durability. The goal of design is to optimize with respect to a few of these factors, and insure satisfactory performance with respect to all (Cf. Frischmuth and Allen
1 969).
The nature of engineering work leads to a process which is highly interdependent. Engineers must coordinate with others in their group to insure proper fit between parts, and must coordinate with those in other groups who analyze the part. Communication is therefore central to an engineer's work.
CAD Systems
Many companies have turned to CAD systems to improve their product development effectiveness. Some companies have found that the use of CAD systems has been associated with an improvement in the quality of the products developed (Crombez 1988, Eade 1988, Vasilash 1988, DeMatthew 1989, Velloci and Childs 1990). CAD
systems have also been used to cut the costs of developing new product designs (Smith 1982, Dutton 1986, Fitzgerald 1987, Lansiaux 1987, Krouse et al. 1989). Finally, some companies have found that the effective use of CAD systems has decreased the amount of time it takes to bring new products to market (Fitzgerald 1 987, Bull 1987, Teresko, 1988, 1990, Manji 1989, Frangini 1990).
Yet other companies have found there is no guarantee that CAD systems will be applied effectively. Surveys of managers show mixed opinions of the technology. Some believe that CAD systems have not delivered the benefits they expected (Wells 1987). A survey of the research that has been done on CAD implementation produced similarly mixed findings (Majchrzak and Salzman 1989).
Adler's (1990) work provides an excellent example of why it is so difficult to use CAD systems effectively. Traditional benchmarking studies, which test the speed with which drawings can be generated and changed, have consistently found that users of CAD systems are more productive than users of drafting boards. Adler found such gains in the companies he studied. Yet Adler also found that these individual gains did not lead to organizational gains. While drawings were produced more quickly, this merely added to the buffer of drawings between groups. Electronic transfer of design data did occur between engineering and manufacturing, but drawings were still being "thrown over the wall" and the only effect of CAD systems was to "perfect the throw."
4
One clear finding that emerges from the CAD literature is that CAD systems do not necessarily cause any organizational changes. Rather, CAD systems enable changes in the way products are developed. To take full advantage of CAD system capabilities, organizations must:
1) understand the capabilities of CAD technology and 2) change work patterns to take advantage of those capabilities.
Yet research shows that both of those steps are difficult. Robertson and Allen (1990) report that many managers do not understand the capabilities of CAD systems, and Adler's work, as well as that of Majchrzak and Salzman (1989), shows that few organizations are making the necessary work process changes.
Research Framework and Hypotheses
Our earlier study found that organizations viewed CAD systems in three very different ways. We now argue that these different perceptions of CAD will lead to different patterns of CAD use.
The three perceptions of CAD correspond to Coleman's (1989) three types of capital:
* Physical capital is defined as the physical assets of the company.
Machines, equipment, and plant facilities are some common examples of this.
* Human capital is defined as the skills and knowledge of workers.
Many companies realize the value of this type of capital and invest heavily in it through in-house training, tuition reimbursement programs, and other educational efforts.
* Social capital is defined as the relationships within a group which
enable the group to perform work tasks more efficiently or more effectively. Social capital is thus not a property of any person; it is a property of the links between people.
A Framework for Classifying Perceptions of CAD Systems
The ways in which we saw organizations viewing CAD fit quite interestingly into the Coleman typology:
* CAD systems as physical capital: Some see CAD systems as
"electronic drafting boards" and use them as they would a drafting board. At this level, they are merely automating the drafting process.
* CAD systems as supporting human capital: CAD can be used to
extend the capabilities of the designer in at least two ways. Three-dimensional CAD is a significantly different medium of design than are two-dimensional CAD systems or drafting boards. Design in two dimensions can lead to what some term "wire-frame fog:" confusion caused by too many lines on a drawing. Three-dimensional designs can be rotated and surfaces
6
can be shaded or lines removed to improve visualization of the design. The result is a fundamentally different process requiring greater skill and concentration (Majchrzak and Salzman 1989),
but with a potential for greater creativity.
The analysis capabilities that are often available in CAD systems also support human capital. Commercially available packages allow the evaluation of a design's thermal and mechanical stress characteristics, vibration characteristics, or kinematic behavior. Such packages can improve the engineer's understanding of the capabilities and limitations of a particular design alternative.
* CAD systems as enabling improvements in social capital: CAD
systems can be used to improve the communication of design information within and between companies. CAD systems can act as a medium of communication in two ways: through CAD file transfer or as an aid to conversations. CAD file transfer can be used by an engineer to access other engineers' designs to understand the nature of other designs or to check the fit between parts. This access lets the engineer quickly get answers to design-related questions without having to track down or interrupt other engineers.
CAD systems can also be a valuable aid to conversations, as they provide a flexible and unambiguous design representation.
and have different effects on the design than do conversations in front of a whiteboard or engineering drawing. The CAD representation of the design can be altered during the conversation, details can be added or removed, and the appearance of the design can be changed to focus on specific design details. Given this common reference, fewer misunderstandings occur and conversations are more effective.
Relating Perceptions of CAD to CAD Use
Different perceptions of CAD systems will lead to different uses of the systems. Davis and his colleagues (Davis, 1989; Davis, et al., 1989) showed that evaluations of computer technology were the best predictors of intention to use the systems, which in turn was the best predictor of actual system use. If an engineer sees CAD systems as physical capital, then the engineer will use the system only for design. If the systems are seen as supporting human capital, then three-dimensional design and analysis will result. If the system is seen as enabling improvements in social capital, communication through CAD will occur.
In the remainder of this paper, specific hypotheses relating these different types of usage to engineering performance are developed. These hypotheses are tested using data collected from two field sites. We will test the idea that individual CAD use patterns relate to
individual performance. Engineering changes will be used as the basis for performance evaluation.
8
Hypotheses
The first two hypotheses relate the different uses to one another. Specifically, we believe that the different uses follow a pattern similar to that of a Guttman scale. Using CAD to extend human capabilities (human capital) is not possible unless the system is used for basic design. Use for communication is more likely to occur if three-dimensional design is done, as three-three-dimensional designs can be more easily integrated to check for fit problems and can be more readily understood by someone unfamiliar with any part of the design.
H1: A CAD system will not be used for analysis or communication unless it is also used for design.
H2: The more a CAD system is used for three-dimensional design the more it will be used for communication purposes.
The remaining hypotheses relate the different types of CAD use to engineering performance. Engineering performance is measured using engineering changes attributable to the individual engineer. Such changes are often very costly but can be prevented by more thorough analysis of the part being designed.
H3: Engineers who use CAD for analysis will exhibit higher performance, than those who only use CAD for design purposes.
even higher performance, as this allows the engineer to understand what other engineers are doing, and to check for fit problems between adjacent parts.
H4: Engineers who use CAD for communication will exhibit higher performance than those who only use it for design or analysis.
Research Design
To test the hypotheses, a field study was conducted. Two gas turbine manufacturers participated in the study; both firms used the same CAD system. Work was organized into engine projects within each company, and projects from each company were selected. The projects were selected to provide a mix between new engine and derivative engine development projects. Very new or very old engine projects were avoided at both sites; it is very difficult to gain access to very new projects. In very old engine groups, little new engineering work is performed.
Individuals who were performing design engineering work were selected from each engine group. Individuals whose work was largely concerned with "downstream" tasks such as testing previously designed parts, understanding field problems with parts, or shepherding parts through the production process were excluded in the sample. All the participating engineers did some downstream work as a small part of their jobs, but each engineer was asked to answer all
10
survey questions as they related to his primary engineering task. To gather valid performance data, we had individuals rated on specific tasks rather than on general competence. This results in more accurate performance measurement (Weekley and Gier 1 989). To increase the validity of the data collection effort, we controlled as much as possible for the type of task performed and the type of CAD system used, while allowing demographic characteristics of the respondents and the ways in which they employed CAD to vary.
Survey Strategy
Two separate surveys were used to collect data: a baseline questionnaire and a daily questionnaire. The daily questionnaire measures CAD use and communication activity and the baseline questionnaire captures all other variables. In addition, interviews were conducted with each engineer's manager after completion of the engineer's main project to measure the engineer's performance on that project.
The baseline questionnaire was distributed and collected during a single meeting. The daily surveys were distributed at the end of randomly chosen days, and the individual reported CAD use and communication activity for that day only. Killworth and Bernard (Killworth and Bernard 1976, Bernard and Killworth 1977) found that this strategy results in the highest accuracy for communication measures. The survey forms were given to the respondents with a standard presentation which did
not reveal the hypotheses of the study. During the presentation, the respondents were asked to focus on their current engineering task and to answer all questions as they related to that task. Confidentiality of individual responses was guaranteed to the respondents.
The Daily Survey
It is important that the correct number of daily surveys be given to respondents. The correct number of surveys must be a balance between accurately sampling communication and CAD usage and unnecessarily burdening the participants. To determine the optimum number of daily surveys to collect, data from another engineering communication study (at a different company) were used. In that study, ten communication surveys were distributed over the course of
two months. Each survey measured who talked to whom
(face-to-face, about technical issues) on a given day. These data were analyzed to understand how well a sub-sample represented the communication network obtained from the total sample.
To test whether the sub-samples are representative of the total sample, the data from different sub-samples of the survey are compared to the total communication from all ten surveys. The resulting correlations are in Table . Sub-samples are chosen to minimize week-to-week variations (for example, the sub-sample of size six was the sum of the 1st, 2nd, 4th, 6th, 8th, and 1 O0th surveys). In addition, the sum of the 1st, 3rd, 5th, 7th, and 9th surveys was compared to the sum of the 2nd, 4th, 6th, 8th, and 1 O0th surveys. The
Judging from the magnitude of the correlations (Table ), it is safe to conclude that the sub-samples represent the total sample well. To reduce the intrusiveness of the survey process (and increase the response rate) five surveys were distributed.
Table I
Correlation Between Total Sample and Given Number of Subsamples
Number of Sub-samples 3 4 5 6 7
Correlation (r) 0.62 0.73 0.80 0.85 0.87
The five daily surveys were given to users over the course of three weeks. The users were asked to fill out the forms only on days on which they were doing design engineering work. The forms were tailored to each engine group. Those groups that the design engineers
worked with most frequently were listed on each form.
In addition to listing the groups for each engineer, possible media for communication were also listed. The media listed were derived from Daft and Lengel's (1986) categorization:
· Face-to-face communication in front of a CAD terminal
* Telephone
* Electronic mail * CAD file transfer
· Memoranda and Letters · Formal reports
The engineer indicated on the survey form whether communication with a particular group occurred and which medium was used.
Measurement of Survey Variables
We will discuss the measurement of three categories of variables: engineering performance, CAD system use, and other variables. The first of these, engineering performance, was measured through an
interview with each engineer's direct manager. Three months after completion of the design, the manager was asked how many engineering change notices, related to the engineer's design, had been submitted that could be directly attributed to that engineer's work. (Engineering changes caused by factors outside the control of the engineer, such as a change in the geometry of an adjacent part, were excluded.) Such changes were of widely varying magnitude. One type of change could be considered more serious than ten changes of a different type. Because of this lack of comparability among engineering changes, it was decided to use a binary measure of performance: engineers are classified as either high performing (no engineering changes attributable to the engineer) or low performing (at least one change attributed). This separation produces sets of 37 high
CAD use for design was measured on the daily survey by asking the engineers whether they used the system for layout or detailing on a particular day. The degree of three-dimensional use was measured by asking the engineer what percentage of CAD design work was done in three dimensions. CAD use for analysis was operationalized as the use of the system for calculating properties of the design or analyzing design characteristics. CAD communication use was measured by asking whether CAD files were sent to another group or received from another group.
The control variables measured were:
* Personal Characteristics: age, level of education, company, time in current position.
· Use of CAD Substitutes: use of pencil and paper or " information technology (such as spreadsheets) for analysis.
· Research Site
tenure in
non-CAD" design or
· Management Orientation: openness of supervisor and top management (as rated by the engineer).
* Organizational Context: perceived cohesiveness of group, perceived openness of group communication, degree to which rewards are based on individual performance, presence of integrating group.
for CAD, perceived quality of CAD training, perceived quality of ongoing CAD support.
Factor analysis is used to reduce the complexity of the variable space. The questions and the results of the factor analysis are reported in the Appendix.
RESULTS
To test Hypothesis H1, the use of CAD design features is crosstabulated with the use of analysis and communication features
(Table II). The Chi-squared statistic indicates that the use of communication features and analysis features are both significantly related to the use of design features.
Table 11
Crosstabulation of Use of CAD Design Features With CAD Analysis and Communication Features
Analysis Features Communication
Features
Used Not Used Used Not Used
Design Used 24 18 18 24
Features Not Used 5 28 7 26
Chi-Squared - Chi-Squared = 3.90
13.74 p < 0.05
16
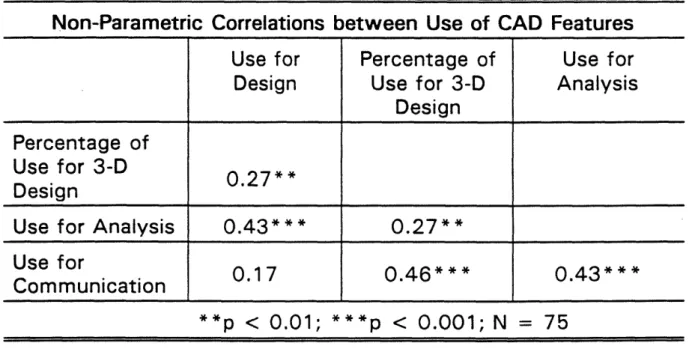
To further test Hypothesis H1, non-parametric correlations (Kendall's tau-b coefficient) are computed between the different measures of CAD use. Non-parametric correlations are used, as the distribution of usage scores is quite skewed. Four variables are compared: CAD use for design, analysis, and communication, and the percentage of design work done in three dimensions (Table III). The results show that the use of design and analysis features are significantly correlated, and that the use of design and communication features are not. The percentage of design done in three dimensions, however, is significantly correlated to the use of CAD communication features. Thus Tables II and III together provide strong support for the hypothesis that use of design features enables use of analysis features, and the hypothesis that 3-D design enables use of CAD communication features.
Table Iil
Non-Parametric Correlations between Use of CAD Features
Use for Percentage of Use for
Design Use for 3-D Analysis
Design
Percentage of
Use for 3-D 0.27
Design
Use for Analysis 0.43* * * 0.27 *
Use for
onUse f ioor n0.17 0.46*** 0.43***
Communication
To test HvDotheses H3 and H4- that use of CAD features is related to engineering performance- a non-parametric test of mean differences was used. The Mann-Whitney U test is used to test whether the behavior of high performing engineers is significantly different from that of low performing engineers. The results (in Table IV) show that the use of CAD communication features is very different between high and low performing engineers. The total amount of communication is also different between the two groups. The differences between the two groups' use of CAD analysis features and time in current position approach significance.
Mann-Whitney U Test of Median Differences Between High and Low Performers
Performance* p
High Low
Use of CAD for Design 3.43 2.35 N.S.
Use of CAD for Analysis 1.70 0.70 N.S.
Use of CAD for Communication 1.16 0.25 0.01 Use of CAD for Paper & Pencil 2.73 2.36 N.S. Design
Use of CAD for Paper & Pencil 3.21 2.75 N.S. Analysis
Use of Other Forms of
Information Technology for 2.41 2.60 N.S.
Analysis
Total Communication 12.32 7.40 0.03
N 37 20
* Mean values are shown. The test, however, was performed on the medians.
T-tests are used to test whether high performers differed from low performers on any of the control variables measured.1 These results
(Table V) show no significant difference between high and low performing engineers on any of the control characteristics.
1 t-tests are valid in this case, since the distributions for control variables do not exhibit
Table V
T-Test of Mean Differences Between High and Low Performers
Age
Time in Position
Tenure with Company
Perceived Openness of Group Communication
Perceived Cohesiveness of Group
Degree to Which Rewards are Based on Individual
Performance
Presence of Integrating Group Perceived Quality of Ongoing CAD Support
Perceived Quality of CAD Training
Management Support for CAD Openness of Supervisor
Openness of Top Management
Performance High Low 31.10 34.7 2.67 3.90 6.83 8.35 0.05 0.07 0.02 -0.05 -0.02 0.01 0.20 t -1.49 -1.03 -0.83 -0.09 p N.S. N.S. N.S. N.S. 0.25 N.S. 0.04 -0.35 N.S. -0.18 -0.30 0.06 -0.43 0.18 0.04 0.13 0.01 0.18 -0.26 1.25 0.35 1.61 0.60 -0.64 1.50 N.S. N.S. N.S. N.S. N.S. N.S.
Crosstabulations are used to test whether high performing engineers have a significantly different level of education or whether the research sites differed in overall performance. The results are reported in Table VI. These results also show no significant differences.
__
t
Crosstabulation of Use of Engineering Performance With Level of Education and Research Site
Level of Education Research Site
Performance No B.S. M.S. No. 1 No. 2
Degree
Low 4 10 6 9 11
High 5 22 10 13 24
Chi-Squared = 0.59 Chi-Squared = 0.53
p = N.S. p = N.S.
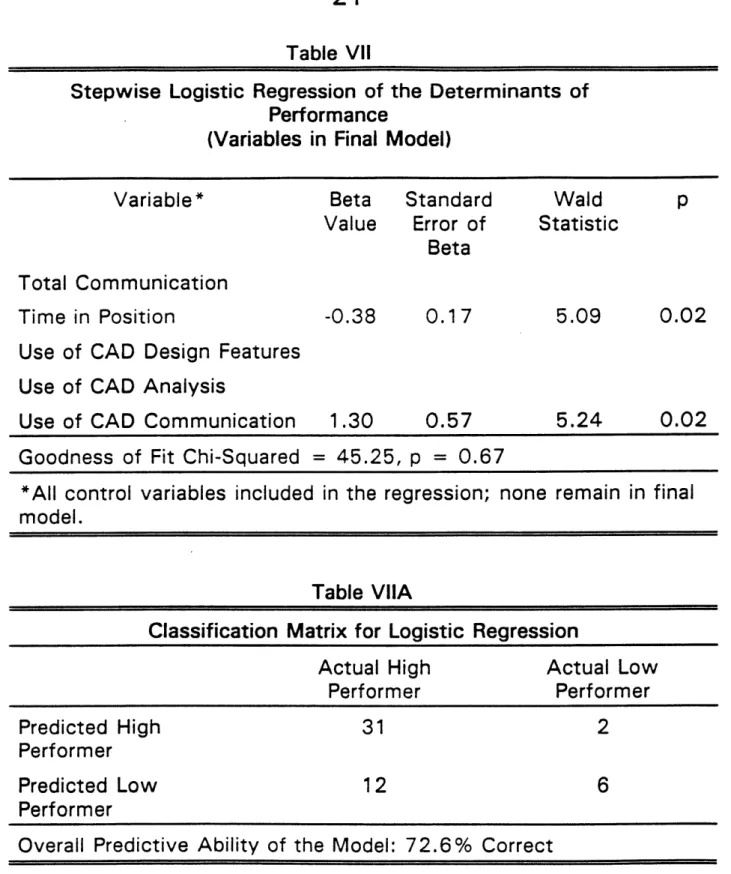
To develop the most parsimonious model of engineering performance, a stepwise logistic regression is performed. The final model (Table VII)
indicates that the best explanation of performance is a function of only two variables: use of CAD communication features and time in
position. Greater use of CAD communication features and less time in position are both associated with higher performance. Time in position is inversely related to performance because, it is an indicator of time between promotions. Good engineers are promoted and therefore spend less time in a given position.
Table VII
Stepwise Logistic Regression of the Determinants of Performance
(Variables in Final Model)
Variable* Beta Standard Wald p
Value Error of Statistic Beta
Total Communication
Time in Position -0.38 0.17 5.09 0.02
Use of CAD Design Features Use of CAD Analysis
Use of CAD Communication 1.30 0.57 5.24 0.02
Goodness of Fit Chi-Squared = 45.25, p = 0.67
*All control variables included in the regression; none remain in final model.
Table VIIA
Classification Matrix for Logistic Regression
Actual High Actual Low
Performer Performer
Predicted High 31 2
Performer
Predicted Low 12 6
Performer
DISCUSSION
There are two reasons why the use of CAD communication features may be related to engineering performance. First, the use of such features lets engineers understand the interrelationships among parts of the product and the relationship of their part to the total product. This facilitates the discovery, among other things, of interferences and other problems of physically fitting together the parts (a major source of producibility problems). Second, providing engineers with the ability to access others' designs gives them an efficient means of answering some types of design questions. CAD file access lets engineers learn the geometric or kinematic details of another part of the design without spending time in face-to-face meetings. When face-to-face meetings do occur, engineers arrive more informed about each others' work.
Tables IV and VII, as well as the research reviewed earlier, show that communication (especially through CAD system file transfer) is related to engineering performance. The direction of causality in the link between use of CAD communication features and performance, however, cannot be determined directly from the present data. It may be that "better" engineers communicate more and use CAD communication features as part of their efforts to communicate (in which case we have learned only how to support good engineers) or it may be that engineers who use CAD communication features can answer many design-related questions more efficiently and can devote more time to design activities, and are thus higher performers. There is, however, a considerable body of evidence showing that technical communication leads to higher engineering performance (Allen, 1984).
To the extent that CAD enables and improves technical communication, it should therefore lead to better engineering performance.
Summary and Conclusions
The findings presented in this paper generally support the hypotheses. CAD use for design enables use for analysis, and three-dimensional CAD use is related to use for communication. Use of CAD communication features is the best performance discriminator in the study.
While we cannot directly conclude that CAD use leads to high performance. Coupling the present results with other evidence certainly supports this possibility.
The results can also help explain the mixed results of the CAD research literature. The results show that different patterns of CAD use can have different relationships with engineering performance. Simply measuring the degree of CAD use or the investment in CAD technology is not sufficient to capture the true relationship between CAD systems and performance. The results also have implications for future research efforts: future studies should measure specific use patterns if they are to understand the impact of the technology on performance.
24
Designers of CAD systems should keep these results in mind and their efforts should be directed to improving the ability to communicate through CAD. Structured message templates are one possible means of accomplishing this. A structured CAD message system would couple a text message template with the ability to capture CAD design geometry and include it in the message. The use of semi-structured messages has been useful in other domains (Malone et al. 1987). A semi-structured CAD message system could aid the engineer's communication of some common messages, such as interference identification or the feedback of analysis results.
CAD systems have had a major impact on the product development function. Yet little attention has been focused on the means by which CAD systems can help support an engineer's communication. Communication is an important part of engineering work, and the study results show that good engineers use CAD systems as one medium of communication. Further development of CAD systems can improve the ability of the systems to support this type of engineering work, and better organizational policies on CAD use can help companies take better advantage of the capabilities of the systems.
Bibliography
Adler, P.A.(1990) Managing high tech processes: The challenge of CAD/CAM, in Von Glinow and Mohrman (eds.) Managing Complexity in High Technology Organizations, New York: Oxford University Press.
Allen, T.J. (1984) Managing the Flow of Technology, Cambridge, MA: MIT Press.
Bernard, H.R. and Killworth, P.D. (1977) Informant accuracy in social network data II, Human Communication Research, 4 pp. 3-18.
Bull, R.J. (1987) Concept to Prototype Using Computing Techniaues, Proceedings of the Institute for Mechanical Engineers Conference on Effective CAD/CAM '87/Towards Integration, November.
Coleman, J.S. (1988) Social capital in the creation of human capital, American Journal of Sociology, Supplemental Issue, pp. S95-S120
Crombez, G.R. (1988) Chrysler builds a better network, Manufacturing Systems, 6, (3) pp. 44-51.
Daft, R.L. and Lengel, R.H. (1986) Organizational information requirements, media richness and structural design, Management
Science, 3, (5) pp. 554-571.
Davis, F.D. (1989) Perceived usefulness, perceived ease of use, and user acceptance of information technology, MIS Quarterly, 13, (3) pp. 319-339.
Davis, F.D., R.P. Bagozzi, and P.R. Warshaw (1989), User acceptance of computer technology: A comparison of two theoretical models, Management Science, 3, (5) pp. 982-1003.
DeMatthew, T. (1989) Productivity by computer-aided design, Automation,
36, (1) pp. 52-54.
26
Dutton, B. (1 986) More tales from the factory floor, Manufacturing Systems, 4, (7) pp. 38-42.
Eade, R. (1988) Screw machining: An industry with nine lives, Manufacturing Engineering, 100, (6) pp. 73-76.
Fitzgerald, K. (1987) Compressing the design cycle, IEEE Soectrum, 24, (10) pp. 39-42.
Frangini, M. (1990, Racing team relies on CAD/CAM to speed up design process, Computing Canada, 16, (17) pg. 10.
Frischmuth, D.S. and T.J. Allen (1969), A model for the description and evaluation of technical problem solving, IEEE Transactions on Engineering Management, 16, (2) pp. 58-64.
Killworth, P.D. and Bernard, H.R. (1976) Informant accuracy in social network data, Human Organizations, 35 pp. 269-296.
Krouse, J. R. Mills, B. Beckert, and C. Potter (1989) CAD/CAM planning guide: Do benefits outweigh costs?, Machine Design, 61, (1 5) pp. S6-S1 2. Lansiaux, P. (1987) CADCAM in Rolls-Royce Aero Engines, Proceedings of the Institute for Mechanical Engineers Conference on Effective CADCAM '87/Towards Integration.
Majchrzak, A. and H. Salzman (1989) Social and organizational dimensions of Computer-Aided Design, IEEE Transactions on Engineering Management, 36, (3) pp. 174-179.
Malone, T.W., Grant, K.R., Lai, K.Y., Rao, R., and Rosenblitt, D. (1987) Semistructured messages are surprisingly useful for computer-supported coordination, ACM Transactions on Office
Information Systems, 5, (2) pp. 115-131.
Robertson, D.C. and T.J. Allen, (1990) Evaluating the Use of CAD Systems in Mechanical Design Engineering, MIT International Center for Research on the Management of Technology Working Paper No. 3-90.
Salzman, H. (1989) Computer-Aided Design: Limitations in automating design and drafting, IEEE Transactions on Engineering Management, 36, (4) pp. 252-261.
Smith, D. (1982) CAD/CAM Productivity Time Ratios for Various Drawing Types, Society of Manufacturing Engineers, Dearborn, Ml.
Teresko, J. (1988) Speeding the product development cycle, Industry Week, 237, (6) (July 18) pp. 40-42.
Teresko, J. (1990) A report card on CAD/CAM, Industry Week, 239, (6)
(March 19) pp. 44-50.
Vasilash, G.S. (1988) Sheet metal processing: Sophisticated simplicity, Production, 100, (4) pp. 53-58.
Velocci, T. and J. Childs (1990) French aerospace: Global leadership, Aviation Week and Space Technology, 133, (Aug 27) pp. S5-S24.
Weekley, J.A. and Gier, J.A. (1989) Ceilings in the reliability and validity of performance ratings: The Case of expert raters, Academy of Management Journal, 32, (1) pp. 213-222.
Wells, C.S. (1987) The Design Supervisor- A Changing Role With CAD?, Proceedings of the Institute for Mechanical Engineers Conference on Effective CADCAM '87/Towards Integration, November.
28
Appendix
Variable Measures and Factor Scores for Control Variables
Factor Analysis of Group Variables
Questionnaire Items F. 1 F.2 F.3 F.4 Perceived Cohesiveness of Group
My group is quite a congenial and cohesive group. 0.76 0.33 0.16 0.09 There is often a great deal of conflict among members of my -0.73 -0.01 -0.16 -0.04 group.
Individually-Based Rewards
I will be rewarded for doing well, even if my group as a 0.07 0.15 0.51 0.18 whole does not do well.
I am judged more on the quality of my group's work than on -0.07 0.29 -0.50 0.21 the quality of my personal work.
Perceived Openness of Group Communication
Team members freely discuss with one another how to resolve 0.07 0.84 0.21 0.28 the product-related disputes that arise within the group.
Group members freely discuss with one another how we 0.32 0.40 -0.02 -0.15 might work together to get a particular part of the work done,
or to deal with a particular problem with the group's work. Presence of Integrating Group
There is another person (or group) who is responsible for 0.04 0.03 -0.03 0.47 ensuring that the different parts of the engine work together
and fit together well.
I am responsible for ensuring that my part of the engine fits 0.10 0.03 0.22 -0.10 and works well with the rest of the project.
Percentage of common variance explained by factor 23.8 9.10 5.70 4.00 Eigenvalue 1.90 0.73 0.45 0.32
Factor Analysis of Management Orientation Variables
Questionnaire Items F.1 F.2
Supervisor Orientation
My supervisor emphasizes cooperation with other groups. 0.29 0.48 My supervisor encourages the reaching of decisions through a blending of 0.38 -0.68
ideas rather than through force.
My supervisor is willing to take the risk of trying something new. 0.04 0.70
My supervisor encourages the open airing of problems and differences of 0.27 0.65 opinion.
Top Management Orientation
My supervisor works well with top management. 0.63 0.47 My supervisor represents my group's needs to top management well. 0.55 0.34 My top management emphasizes cooperation between groups. 0.71 0.11 My top management encourages the reaching of decisions through a blending 0.82 0.29 of ideas rather than through force.
My top management is willing to take the risk of trying something new. 0.46 0.51
My supervisor encourages the open airing of problems and differences of 0.79 0.23 opinion.
Percentage of common variance explained by factor 43.3 8.40 Eigenvalue 4.53 0.84
30
Factor Analysis of CAD Support Variables
Questionnaire Items F.1 F.2 F.3
Perceived Quality of CAD Support
I is easy to gert help when I need to learn a new feature 0.13 0.12 0.95
of the CAD system.
Someone is always available to help in learning new -0.03 -0.35 0.77
features of the CAD system.
Perceived Quality of CAD Training
My CAD training taught me the features of the CAD 0.15 0.87 0.26 system very effectively.
My training did a good job of teaching me the basic 0.05 0.90 0.10 features of the CAD system.
The training I received showed me what jon-related tasks 0.19 0.61 0.34 my CAD system was good for solving.
Management Support for CAD
My supervisor has been trained on or has used CAD 0.72 0.21 -0.02 systems.
My supervisor understands the capabilities and limitations 0.65 0.15 0.16 of CAD systems.
My top management have been trained on or have used 0.84 0.07 -0.04 CAD systems.
My top management understands the capabilities and 0.76 0.02 0.17 limitations of CAD systems.
Percentage of common variance explained by factor 37.6 20.20 11.00