HAL Id: hal-02536166
https://hal.archives-ouvertes.fr/hal-02536166
Submitted on 10 Apr 2020HAL is a multi-disciplinary open access archive for the deposit and dissemination of sci-entific research documents, whether they are pub-lished or not. The documents may come from teaching and research institutions in France or abroad, or from public or private research centers.
L’archive ouverte pluridisciplinaire HAL, est destinée au dépôt et à la diffusion de documents scientifiques de niveau recherche, publiés ou non, émanant des établissements d’enseignement et de recherche français ou étrangers, des laboratoires publics ou privés.
DISCRIMINATING PARASITIC EFFECTS FOR THE
MEASUREMENT OF IMPULSIVE THRUST FROM A
MICROWAVE CAVITY
Jérôme Sokoloff, Olivier Pascal, Olivier Pigaglio, Nathalie Raveu, Hugo Peyre
To cite this version:
Jérôme Sokoloff, Olivier Pascal, Olivier Pigaglio, Nathalie Raveu, Hugo Peyre. PROPOSAL OF A HANDY SETUP FOR DISCRIMINATING PARASITIC EFFECTS FOR THE MEASUREMENT OF IMPULSIVE THRUST FROM A MICROWAVE CAVITY. Progress In Electromagnetics Research C, EMW Publishing, 2020, 98, pp.269-281. �10.2528/PIERC19090507�. �hal-02536166�
Proposal of a Handy Setup for Discriminating Parasitic Effects for
the Measurement of Impulsive Thrust from a Microwave Cavity
J´erˆome Sokoloff*, Olivier Pascal, Olivier Pigaglio, Nathalie Raveu, and Hugo Peyre
Abstract—This paper details the work of the LAPLACE Electromagnetism Research Group to develop an original measuring setup dedicated to the detection of an EMDrive like force. Recent peer-reviewed experimental results [1, 2] were obtained using similar setups based on a torsion pendulum combined with an optical sensor. These very accurate measurement setups are appropriate for measuring such an extremely weak force. They also appear costly, which may discourage other research teams from working on this topic. Our main goal is then to provide an alternative configuration, based on a commercial precision balance, in order to build a measuring setup more affordable, handy, and accurate enough to measure an EMDrive like force. Our experimental system is capable of feeding a truncated cone shaped 2.45 GHz resonant cavity with power up to 140 W. To calibrate the EMDrive force and avoid false positive thrusts, an original setup has been proposed and evaluated. It allows us to really consider that the parasitic effects do not alter the hypothetical force measurement by the use of force direction switching during the measurement.
1. INTRODUCTION
EMDrive is a concept of propellantless electromagnetic thruster which has received controversial media coverage since the 2000’s. It consists in an asymmetric cavity fed by microwave power in a specific resonant mode which could exhibit a non-zero resulting force. The cavity and its feed form a closed system, and this non-zero force challenges Newton’s 3rd law. No theoretical model, accepted by the scientific community, can now explain such a force. It therefore seems that the existence of this very weak force (few hundreds ofµN) depends only on its experimental measurement, which requires sensitive measuring resources and very rigorous protocols. Although very controversial, this kind of propellantlless propulsion could be, if revealed true, a breakthrough in spatial applications.
This contentious atmosphere prompted other research teams around the world to publish their own studies on this topic, both on an experimental level [1–3] and on a theoretical one [4, 5]. In 2016, in the first one of the few peer-reviewed papers, White et al., from Eagleworks Laboratories (NASA Johnson Space Center), stated that their cavity type, named QVPT (quantum vacuum plasma thruster), produced a force with a thrust to power ratio of 1.2 ± 0.1 mN/kW [1]. Following this study, a team of researchers led by McCulloch, from Plymouth University, investigated the controversial theory of quantised inertia that could explain the EMDrive phenomenon [4, 5]. On the other hand, McDonald et al., from Naval Research Laboratory, resumed White’s work and presented, in 2017, their preparations and suspicions of possible side-effects to independently validate or refute the observed phenomenon [6]. In parallel, since 2015 [3], Tajmar and Fiedler from TU Dresden have published several interesting papers about original thrusters. In the last one [2] about the EMDrive topic, K¨oßling et al. presented the tests carried out in 2018. Their measuring setup seems identical to White’s one (same cavity geometry and
Received 5 September 2019, Accepted 23 December 2019, Scheduled 17 January 2020
* Corresponding author: J´erˆome Sokoloff (jerome.sokoloff@laplace.univ-tlse.fr). The authors are with the LAPLACE, CNRS, Universit´e de Toulouse, Toulouse, France.
same main measuring element: the torsion pendulum). However, they implemented several different configurations and at different frequencies, but could not conclude in any final way.
The setups used in the latest research are very accurate and sophisticated. The main goal of this paper is to provide the architecture of an handy experimental setup so that numerous research teams can consider testing a large number of asymmetrical cavities to detect any possible EMDrive thrust. However, in order to raise any doubt about the existence of this force and to accurately measure its strength, White or K¨oßling’s setups will have to be used.
Hence, all the previous works have helped us to identify the difficulties related to the design of this type of measuring setup. We will begin by presenting how White [1], K¨oßling [2], and McDonald [6] solved these problems before detailing our approach in order to propose an alternative experimental setup, more affordable and accurate enough to measure an EMDrive force (Section 2). We will then describe our measurement setup (Section 3) and its use (Section 4).
2. GOALS
2.1. Previous Studies
In this section we will present the solutions developed by White, K¨oßling, and McDonald who are the authors of the most reliable papers [1, 2, 6]. The aim here is to summarize the work they carried out by presenting the methods of measurement, the estimated magnitudes of the effects involved as well as the advantages and drawbacks which emerge from their works. When necessary, we will point out the differences between the chosen options.
Their experimental setup is built around the same main measuring element: a torsion pendulum associated with an optical sensor. This type of measuring setup provides extremely accurate force measurement (overall uncertainty of ±6 µN for White’s setup). However, these instruments have an important inertia which leads to quite long response times. To obtain a correct measurement, the experiments then require fairly long powering times (several tens of seconds) during which the elements under RF power heat up and create parasitic forces. Despite the significant efforts made to minimize these thermal effects, they remain of the same order of magnitude as the force to be measured. These setups are therefore subject to parasitic thermal effects that would be much less important if the measurement was quicker than their quite long time constants.
One of these parasitic effects that affect the force measurement is related to the nature of the measuring device and the heating of the tested cavity. Indeed, expansion and deformation of the cavity and the elements under power can lead to a shifting of the centre of gravity which will induce a parasitic torque because the measurement is made through a pivot point (torsion pendulum) [1].
All the measurement campaigns in these studies were carried out under vacuum conditions (pressures of at most 10−2mbar) to avoid or reduce many parasitic effects. Indeed, this eliminates the problems related to the heating of the air around and in the cavity, such as convection and air leakage from the cavity. On the other hand, these vacuum conditions could lead to a plasma generation and outgassing effects studied by McDonald et al. [6]. In addition, these conditions require significant resources and generate great complexity, while measurement at atmospheric pressure remains quite accurate because ambient air produces effects that can be discriminated against [1].
The surrounding vibrations are sources of noise on the measurements. To reduce them as much as possible, heavy optical tables are in place to support the measuring setup. Magnetic dampers are also required to significantly reduce the oscillations of the torsion pendulum.
The geometry of the cavity is the same in the latest studies. It has a truncated cone shape with a high density polyethylene cylinder inside attached to the smallest face of the cavity. The presence of this dielectric cylinder appears necessary for the production of the EMDrive force, but no one has yet clarified the relevant mechanism. This geometry was originally implemented by White et al. in 2016 [1] and has been replicated for its rather good power to thrust ratio of 1.2 ± 0.1 mN/kW. The mode inside the cavity is not the fundamental one, but a mode called TM212 composed of 4 field nodes in the azimuthal plane and which has a better quality factor Q.
On White’s setup, the power unit, which feeds the cavity with microwave power, is fixed to the cavity, and the whole constitutes the tested article positioned at the end of the torsion pendulum. In this case, the thermal expansion of the coaxial cable under RF power has no direct effect on the
force measurement. On the other hand, the feeding of the microwave source requires the circulation of low frequency or DC currents in the wires which can be coupled with magnetic fields existing on the measuring setup and thus generate a Laplace force affecting the device under test. In addition, if the force sensor is too close to this microwave source, it can be disturbed by the powering up of the setup and thus give erroneous measurements, even if this effect does not seem to be noticeable. However, in order to reduce the interface wire forces, liquid metal contacts have been implemented to transmit power and control signals.
In contrast, on K¨oßling’s setup, the microwave source and amplifier are far from the cavity, and only a 3-stub tuner, a coupler, and two powermeters are positioned on the pendulum together with the cavity under test. Electromagnetic compatibility issues caused by low-frequency power supply wires or by the microwave source are avoided. However, the connection with external environment is made with a coaxial cable feeding the cavity. The setup could be then exposed to parasitic forces caused by the thermal expansion of the RF cable. To eliminate these, a liquid metal contact RF feedthrough has been implemented whose RF performances are poor.
In all articles, the calibration step seems essential to match the measurement of the pendulum arm displacement with a force. To do this, White applies calibration voltages between two sets of electrostatic fins, which generate well-known electrostatic forces. In another way, the calibration of K¨oßling’s setup is done thanks to accurately controlled magnetic forces generated by a voice coil.
Finally, the strategy of discriminating the EMDrive force from parasitic effects by time signature and cavity inversion is proposed by both of them. This technique allows to switch the direction of the EMDrive force while hoping that the parasitic effects remain unchanged. In practice, the operator’s manipulations as well as the inverted or null configurations themselves can modify the magnitude and the direction of the parasitic effects, making the interpretations of the measurements more tricky.
Some of these outlined issues could be overcome by opting for other measuring instruments or other discrimination methods that we propose in next section.
2.2. Solutions
Based on the lessons learned in these previous studies and with modest financial resources, this paper reports our experimental contribution in order to independently seek to highlight an EMDrive force in an original way. Therefore, the goal was to design an accurate and affordable setup to measure and discriminate a force from a few 10µN to 10 mN. Indeed, if we rely on White’s claimed efficiency, 1.2 mN/kW [1], and considering that we have a maximum RF power of 200 W, we should expect an EMDrive force of 0.24 mN. This level of force seems high enough to be measurable with a commercial precision balance which has short response time as opposed to that of the torsion pendulum [1, 2]. This type of measuring instrument has already been used to detect an EMDrive force [3, 7], and it allows us to develop an accurate-enough, handy, and low-cost measuring setup.
The response time of the precision balance is much shorter than that of the torsion pendulum (see Section 4.1). This very important feature of our setup allows us to discriminate the thermal effects with a slow time response: convections and air leakages caused by air heating, Archimedes’ thrust, etc.
The force measurement is obtained from the balance on which the cavity under test is placed. Thus, in the absence of a pivot, any deformation drifting the centre of gravity of this cavity should not generate any additional force on the balance.
The tests will be carried out at ambient pressure, greatly facilitating the use of the experimental setup. In addition, several authors (White [1] and Tajmar [3]) have shown that the effects caused by these measurement conditions were of secondary importance and could be discriminated against because of their time constant. Also, the ambient pressure allows faster thermal relaxation through convection, which allows much quicker and repetitive measurements.
The microwave source is away from the cavity and the balance, eliminating electromagnetic compatibility problems and magnetic effects associated with feeding wires.
Coaxial cable will be the only connection between the DUT and the external environment, but no contactless connection has been developed yet, so thermal expansion of this RF cable will be an important false positive source (Section 4.2).
In order to perform different types of calibration, a set of several F1 class standard weights will be used. The mass measured by the balance will be directly converted into force units (mN) taking into
account that 1 mN corresponds to 101.9716 mg.
We also choose to discriminate the EMDrive force from parasitic effects thanks to the cavity switching. In order to minimize the parasitic changes, we proposed an original configuration, called “shaker”, involving two identical cavities of opposite orientations connected to a coaxial switch and linked externally by a single cable. A schematic diagram is shown in Figure 1.
(a) (b)
Figure 1. Diagram of our original configuration named “Shaker”. (a) Downward thrust; (b) Upward thrust.
In Figures 1(a) and 1(b), it can be seen that the two cavities as well as the cables and switch form an unique block which is placed on the balance. The switch is used to feed either the bottom cavity (in red on Figure 1(a)) or the top cavity (in red on Figure 1(b)). Assuming that the force exists and is directed towards the small face of the cavity (green arrow on the diagram), it becomes possible to generate a thrust alternately directed downwards or upwards.
The switch is externally connected to the generator by one single coaxial cable, which experiences the same thermal effect whether the upper or lower cavity is fed. It will therefore be possible to subtract it by comparing the balance responses for the two orientations of the cavity. The difference between the two readings is then twice the force we desire to measure. This configuration therefore appears to be well suited to weak thrust detection almost without false positive risks.
3. DESCRIPTION OF THE EXPERIMENTAL SETUP 3.1. RF Feeding Circuit
The generation of the RF signal is performed by a SAIREM model GMS200W with a bandwidth from 2.43 to 2.47 GHz and a 100 kHz frequency step. This generator is able to provide RF powers from 0 to 200 W (53 dBm) in increments of 1 W. It is a solid-state generator whose frequency spectrum is much better than that of a magnetron. A software has been specially developed by the LAPLACE in order to control over time the emitted frequency and power of the source via a RS232 connection.
A 30 dB bidirectional coupler is connected to the gene-rator output. This model DDTO-3-30 from SHX has a bandwidth ranging from 2 to 4 GHz, and its maximum power handling capacity is 500 W. The coupler redirects the incident and reflected waves on the cavities towards two powermeters model 6960A associated with power pro-bes model 6920 from MARCONI (See Figure 2). In addition to coupling losses, these probes require an input power attenuator due to their low maximum power threshold. All attenuations related to the coupler, cables, and attenuators were characterized by a vector network analyzer (VNA).
Figure 2. RF power supply diagram of the setup.
3.2. Microwave Cavity
There are currently no reliable design rules for the cavity to increase thrust. The laws of classical electrodynamics almost directly give that the sum of the forces exerted on all the walls of a closed cavity is zero. For instance, in 2016, McDonald [8] analytically demonstrated that fact for the case of a hemispherical cavity, using Lorentz forces coupled to Maxwell’s equations.
However, for the more challenging situation of the truncated conical cavity, which we will use thereafter, no analytical solution can be used to derive forces. An alternative is then to proceed to numerical computations using full wave simulators. We have performed such calculations and found negligible resulting force. After convergence tests, we conclude that this non-zero force comes from numerical errors and mesh approximation.
In classical electrodynamics, the Maxwell stress tensor is used to calculate the resulting force on a system from the fields on a boundary surface surrounding that system. By applying this approach to an electromagnetic cavity without leakage, it follows from classical theory that no resulting force can be applied to such a cavity. It can be deduced that the (hypothetical) measure of such a force would challenge this theory.
Nevertheless, from [1], the only suitable requirement to enhance the force is related to the electromagnetic energy stored in the cavity: it should be as high as possible. If the cavity is fed at its resonance frequency f0, the effect of the reflected wave can be neglected, and the stored energy
ES can be expressed as follows:
ES = Q
2πf0Pinc
(1) This energy increases with the power feeding the cavity Pinc and with the quality factor of the cavity Q. The distribution of this inside electromagnetic energy depends on the mode. Although some authors explore different modes, no rule has been published except to bring out asymmetry along the axis on which the force is oriented.
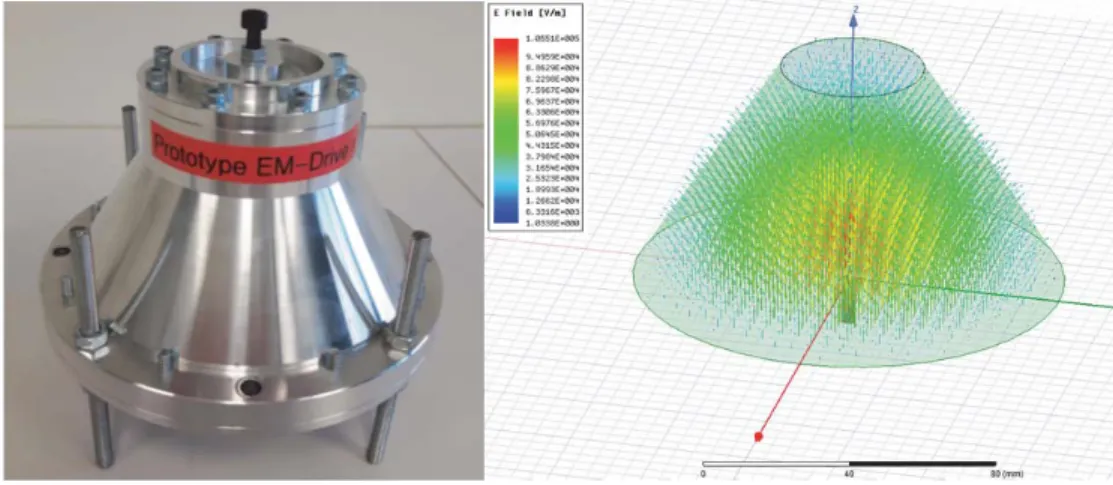
The simplest design that is found in many published works is the truncated metallic conical cavity without any dielectric loading. As a first approach, we therefore choose this type of cavity with inner diameters of 4 cm on the small end, and 11.98 cm on the large end. The axial length is 63.85 millimeters. An electric probe feeding is performed so that this aluminium cavity is driven in the fundamental mode at 2.444 GHz. This geometrical asymmetry creates the electromagnetic asymmetry (See Figure 3).
We select the fundamental mode as in [3] because it is the simplest to achieve and allows easier interpretations. In addition, for a given frequency, this is the mode that leads to the smallest and lightest cavity. This criterion is interesting in terms of weight and for the integration of this cavity in our measuring setup.
Electromagnetic simulations have been performed with HFSS, and the cavity has been manufactured in two units with adjustment capabilities to correctly tune the matching and resonance frequency. Figure 4 shows the return loss of the cavities. We can observe a good matching of less than
−20 dB to the 2.4408 GHz resonant frequency f0. The resonance is therefore well positioned in the
Figure 3. Resonant microwave cavity and a HFSS simulation of its fundamental mode.
Figure 4. Return loss of the two manufactured cavities.
stand at 3550. Although relatively high, these quality factors are much lower than those expected by the simulation, which were around 6000.
The resonant frequency of a cavity is closely related to its internal volume in which the electromagnetic wave is confined. Thus, during the power-up, the thermal expansion causes a drift of this frequency. The swiftness of this drift depends mainly on the thermal expansion coefficient of the aluminium, the mass of the cavity, and the microwave power injected. During the experimental campaign, the power emitted by the generator was 200 W, and the weight of each cavity is about 1 kg. By specific measurements, we assessed the duration for the cavity to move from its most well matched level to a level of −10 dB (correct matching limit) which is about 13 s. In the measurement campaigns, it will therefore be necessary to ensure that the duration of the power pulses is well below these 13 seconds, which can then be estimated as the unmatching time.
Moreover, the succession of these impulses can lead to a progressive heating of the cavities. The resulting dilation of the cavity causes a slight mismatch with the pulses, which can be manually corrected directly by shifting the frequency emitted by the generator by 100 kHz (minimal step).
3.3. Measuring Structure
The main measuring element of our experimental setup is a precision balance placed on a marble table which is visible in Figure 5.
Figure 5. Experimental setup picture.
An XPE15002L from METTLER TOLEDO has been selected. Masses from 2 g to 15.1 kg can be measured with a display accuracy of 10 mg (≈ 0.1 mN). The developed software (introduced in Section 3.1) allows us to also collect data from powermeters and from the balance. It thus makes it possible to automate all the required measurements and to instantaneously export them to a PC.
As a first approach, we preferred to focus on the maximum capacity of the balance rather than absolutely seeking to have an ever better sensitivity. This allowed us to imagine and test many different configurations. This trade-off still allows us to measure the force produced by the system under test and to identify the time signature of the main parasitic effects (see Section 4.2). With this precision of 0.1 mN, the measuring sensor remains appropriate to investigate parasitic effects of the same order of magnitude as the expected EMDrive force.
3.4. Original Configuration
Introduced in Section 2.2, the shaker configuration is an original design to change the direction of the possible EMDrive force without having to handle the test article (see Figure 6). It is important to note that the cavities just have to be in opposite directions but do not require to be perfectly identical. In our case, as can be seen in Figure 4, the resonance frequencies and quality factors of the two cavities
are very similar. The primary interest is that we can consider that the amplitude and direction of the parasitic effects remain unchanged regardless of the direction of the EMDrive force, allowing us to discriminate it from these parasitic effects. It enables some kind of an instant calibration. Its short few seconds duration greatly helps a clear interpretation of the results, if an EMDrive force occurs.
4. CHARACTERIZATION
In this section, we present the characterization of the measuring setup. We focus on the parasitic effects that can alter the force measurement. As a preliminary test, we have to check that switching the power from one cavity to another does not generate any change on the balance. To do this, we first connect both outputs of the switch to matched loads. We then perform power and non-power measurements for the two states and during the switching. Although the commutation time is below millisecond, the switching is not done when the power is on. So we have to turn the power off before switching and turn it back on after. No modification of the balance measurement has been seen during theses sequences.
Thereafter, we look at the performances of our measuring setup (Section 4.1). We then characterize the thermal effect of the coaxial cable and its reproducibility as it represents the main parasitic effect impacting any thrust measurement (Section 4.2). This will facilitate the interpretation of the results of the measurements on the cavities (in shaker configuration) that will be presented subsequently.
4.1. Measuring Setup Performances
First, we use standard weights (from 10 mg to 500 mg) to obtain the time response of the balance (without any cavity placed on it) when a known force is applied (Figure 7) — taking into account that 1 mN corresponds to 101.9716 mg under our experimental conditions.
Weighing (g) Add of 20 mg Add of 50 mg Add of 100 mg Add of 200 mg Add of 500 mg 0.0 0.2 0.4 0.6 0.8 1.0 Time (s) 0.0 0.1 0.2 0.3 0.4 0.5 0.0 0.1 0.2 0.3 0.4 0.5 Balance's time response to standard weights
Figure 7. Time response of the balance to additions of standard weights from 20 mg to 500 mg. The time step sampling of the balance is then around 80 ms, and the vertical resolution is 0.01 g (i.e., 10 mg, 0.1 mN).
Regarding the weight response time, i.e., the time to display a permanent value, it can be observed that it increases as the weight increases. Start from 80 ms for 20 mg to 960 ms for 500 mg. This increase with weight is surprising because it is not expected for a linear system. The time constant should be intrinsic to the system therefore not changing with the amplitude of the stimulus. However, it can be assumed that the speed of this temporal response is mainly related to mechanical inertia, to which delays are added related to the underlying electronics.
Nevertheless, we can conclude that the response time of this balance does not exceed one second for forces up to 5 mN (500 mg).
The electromagnetic raising time (microwave power source and cavity raising times) has been investigated to be less than 100 ms. The global setup response time can be overestimated around 1 s, mainly due to the balance.
However, the sensitivity of the balance may vary depending on the weight of the cavity(s) under test and the flexibility of the RF cable. A series of preliminary tests have been carried out. This consists in placing the standard weights on the article under test. For every shaker measurement configuration, we noted that the 20 mg weight was correctly measured contrary to the 10 mg one. We will therefore consider that for all the measurements that follow, the sensitivity of the balance will be 0.2 mN under the measurement conditions.
Moreover, we tested the effect of a change in the centre of gravity location of the article under test. Standard weights in different locations on the balance plate only exhibit a worst case difference of
±0.1 mN for additional forces up to 2 mN, and ±0.2 mN for 5 mN force.
4.2. Thermal Effect of the Coaxial Cable
In our current configuration, the most impacting parasitic effect is that of the coaxial cable connected to the cavity. As the RF power flows through it and heat it due to RF losses, its mechanical properties change, affecting the apparent weight on the balance. As mentioned in Section 2, we are aware that the expansion of this cable constitutes a very important parasitic effect that other authors have already overlooked by developing solutions of liquid metal or contactless transitions to mechanically decouple the cable [1, 2, 6].
Aiming at improving the experimental setup, a contactless transition is developed. However, at this point, the expansion of this RF cable is the most important parasitic effect of our measurement setup that we will characterize in this section. The role of the “shaker” setup is to discriminate the potential EMDrive force against all the parasitic effects, and here, the thermal expansion of the cable is the most important one now.
In order to characterize this effect and to choose the cable we will use, we study the parasitic force generated by different cables and under different connection settings, always connected, at the end, to a matched load, of course. What emerged from this study is that the thermal behavior of the tested cables seems to be the result of a combination of phenomena that do not have the same strength and speed. However, we were able to select the model GL200sC01 from GIGALANE because it was clearly the cable that generates the least parasitic effect and because it quickly comes back to its initial behavior. We estimated that 60 W are globally lost when RF source provides a maximum of 200 W. 140 W are then fed into the cavity. In this section, the goal is to test the efficiency of our measuring setup for detecting a weak force despite the thermal effects of this selected cable. It illustrates how efficient the setup configuration and calibration can be.
The thermal effect of the cable was seen reproducible at almost each power-up. However, this assumption is not always verified. In this section we then show how we can handle this effect.
For all cavity thrust measurements and pretests, we have defined a common measurement cycle that is well suited to our needs. It consists in fifteen 200 W power pulses of 5 seconds each, delayed 90 seconds from each other:
• The 5 second duration is long enough to achieve a steady response of the balance to a strength
ranging from 0.1 mN to 5 mN and short enough to minimize the change with the thermal effect.
• The 90 second delay between two pulses is long enough to allow the cable to relax.
To visualize the thermal effect of the cable, we connect it to a matched load. We then apply several consecutive power cycles to the device. It appears on the first cycles, when the cable is initially at room temperature, that its behavior drastically changes, and that the force it exerts on the balance differs at each pulse. Fortunately, the cable behavior is stabilized after the 3rd or 4th consecutive cycles.
The reproducibility of each pulse can be quantified by performing an appropriate post-processing focusing on end-of-cycle values. The first step is to synchronize the successive pulses. As a result, we have the same reference time with each pulse which always starts at the same arbitrarily defined time
Figure 8. Average and standard deviation of the cable thermal effect (in mN).
The second step consists in averaging the pulses. We record 2 measurement cycles after stabilization (4th and 5th cycle), i.e., 30 pulses. Although performed on Matlab, this averaging operation is not entirely automatic. We select 1 pulse out of 5 from the 30 useful ones. This 6 pulses sampling seems sufficient because the shape of the average curve obtained remains satisfactorily the same after 3 pulses. The curve obtained corresponds to the sum, at each instant, of the weights obtained for the 6 selected pulses (divided by 6). The result of this post-processing is shown in Figure 8. This result can then be used as a reference for the zero thrust measurement. The same process will also be used later for cavity characterization.
It can thus be noticed that the cable thermal effect generates a negative contribution with a maximum amplitude of 3.9 mN. We can also observe a good reproducibility of the cable response under power. Indeed, the maximum difference between the individual pulses is 0.5 mN. Moreover, this gap is at the end of relaxation period, which is out of the “working” area. Indeed, the useful period can be reduced to the duration of the power pulse, i.e., the first 5 seconds. However, in this duration, the maximum difference between the measurements is extremely small. The maximum standard deviation is 0.1 mN, which is the resolution of the balance. It can therefore be concluded that the cable behavior has a very good reproducibility, considering the post-processing we use.
4.3. Measurements with Shaker Configuration
In this section we report the results obtained on the cavities in shaker configuration as shown in Figure 6. We applied our measurement protocol with several consecutive power cycles on the top cavity and then on the bottom one.
Figure 9 shows the average pulses obtained for the top and bottom cavities in shaker configuration: respectively blue and red curves. The thrust caused by the cable expansion is therefore always oriented in the same direction, regardless of which cavity is fed. Their difference corresponds to the black curve. Due to the shaker configuration, the measurement conditions have not changed with the orientation of the cavities. The parasitic effects can therefore be considered identical. In this way, the difference between the two curves associated with the two different cavity orientations can be interpreted as twice the level of the possible EMDrive force. However, the average level of this difference around 0.25 mN is lower than the uncertainty of the measuring setup which is related to the dispersions of the different setup responses and can be estimated around 0.5 mN.
Figure 9. Comparison of the thrust of the top and bottom cavities in shaker configuration.
We can therefore say that the measurements we carried out did not reveal the presence of an EMDrive force greater than 0.5 mN. This 0.5 mN limit is the estimated accuracy that can be assigned to our setup in this configuration to discriminate such a force.
5. DISCUSSION
Regarding the measurement and analysis protocols, we opted, as White et al. did [1], for temporal measurements of the setup response combined with the strategy of reversing the cavity under test. Indeed, we have designed and used a so-called “shaker” configuration that preserves the same parasitic effects for both orientations of the cavity. It does not require any intervention on and around the cavities. This original configuration implies that the article under test consists of two cavities oriented in the opposite directions, which can be alternately fed via a switch. The whole constitutes a unique set placed on the balance. Processing in this way, the thermal effect of the cable can be subtracted by making the difference in the responses associated with the two orientations of the cavity. This difference could potentially show twice the level of the force. However, the performance of this method is limited due to the thermal effect of the cable which is not perfectly reproducible when subjected to power pulses (typically 200 W). Therefore, a post-processing based on pulse averaging and the estimation of their standard deviation was performed in order to establish the uncertainty of the setup in this configuration. Measurements made with our cavities did not reveal the presence of an EMDrive type force with an intensity greater than 0.5 mN, the estimated accuracy of the setup in this configuration. However, these apparently negative results must be balanced. Indeed, the credible force levels extracted from the literature, and projected with the power available on our setup, are around 0.2 mN, which is below our current accuracy. Moreover, the measuring setup we have realized is an affordable, handy, and versatile base for the detection of an EMDrive type force. It already allows the rapid study of different cavities with an accuracy below the milliNewton.
6. CONCLUSION
The goal of this study was to learn from previous studies to create a handy measuring setup dedicated to EMDrive cavities with moderate resources. We have designed simple cavities with a truncated conical shape and without dielectric, as other authors have already done [3]. We have added appropriate tuning to ensure the proper matching of the cavity and the control of the resonant mode with a good quality factor.
The main part of the measuring setup is a commercial balance of 0.1 mN resolution, with a capacity of up to 15.2 kg. This large measuring range has allowed us to imagine and test many configurations that can include several cavities (e.g., shaker configuration). We have chosen to deport the microwave source from the article under test in order to avoid the problems associated with it (weight, ventilation, heating, vibration, ...). However, this configuration requires a microwave connection between the cavity on the balance and the microwave power source which is away. This configuration leads to thermal parasitic effects with the connexion coaxial cable. The generator status, the incident and reflected power measurement probes, and the weighing performed by the balance are remotely controlled by a computer. A dedicated software, developed as part of this study, allows the real-time recording of all data.
The main original contribution of our experimental setup is this shaker configuration which allows us to switch the direction of the possible EMDrive force without handling the test device. It is important to mention that, thanks to this configuration, we were able to define an overall accuracy of 0.5 mN for our measuring setup. This is only in the range of five times the absolute accuracy of the commercial balance.
The feedback from this study leads us to consider significant improvements in order to provide a more convincing answer on the existence or not of this EMDrive force. A first step will be to eliminate the thermal effect of the cable. As McDonald et al. [6] did, a dedicated contactless RF feedthrough is currently manufactured in order to feed the cavity without mechanical contact. The cavity would then not be connected to any external element. The parasitic effects will be significantly reduced. Combined with our shaker configuration, the interpretation of the results obtained would be much more straightforward.
Increasing the accuracy of the balance would also be a necessary improvement of the measuring setup. precision balances with 10 times higher accuracy, 0.01 mN, are available. In return, the operating weight range of the balance is considerably reduced. This would require us to design lighter cavities. It appears possible. We think that we will have to modify our software so that it follows, automatically and in real time, the thermal drift of the resonant frequency of the cavity which will be more important because of its mass decrease. We would also surely have to take into account other minor parasitic effects that have been ignored until now.
With the idea of investigating a wide diversity of cavities, the accuracy of the measuring setup would then fully allow to consider the replication of NASA’s cavity [1] — with the introduction of a dielectric cylinder. We could then determine if we find the same level of thrust as they claim (1.2 mN/kW).
In our opinion, this new type of calibration using shaker configuration together with the handy experimental setup shown in this paper is an important contribution. It makes it possible to other research teams in the world to take part in the debate on the EMDrive issue. They could hereby be able to explore large diversity of cavities and modes and propose new prototypes to be characterized by high accuracy measuring setups like those of White, K¨oßling, or McDonald [1, 2, 6].
ACKNOWLEDGMENT
All the authors would like to thank both CNES (french National Centre for Space Studies) for its financial support for carrying out this research and AID (french Innovation and Defense Agency) for funding Hugo Peyre’s work.
REFERENCES
1. White, H., P. March, J. Lawrence, J. Vera, A. Sylvester, D. Brady, and P. Bailey, “Measurement of impulsive thrust from a closed radio-frequency cavity in vacuum,” Journal of Propulsion and
Power, Vol. 33, 830841, Jul. 2017.
2. K¨oßling, M., M. Monette, M. Weikert, and M. Tajmar, “The SpaceDrive project — Thrust balance development and new measurements of the mach-effect and emdrive thrusters,” Acta Astronautica, Vol. 161, 139152, Aug. 2019.
3. Tajmar, M. and G. Fiedler, “Direct thrust measurements of an emdrive and evaluation of possible side-effects,” 51st AIAA/SAE/ASEE Joint Propulsion Conference, 4083, 2015.
4. McCulloch, M. E., “Can the emdrive be explained by quantised inertia?,” Progress in Physics, Vol. 11, No. 1, 78–80, 2015.
5. McCulloch, M. E., “Propellant-less propulsion from quantised inertia,” J. of Space Exploration, https://www.researchgate.net/publication/329754104 Propellantless Propulsion from Quantised
Inertia, 2018.
6. McDonald, M. S., M. W. Nurnberger, and L. T. Williams, “Preparations for thrust measurement and error discussion of the impulse resonant microwave cavity,” Journal of the British Interplanetary
Society, Vol. 70, 415–424, 2017.
7. Fetta, G. P., “Numerical and experimental results for a novel propulsion technology requiring no on-board propellant,” 50th AIAA/ASME/SAE/ASEE Joint Propulsion Conference, American Institute of Aeronautics and Astronautics, Jul. 2014.
8. McDonald, K. T., “Electromagnetic self-force on a hemispherical cavity,” http://www.physics. princeton.edu/∼mcdonald/examples/hemisphere.pdf, 2016.