Publisher’s version / Version de l'éditeur:
Journal of Polymer Science Part B: Polymer Physics, 36, 12, pp. 2025-2032,
1998-09-15
READ THESE TERMS AND CONDITIONS CAREFULLY BEFORE USING THIS WEBSITE. https://nrc-publications.canada.ca/eng/copyright
Vous avez des questions? Nous pouvons vous aider. Pour communiquer directement avec un auteur, consultez la
première page de la revue dans laquelle son article a été publié afin de trouver ses coordonnées. Si vous n’arrivez pas à les repérer, communiquez avec nous à PublicationsArchive-ArchivesPublications@nrc-cnrc.gc.ca.
Questions? Contact the NRC Publications Archive team at
PublicationsArchive-ArchivesPublications@nrc-cnrc.gc.ca. If you wish to email the authors directly, please see the first page of the publication for their contact information.
NRC Publications Archive
Archives des publications du CNRC
This publication could be one of several versions: author’s original, accepted manuscript or the publisher’s version. / La version de cette publication peut être l’une des suivantes : la version prépublication de l’auteur, la version acceptée du manuscrit ou la version de l’éditeur.
For the publisher’s version, please access the DOI link below./ Pour consulter la version de l’éditeur, utilisez le lien DOI ci-dessous.
https://doi.org/10.1002/(SICI)1099-0488(19980915)36:12<2025::AID-POLB2>3.0.CO;2-W
Access and use of this website and the material on it are subject to the Terms and Conditions set forth at
High-precision gravimetric technique for determining the solubility and
diffusivity of gases in polymers
Wong, Betty; Zhang, Zhiyi; Handa, Y. Paul
https://publications-cnrc.canada.ca/fra/droits
L’accès à ce site Web et l’utilisation de son contenu sont assujettis aux conditions présentées dans le site LISEZ CES CONDITIONS ATTENTIVEMENT AVANT D’UTILISER CE SITE WEB.
NRC Publications Record / Notice d'Archives des publications de CNRC:
https://nrc-publications.canada.ca/eng/view/object/?id=cb735f19-fdb6-4298-8e1b-cc0e63ba6e24 https://publications-cnrc.canada.ca/fra/voir/objet/?id=cb735f19-fdb6-4298-8e1b-cc0e63ba6e24
the Solubility and Diffusivity of Gases in Polymers
BETTY WONG, ZHIYI ZHANG, Y. PAUL HANDAInstitute for Chemical Process and Environmental Technology, National Research Council of Canada, Ottawa, Ontario, Canada K1A 0R6
Received 29 October 1997; revised 20 February 1998; accepted 23 February 1998
ABSTRACT: An in situ gravimetric technique, employing an electrobalance, is described for determining the solubility and diffusivity of gases in polymers over extended ranges of temperature and pressure. Solubilities of CO2in polystyrene at 357C were measured
as a test case; the results are in excellent agreement with the literature values deter-mined by the pressure decay method. Solubility and diffusivity results are also reported for PVC-CO2 at 357C and for PS-1,1,1,2-tetrafluoroethane at 30, 90, and 1207C. A
comparison with other studies shows the in situ method to be more efficient and precise than the ones based on weighing the gas-saturated polymer under ambient conditions. The kinetics of gas sorption were analyzed in terms of two data reduction techniques to derive diffusion coefficients.q1998 John Wiley & Sons, Inc. J Polym Sci B: Polym Phys 36: 2025 – 2032, 1998
Keywords: polymer ; gas; solubility; diffusivity
INTRODUCTION
tem, and then pressurize it with the desired gas.The sample is removed from the vessel periodi-cally and weighed until a constant weight is ob-Solubility and diffusivity of a gas in a polymer are
tained. From these results, the kinetics of sorption important parameters in foam processing, and in
( and the diffusion coefficient ) and equilibrium sol-establishing the intrinsic gas transport
character-ubilities are obtained. A major source of error in istics of gas separation membranes and barrier
these measurements is the escape of gas during materials. Diffusion coefficients are rarely
mea-the various handling procedures involved in sured directly; instead, they are derived either
weighing the sample. Furthermore, it is not possi-from the kinetics of gas sorption1,2 or from the
ble to assess the magnitude of this error as it time lags associated with steady-state
permeabil-depends on the nature of the polymer, its size and ity across a homogeneous film of known
thick-shape ( surface to volume ratio ) , and the nature ness.1
The techniques employing permeability
of the gas. In general, this method is very time measurements are often used by
membranolo-consuming for slow diffusants and the results of-gists to obtain diffusion coefficients3
whereas
in-ten have large uncertainties for fast diffusants. vestigators working on developing foaming
pro-High precision solubilities usually are obtained cesses use sorption kinetics to that purpose.4
In
using either the pressure decay method6
or the the latter case, an often used technique5
to obtain
gravimetric method using an electrobalance.7
In solubilities and diffusivities is to place the
poly-mer sample in a pressure vessel, degas the sys- the former technique, the polymer is placed in a reservoir of known volume and the change in pres-sure due to dissolution of the gas is meapres-sured
rela-Correspondence to: Y. P. Handa (E-mail: paul.handa@ tive to a matched empty reference-volume. This
nrc.ca)
technique requires rather careful calibrations, and
Journal of Polymer Science: Part B: Polymer Physics, Vol. 36, 2025 – 2032 ( 1998 )
q1998 John Wiley & Sons, Inc. CCC 0887-6266/98 / 122025-08 can be used only for gases whose equation of states 2025
2026 WONG, ZHANG, AND HANDA
are accurately known. The gravimetric technique employing an electronic microbalance has been used successfully for obtaining gas solubilities over limited ranges of temperature and pressure. We describe an in situ high-pressure gravimetric tech-nique that extends the temperature and pressure ranges previously employed using an electroba-lance,7
and that overcomes the limitations encoun-tered previously with the pressure decay and the ambient-pressure gravimetric techniques.
EXPERIMENTAL
Polymer Samples
The polymers investigated were polystyrene, PS ( Scott C-35, Mw Å 258,000, Mn Å 103,000, Tg Å 1047C ) , filled poly ( vinylchloride ) , FPVC, con-taining 7.5 wt % additive ( Royal Plastics Geon 103EPF76 ) with a Tg Å 617C, and unplasticized poly ( vinylchloride ) , UPVC, from Goodfellow with a Tg Å 777C. The PS films, about 100 mm thick, were cast from a 3 wt % solution in chloroform, using the procedure described elsewhere.8 After
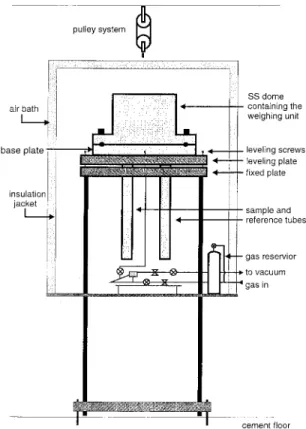
Figure 1. A schematic of the electrobalance setup. 3 – 5 days, the films were removed from the casting
rings and dried under vacuum. The Tgof the film
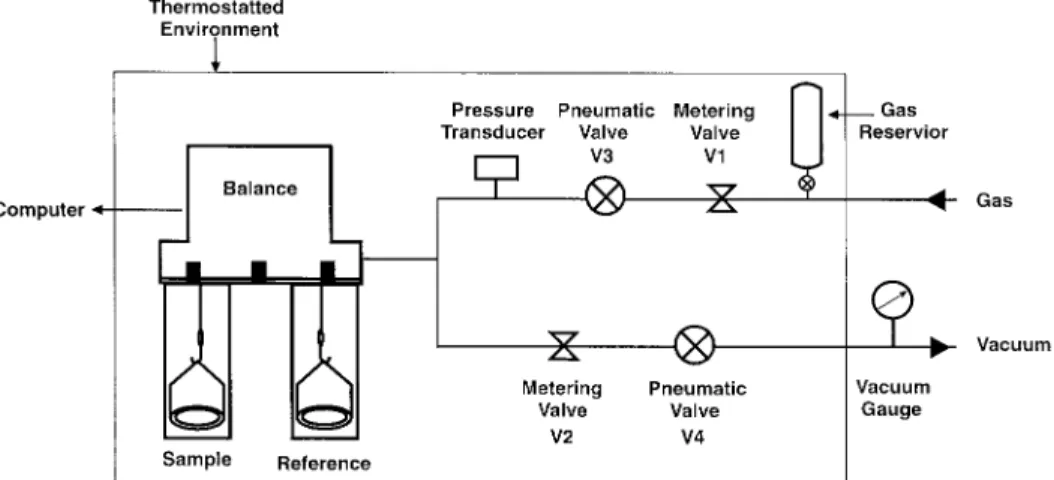
was monitored throughout the drying process us- steel tubes housed the reference and the sample ing a differential scanning calorimeter ( TA In- vessels made of quartz and suspended from the struments, DSC 2910 ) . This was continued until two arms of the weighing unit by nichrome wires. the Tgof the film reached that of the original PS The balance was connected to vacuum and gas powder. The films were then annealed 107C above lines through a series of pneumatic and metering Tg to remove any residual stresses and to assure valves as shown in Figure 2. The entire system, that the films had the same thermal history. The including the valves and a gas reservoir, was en-FPVC films were melt pressed at 1907C and 190 closed in an air thermostat controllable to ( 120 atm to a thickness of 300mm and air quenched, { 0.1 ) 7C. Measurements at temperatures from whereas the UPVC film was used as received. 120 to 3007C can be made by circulating thermo-High purity CO2 ( SFE grade ) was obtained statted oil through the jackets surrounding the
from Air Products, and 1,1,1,2-tetrafluoroethane sample and the reference tubes. Samples of differ-( HFC134a ) was obtained from Elf Atochem North ent size and shape ( up to 35 cm3
or 100 g ) can be America. used. For sample sizes õ 10 g, the resolution of
the balance is 10mg.
Approximately 1 g of sample, in the form of
Solubility Measurements
12 mm diameter disks, was placed in the sample vessel. Filter paper disks, also 12 mm in diameter, A Cahn D110 electronic microbalance was used
to measure gas solubilities, and to determine dif- were placed between the polymer disks to avoid the latter fusing together at temperatures close fusion coefficients. The balance was mounted on
a vibration-free stand as illustrated in Figure 1. to or above Tg. A matched vessel containing the same number of filter paper disks as on the sam-The weighing unit was contained within a heavy
walled stainless steel dome rated to 120 atm. The ple side and glass beads weighing approximately the same as the polymer sample were installed dome can be lifted by the pulley system to allow
access to the weighing unit. A floating plate sup- on the reference side. An appropriate amount of nichrome wire was then added to the sample ves-ported by three screws kept the weighing unit
Figure 2. A schematic of the gas handling and temperature control systems.
vessels were as matched as possible in order to tually constant during the gas sorption and de-sorption runs.
minimize the effect of buoyancy.
Metering valves V1 and V2 were preset to al- Blank runs were conducted under the same conditions used for the solubility measurements. low slow pressurization or depressurization of the
system. A rapid pressurization / depressurization In these runs, empty cells matched precisely in mass and volume were employed to determine tended not only to shift the zero setting of the
balance but also led to erratic changes in mass shift in the balance zero as a function of pressure. The equilibrium mass readings obtained in the gain / loss due to fluctuations in the gas
tempera-ture. Once optimum settings were found for V1 solubility experiments were then corrected for the zero shift. Corrections for buoyancy due to the and V2, pressurization / depressurization was
per-formed by controlling remotely the pneumatic small volume difference between the sample and reference sides that developed as the polymer di-valves V3 and V4.
The sample was degassed for three days or un- lated due to dissolution of the gas were also made and are described below.
til there was no further change in mass. Before commencing the sorption experiment, the gas was preheated to the desired temperature in a
reser-Data Analysis
voir to minimize shock to the system. Mass read-ings were collected for 5 min to obtain a good
base-The diffusion coefficients were calculated using line and accurate initial time for kinetic studies.
two methods. The first is a hybrid method based The gas was then introduced to the desired
pres-on the gas transport kinetics at short and lpres-ong sure as indicated by the pressure transducer. The
times. For thin, flat film geometry, the kinetics of mass gain was recorded every 10 s until a
con-Fickian sorption ( desorption ) are given by eqs. stant value was obtained. An additional amount
( 1 ) and ( 2 ) , respectively of gas was then introduced to raise the pressure
to the next value, and the kinetics of sorption and
new equilibrium mass were established again. Mt M` Å4 h
S
Dt pD
1 / 2This was continued until measurements over the desired pressure range were completed at a given temperature. For HFC134a at subcritical
temper-/8 h( Dt ) 1 / 2
∑
` nÅ1 ( 01)n ierfcS
nh 2 ( Dt )1 / 2D
( 1 )atures, the maximum pressure used was 90% of the saturation vapor pressure to ensure that the HFC134a did not condense within the system.
The desorption runs were conducted in a similar Mt M` Å 1 0 8 p2
∑
` nÅ0 1 ( 2n / 1)2fashion by releasing the gas in steps until the pressure in the system was back to almost zero.
Because of the large volume associated with the 1 exp
S
0 ( 2n / 1 )2p2Dt h2D
( 2 )vir-2028 WONG, ZHANG, AND HANDA
where Mt and M` are the masses sorbed at time solved gas. Note thatDVdis a function of the gas pressure. The overall buoyancy correction is given t and t Å `, respectively, h is the film thickness,
and D is the diffusion coefficient. Equation ( 1 ) by converges rapidly at short times, whereas eq. ( 2 )
converges rapidly at long times. Equation ( 1 ) wbÅrg(DVi /DVd) ( 6 ) truncated after the first term on the right-hand
side, and eq. ( 2 ) truncated after the first two wherer
gis the density of the gas. For CO2,rgwas terms on the right-hand side are often used to obtained from the IUPAC recommended equation obtain D . However, these techniques are not sat- of state.9
For HFC134a, rg was calculated using isfactory as they do not utilize the entire kinetic the equation of state
curve.1,2
As suggested recently,2
the preferred method is to use the form
pV Å RT / Bp ( 7 )
where V is the molar volume and B is the second Mt
M`
Åf( x ) f ( x ) / [1 0f( x ) ] g ( x ) ( 3 )
virial coefficient. The latter for HFC134a, at various temperatures, was obtained from a corresponding where f ( x ) and g ( x ) represent the first term in states plot10
of B/Vcagainst T/Tcfor various fluoro-eq. ( 1 ) and the first two terms in fluoro-eq. ( 2 ) , respec- carbons; Vc and Tc being the critical volume and tively, x Å Dt/h2
, andf( x ) is a weighting function temperature, respectively. The second virial coeffi-defined as: cients for the various fluorocarbons were taken from
the literature.11
For HFC134a, values of B thus ob-tained were 0439, 0277, and 0236 cm3
mol01 at
f( x ) Å 1, x ° 0.05326
30, 90, and 1207C, respectively.
f( x ) Å 0, x ú 0.05326. The corrected solubility is then given by The obvious advantage of using eq. ( 3 ) , the hybrid
form, is that it requires only the kinetic data; it C Åwa/ wb MP
( 8 ) can be used even if the entire kinetic curve is not
known, and uncoupled values of D and M`can be
where MP is the mass of the polymer, wa is the obtained easily.
apparent mass gain as recorded by the electroba-The second technique used to determine
diffu-lance and corrected for the zero shift, and C is the sion coefficients is known as the moment method1
solubility in mass of gas dissolved in unit mass of polymer. tÅ
*
` 0S
1 0 Mt M`D
dt ( 4 ) It has been well established that, for a glassy polymer, the gas sorbed in Henry’s region only contributes to dilation.12
The change in volume due to dilation was calculated by multiplying the D Å h
2
12t ( 5 ) moles of gas sorbed in the Henrian sites by the partial molar volume of the gas in the polymer, VV g. Kamiya et al.13have shown that a linear rela-where h is the film thickness, t is the moment,
Mtis the mass at time t , and M`is the equilibrium tionship exists between VVg and van der Waals volume of various gases. However, there usually mass. This technique also utilizes the entire
ki-netic curve; however, knowledge of the equilib- is some ambiguity involved in calculating the van der Waals volumes. We found that VV gcorrelates rium mass is necessary.
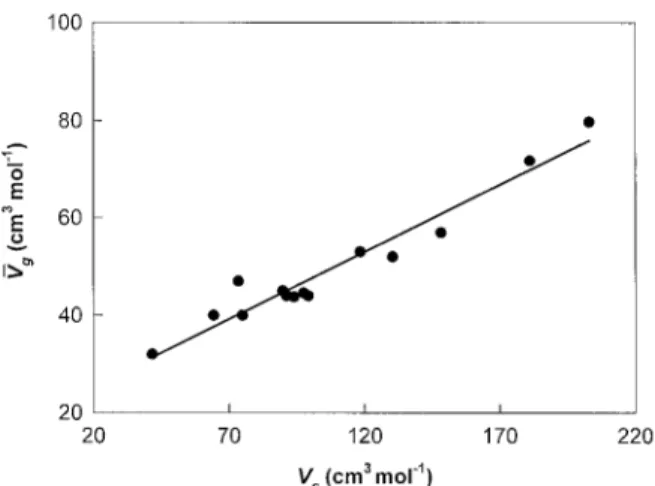
As noted above, the equilibrium solubilities well with the molar volume of the gas at its criti-cal point, Vc. This correlation is shown in Figure were corrected for the zero shift. The resulting
values were then corrected for buoyancy imbal- 3, and is preferred over that based on the van der Waals volumes as precise values of Vc are ance between the sample and reference sides. The
buoyancy correction depends on the volume differ- easily available.14
VV gvalues used in Figure 3 are for Ne, Ar, Kr, Xe, H2, N2, O2, CO2, N2O, CH4,
ence between the sample and reference sides at
the start of the experiment,DVi, and on the addi- C2H4, C2H6, C3H6, and C3H8in the rubbery state
of polycarbonate, polyethylene, polybutadiene, tional volume difference, DVd, that develops as
ethylene-co-been reported at 357C using the pressure decay method.22
Our results are compared with the liter-ature values in Figure 4. There is a slight discrep-ancy between the two sets of data. This can be attributed to the different pressures used to condi-tion the samples; our sample was condicondi-tioned with CO2at 50 atm whereas that reported in the
literature was conditioned at 25 atm before start-ing solubility measurements. Consequently, our sample was a bit more dilated than the literature sample and, thus, exhibits slightly higher solubili-ties. Our values have also been corrected for ma-trix dilation whereas no such correction was ap-plied in the other work. With these considera-tions, the agreement between the two sets of data
Figure 3. Correlation between the partial molar
vol-ume in rubbery polymers and the critical volvol-ume for is deemed to be quite good.
various gases. The sorption and desorption solubilities often show hysteresis in the glassy state due to the irre-versible dilation of the polymer matrix during the vinylacetate ) , and were taken from the
litera-first sorption run.13
As seen in Figures 5 and 6, ture.13,15 – 20
The correlation in Figure 3 can be
the dual-mode type21
glassy nature of both PVC represented by
samples is not as evident during the sorption runs as it is during the desorption runs. The solubility VUg/ cm3mol01Å 0.276 1 Vc/ 19.8 ( 9 )
curves for the two PVC samples are very similar ; however, in the glassy region, the values for the For glassy polymers, the solubilities are often
UPVC sample are consistently higher than for the expressed by the dual-mode equation21
filled PVC sample even when the latter results are normalized with respect to 100% PVC. In the C Å kdp /
S
C *Hbp
1 / bp
D
( 10 ) rubbery region, the solubilities in the two samples are about the same. Also, as seen in Figures 5 and 6, the onset of Tg, taken as the inflection point in where kdis the Henry’s law constant, b represents the desorption isotherms, occurs at about 22 atm the interactions between the gas and the polymer, for FPVC and about 40 atm for UPVC. Thus, the and C *His the hole saturation constant. For rub- additive in FPVC not only lowers the Tgbut also bery polymers, C *H Å 0 and, so, eq. ( 10 ) reduces reduces the amount of free volume that gets fro-to the usual form of Henry’s law. zen-in at T
g. Some work is reported in the litera-Values of C were obtained by an iterative
solu-tion to eqs. ( 6 ) , ( 8 ) , and ( 10 ) . To begin with, wb was set to zero and values of C were fitted to eq. ( 10 ) to obtain the initial guesses for kd, C *H, and b . This gave the initial value ofDVd( ÅkdpVV g) for use in eq. ( 6 ) , and thus a new set of C values from eq. ( 8 ) which were then fitted to eq. ( 10 ) to obtain the new set of dual-mode parameters. These itera-tions were continued until a unique set of dual-mode parameters was obtained. For temperatures above Tg, the calculation procedure was the same except that the iterations were carried out until a unique value for kdwas obtained.
RESULTS AND DISCUSSION
Figure 4. Solubility of CO2 in PS at 357C. l — this
Measurements on PS-CO2 were made as a test work; s — Morel and Paul.22The solid curve is drawn
through the data points to aid the eye. case since precise results for this system have
2030 WONG, ZHANG, AND HANDA
Figure 7. Desorption kinetics for the system
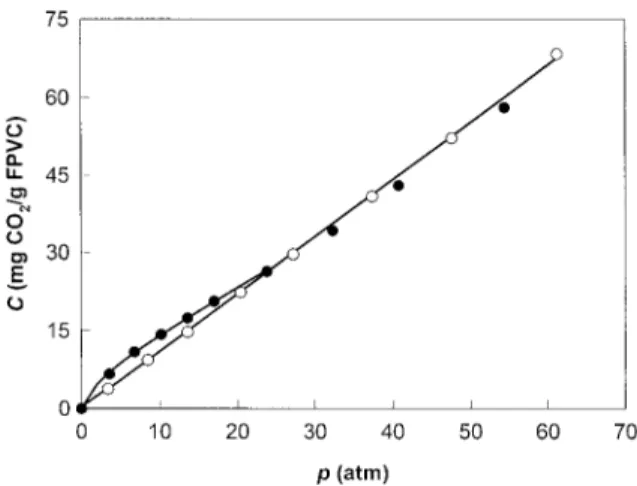
FPVC-Figure 5. Solubility of CO2 in FPVC at 357C. s —
CO2 at 357C when the pressure was decreased from
sorption run; l — desorption run. Curves are drawn
10.2 to 6.8 atm. l — measured values; curve 1 is the fit through the data points to show the trend.
of the data points in terms of eq. ( 3 ) ; curve 2 is a plot of the data in terms of the function on the right hand side of eq. ( 4 ) .
ture on the solubility and diffusivity characteris-tics of CO2 in PVC. Equilibrium solubility values
of 75 mg CO2/ g polymer at 207C4and 71 mg CO2/
7 is the plot for the right-hand side of eq. ( 4 ) , and g polymer at 257C5at 48 atm have been reported.
the momenttis simply given by the area under These results were obtained by saturating the
this curve. The diffusion coefficients calculated by polymer in a pressure vessel and then weighing
the two techniques from analysis of the desorption under ambient conditions. Our values of 52 and
data for the FPVC-CO2 system at various
pres-55 mg CO2/ g polymer at 357C and 48 atm
deter-sures are shown in Figure 8, where the values of mined in situ for FPVC and UPVC, respectively,
D are plotted against the average concentration are quite different from the literature values.
corresponding to the pressures before and after A typical desorption kinetic curve for
FPVC-the desorption step. For FPVC-the most part, FPVC-there is CO2 as the pressure was decreased from 10.2 to
excellent agreement between the two techniques. 6.8 atm is shown in Figure 7. The discrete points
The hybrid method does consistently yield slightly are the measured values, and, to avoid clutter,
higher values than the moment method and does only the data at selected intervals is shown. The
solid curve through the data points is the fit in terms of eq. ( 3 ) . The other solid curve in Figure
Figure 8. A comparison of the diffusion coefficients obtained using the hybrid method, eq. ( 3 ) , and the mo-ment method, eq. ( 5 ) , for CO2in FPVC at 357C as a
function of average concentration. The values shown
Figure 6. Solubility of CO2in UPVC at 357C. s —
sorption run; l — desorption run. Curves are drawn are from the desorption runs. l — hybrid method; s — moment method.
only to show trends in the results. At 30 and 907C where HFC134a is subcritical, the shape of the isotherms was found to be the same when solubili-ties were plotted against fugacity or activity of HFC134a. The plasticization effect of HFC134a on PS is quite small. The Tgis depressed to 887C at 20 atm.24
Thus, the sorption isotherms at 30 and 907C would be expected to show dual-mode type behavior similar to that seen for PS-CO2in
Figure 4. However, as seen in Figure 9, no such distinct dual-mode behavior is observed. The ab-sence of the dual-mode character at 307C may be due to the rather limited pressure range avail-able. At 907C, a slight curvature is seen and this
Figure 9. Solubility of HFC134a in PS at 30, 90, and diminished dual-mode signature may be due to 1207C. For each temperature, a curve is drawn through the proximity of the system to its T
g. It is also the data points to show the trend. possible that the relatively large size of HFC134a prevents it from entering the Langmuirian sites. This is reflected in the low diffusion rates of capture the fine details of gas transport in terms
of identifying the onset of plasticization at about HFC134a in glassy PS obtained from the sorption kinetics. At 30 and 907C, the diffusion coefficients 30 atm. Errors in using the moment method can
arise if an accurate value of M`is not known and showed almost no dependence on concentration.
The average values of D obtained at 30 and 907C if the kinetic run is stopped short of reaching
equi-librium. On the other hand, the hybrid method are 4.1 1 10011
and 6.7 1 10010 cm2
s01,
respec-tively. At 1207C, the diffusion coefficients are 2 – can be used to determine M`while simultaneously
determining the diffusion coefficient. 3 orders of magnitude higher and showed a weak pressure dependence; the D values increased from Literature values of infinite dilution diffusion
coefficient of CO2in PVC are 8 1 1009cm2s01at 1.2 1 1008cm2s01at infinite dilution to about 3.6
1 1008cm2
s01at 35 atm.
357C determined from permeability time lags,23
and 2 1 1009cm2
s01at 257C5
and 1.3 1 1008cm2
The in situ technique described here can be used for a variety of gases and vapors, is fast, and s01at 207C and 48 atm4determined from sorption
kinetics using eq. ( 1 ) truncated after the first provides highly precise values of solubility and diffusivity. Measurements over extended ranges term on the right-hand side. We obtained values
of 0.8 1 1009and 0.3 1 1009cm2
s01for the infinite of temperature and pressure on the solubility and
diffusivity of blowing agents for producing poly-dilution diffusion coefficient of CO2in FPVC and
UPVC, respectively; in general, the diffusion coef- meric foams are now being carried out, and will be reported in forthcoming articles.
ficients were found to be higher for FPVC than for UPVC due to the plasticizing effect of the
addi-tive in FPVC. Our values are about an order of The authors thank Floyd Toll and Graham McLaurin magnitude lower than those reported by Berens for the technical assistance provided during the equip-and Huvard.5
It should be noted that, in the latter ment set-up. This study was issued as NRCC No. 41965.
case, the low pressure results were obtained using an electrobalance, the high pressure results were obtained by weighing the samples under ambient
conditions, and there was considerable scatter in
REFERENCES AND NOTES
the derived diffusion coefficients. The largescat-ter in diffusion coefficients found among the
lit-1. R. M. Felder, J. Membr. Sci., 3, 15 ( 1978 ) . erature values may also be due to the varying
2. C. M. Balik, Macromolecules, 29, 3025 ( 1996 ) . amounts and the different kinds of additive in the
3. W. J. Koros, A. H. Chan, and D. R. Paul, J. Membr. PVC samples used. Sci., 2, 165 ( 1977 ) .
The equilibrium solubilities of HFC134a in PS 4. V. Kumar, J. E. Weller, and R. Montecillo, SPE were determined at three temperatures and the ANTEC Tech. Papers, 38, 1452 ( 1992 ) .
results plotted against pressure are shown in Fig- 5. A. R. Berens and G. S. Huvard, ACS Symp. Ser.,
406, 207 ( 1989 ) .
2032 WONG, ZHANG, AND HANDA
6. W. J. Koros, D. R. Paul, and A. Rocha, J. Polym. 15. G. K. Fleming and W. J. Koros, Macromolecules, Sci. Polym. Phys. Ed., 14, 687 ( 1976 ) . 19, 2285 ( 1986 ) .
7. Y. Kamiya, T. Hirose, K. Mizoguchi, and Y. Naito, 16. Y. Kamiya, T. Hirose, Y. Naito, and K. Mizoguchi, J. Polym. Sci.: Part B: Polym. Phys., 24, 1525 J. Polym. Sci.: Part B: Polym. Phys., 26, 159
( 1986 ) . ( 1988 ) .
8. Y. P. Handa, J. Roovers, and P. Moulinie´, J. Polym. 17. G. K. Fleming and W. J. Koros, J. Polym. Sci.: Part Sci.: Part B: Polym. Phys., 35, 2355 ( 1997 ) . B: Polym. Phys., 28, 1137 ( 1990 ) .
9. S. Angus, B. Armstrong, and K. M. De Reuck, eds., 18. Y. Kamiya, Y. Naito, T. Hirose, and K. Mizoguchi, Int. Thermodyn. Tables of the Fluid State, Carbon J. Polym. Sci.: Part B: Polym. Phys., 28, 1297 Dioxide, Vol. 3, Pergamon Press, New York, 1976. ( 1990 ) .
10. J. M. Prausnitz, R. N. Lichtenthaler, and E. G. De 19. Y. Kamiya, K. Mizoguchi, and Y. Naito, J. Membr. Azevedo, Molecular Thermodynamics of Fluid- Sci., 93, 45 ( 1994 ) .
Phase Equilibria, Prentice-Hall, Englewood, NJ,
20. Y. Kamiya, Y. Naito, and D. Bourbon, J. Polym. 1986.
Sci.: Part B: Polym. Phys., 32, 281 ( 1994 ) . 11. J. H. Dymond and E. B. Smith, The Virial
Coeffi-21. W. R. Vieth, J. M. Howell, and J. H. Hsieh, J. cients of Pure Gases and Mixtures, Clarendon
Membr. Sci., 1, 177 ( 1976 ) . Press, Oxford, 1980.
22. G. Morel and D. R. Paul, J. Membr. Sci., 10, 273 12. S. S. Jordan and W. J. Koros, Macromolecules, 28,
( 1982 ) . 2228 ( 1995 ) .
23. B. P. Tikhomirov, H. B. Hopfenberg, V. Stannett, 13. Y. Kamiya, K. Terada, K. Mizoquchi, and Y. Naito,
and J. L. Williams, Makromol. Chem., 118, 117 Macromolecules, 25, 4321 ( 1992 ) .
( 1968 ) . 14. R. C. Reid, J. M. Prausnitz, and B. E. Poling, The
24. Z. Zhang and Y. P. Handa, J. Polym. Sci.: Part B: Properties of Gases and Liquids, McGraw-Hill,