Challenges and Opportunities in the Tunisian
Private Equity Sector
By Moez Gharbi
SUBMITTED TO THE MIT SLOAN SCHOOL OF MANAGEMENT IN PARTIAL FUFILLMENT OF THE
REQUIREMENTS FOR THE DEGREE OF MASTER OF SCIENCE IN MANAGEMENT STUDIES
AT THE
MASSACHUSETTS INSTITUTE OF TECHNOLOGY JUNE 2012
V 2012 Moez Gharbi. All Rights Reserved.
The author hereby grants to MIT permission to reproduce and to distribute publicly paper and electronic copies of this thesis document in whole or in part in any medium now known or
ARCHIVES
JUL
BR R E
hereafter created.
Signature of Author:
MIT an School of Management May 11, 2012
Certified By:
Gordon Y Billard Professor of Management, Deputy Dean at
S.P. Kothari MIT Sloan School of Management
Thesis Supervisor
Accepted By:
(U
Michael CusumanoFaculty Director Master of Science in Management Studies
Challenges and Opportunities in the Tunisian Private Equity Sector
By
Moez Gharbi
Submitted to the MIT Sloan School of Management on May 11, 2012 in partial fulfillment of the requirements for the degree of
Master of Science in Management Studies
Abstract
Most of the studies and research analyzing the private equity ("PE") sector in the Middle East North Africa ("MENA") region tend to focus more on the Middle East and less on North
Africa. The case of Tunisia is probably the most appealing within the North African region regarding the transformational phase the industry is going through there. Accordingly, the main objective of this thesis will be to provide some keys to understand the dynamics of private equity in Tunisia.
The recent uprising has shown how ardently people are seeking a radical change in the current political and socio-economic model. Studying the private equity sector in Tunisia whilst balancing the underlying hurdles and opportunities, is certainly a first step towards understanding a complex but fundamental issue: how and to what extent can the promotion and the revitalization of investments in the country's private sector constitute a key lever for the government to meet the social claim for a sustainable development?
First of all, I believe it is essential to apprehend the backdrop of Tunisian private equity by analyzing global trends of the private equity industry, the rise of interest in emerging markets as well as the current macro environment in Tunisia. I will then examine the drivers and fundamentals of PE investment in Tunisia by analyzing the current framework in place and the specificities of the private equity lifecycle - from fundraising to exit. Finally, I will endeavor to investigate the hurdles various stakeholders might face as well as the opportunities they might enjoy, and I will ultimately highlight some of the options available to overcome obstacles and take advantage of favorable circumstances.
Thesis Supervisor: S.P. Kothari
Title: Gordon Y Billard Professor of Management, Deputy Dean at MIT Sloan School of Management
Acknowledgements
First and foremost, I would like to express my sincere gratitude to my thesis supervisor, Professor S.P. Kothari, who has supported me and provided me with valuable advice throughout my thesis.
My appreciation and gratitude also go to all the people who kindly accepted to meet with me in Tunisia and provided me with their valuable inputs about the Tunisian private equity sector. I owe the greatest debt - in alphabetical order - to Amine Allam, Issam Ayari, Amine Belaicha, Selma Bellagha, Abdelwaheb Ben Ayed, Khaled Ben Jilani, Ahmed Benghazi, Aicha Ennaifar, Ouissem Ghorbel, Cyril Grislain, Safia Hachicha, Elyes Jeribi, Emna Kallel, Maher Kallel, Mondher Khanfir, Houssem Kheder, Taha Loued, Ghazi Meziou, Mourad Mzali, Slim Ouali, Ziad Oueslati, Nabil Triki, and Slim Zeghal.
I would also like to thank Julia Sargeaunt and the team in charge of the Master of Science in Management Studies program for their unfailing support and commitment to improve my overall experience at MIT Sloan.
Finally, I would like to give very special thanks to my parents and friends for their love, their continuous support and their invaluable suggestions.
Table of Contents
1 The Backdrop of Tunisian Private Equity ... 8
1) W hat is Private Equity? ... 8
2) What are the Current Global Trends and Dynamics in the Industry?...10
A) Recovery in Private Equity Activity after the 2008-2009 Doldrums ... 10
B) Shift towards Em erging M arkets... 21
3) Rationale for Investing in Tunisia: a Top-Down Perspective... 29
A) M acroeconom ic Fundam entals ... 29
B) Investm ent Environm ent... 33
2. Specific Features of Private Equity in Tunisia ... 37
1) W hy is Private Equity Im portant for Tunisia? ... 37
2) O verview of Private Equity in Tunisia... 39
A) D om estic Private Equity Funds ... 39
B) O ffshore Private Equity Funds ... 55
3) From Fundraising to Exit: The Private Equity Lifecycle in Tunisia...57
A) The Fundraising Phase ... 59
B) The Investm ent Period... 64
C) The Holding Period ... 83
D ) The Exit Phase... 87
3. Conclusions and Recom m endations... 92
1) Is Tunisia Attractive for PE Investors?... 92
A) Strengths ... 92
B) W eaknesses...92
C) O pportunities...94
D ) Threats ... 95
E) SW O T Analysis Sum m ary... 95
1. The Backdrop of Tunisian Private Equity
1) What is Private Equity?
Private equity ("PE") is the provision of equity capital by financial investors to private companies. The private equity community includes independent private equity and venture capital ("VC") funds as well as merchant banking subsidiaries of large institutions (investment banks, insurance companies, or even industrial companies).
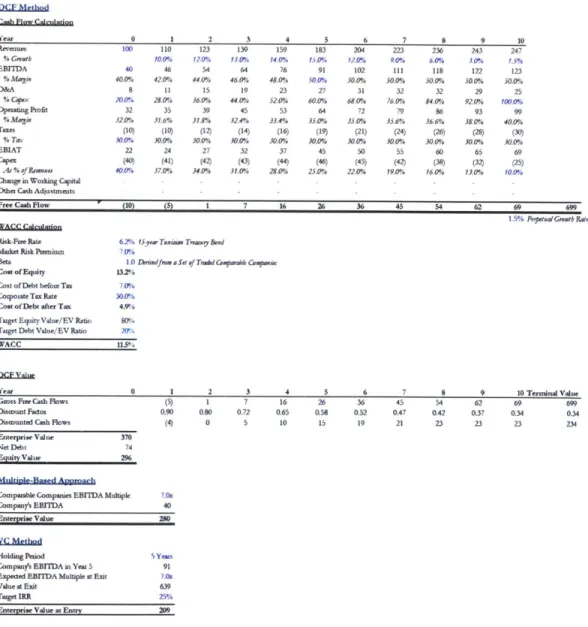
As displayed in Figure 1.1, a team of private equity professionals typically sets up a fund partnership and raises money from a number of institutional investors. The management company owned by the PE professionals is the general partner ("GP") of the fund while the investors who provide the capital to invest are the limited partners ("LPs"). PE professionals typically invest the money raised from the LPs in private companies and split the share of profits with their investors upon liquidation of the fund. According to the industry standard, the GP usually charges a 2% management fee on the committed capital and a 20% carried interest on profits made. Once the capital is committed from LPs, PE professionals look for potential targets and call the capital as they source transactions (the investment period generally lasts 4 to 6 years). Portfolio companies are held for a period usually ranging from 4 to 7 years during which PE professionals seek to create value in order to reach an internal rate of return ("IRR") of 20-30% once they exit the company.
Figur 1.1:
Typical PE Fund Setup in the US
Equity Owne Gexneral Partner ("GP")
400
capital ContributionThere are several features that distinguish private equity investing from other types of passive investing'.
- Private equity investment is an active type of investment by nature. Private equity professionals are typically actively involved in screening investment opportunities, negotiating and structuring deals once potential targets are identified, monitoring and guiding portfolio companies. They often hold one or several board seats and actively advise company on strategic and financial matters.
- Private equity investments have a limited lifetime. The contractual obligation for GPs to liquidate the fund after a certain number of years (usually 10 to 12 years). Therefore, private equity investments are not meant to be held indefinitely and all the funds coming from the sale of portfolio companies are distributed upon the liquidation of the PE fund. - The securities purchased are generally privately held by a small group of investors (they
are not publicly traded). Even in the rare cases whereby a PE fund invests in a publicly-held company, the securities purchased are non-public.
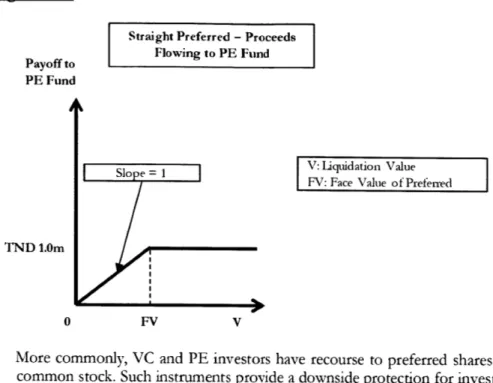
- Private equity investments often involve significant risk-taking. The fact that PE investors seek high returns is related to the significant level of risk involved in typical private equity investments. They intend indeed to deliver "geometric" returns rather than low-yielding returns provided for example by senior debt instruments. Financial instruments typically involved in PE transactions include common stock, convertible preferred stock or convertible subordinated debt (embedding a conversion feature into common stock), non-convertible preferred stock or non-convertible subordinated debt accompanied by "equity-kickers" (warrants), risky debt securities purchased at discount (usually in a turnaround deal).
- Private equity investors give a great importance to the quality of the management in portfolio companies. The skills and quality of people managing portfolio companies are seen as crucial to make high returns possible.
- Private equity investors seek a certain level of control. In case they do not purchase a controlling stake in the portfolio company, private equity investors typically seek to guarantee a certain level of control through contractual agreements and board representation.
- Private equity investments are expensive in terms of cost of capital in the sense that the equity-type returns sought by PE professionals need to be in line with the level of risk involved in their investments. Therefore, it is much more expensive for a company to raise private equity capital rather than traditional debt. In typical cases, the returns compensating PE investors not only factor in the idiosyncratic risk but also the illiquidity of the investment and the advisory services.
Experts commonly distinguish several types of private equity investment'.
- Venture Capital: This type of investment targets companies at the early stage of their corporate cycle. Venture capital professionals typically invest along with entrepreneurs seeking to start a business. Such start-up transactions can be categorized into seed money investments (targeting potential businesses still requiring substantial research, ' Jack S. Levin, "Structuring Venture Capital, Private Equity, and Entrepreneurial Transactions", 2010
development, or other important milestones before starting revenue-generating operations) and early-stage venture capital (financing start-up companies which are ready to begin or have recently begun revenue-generating activities).
- Growth Capital: Private equity professionals investing in the growth capital area target
companies with a proven track-record (and most of the time already generating positive cash flows) but seeking capital to grow and expand their business activity (for example to develop a new product, build a new plant, expand distribution and market reach, start operations in a new country, acquire another company, etc.).
- Industry Consolidation: PE professionals can undertake a strategy of industry
consolidation when they identify a fragmented market with a number of relatively small players and no market leader. In this case, they typically acquire one of the many players which will act as an industry platform for future roll-ups. Private equity investors then help the company buyout several players or start operations in markets where there is no desirable target business (or existing similar businesses) in order to create a national or regional leader.
- Leveraged Buyout: Private equity professionals operating in the leveraged buyout (or
"LBO") field look for mature companies with very stable and visible cash flows. The rates of return generated exclusively by growth potential and operating efficiency usually do not meet private equity targets. In this area of private equity, investors often use financial engineering by levering up the company in order to take advantage of the leverage effect (as long as the return on assets is higher than the cost of debt, a high amount of debt can significantly increase the return on equity).
- Turnaround Investments: This type of investment involves the purchase of securities in a
troubled company which is suffering losses, is over-leveraged, and/or is facing other financial and business setbacks. Turnaround investors may also purchase a portion of the troubled company's distressed debt (trading at a high discount) in order to obtain control of the company in case of bankruptcy or restructuring.
2) What are the Current Global Trends and Dynamics in the Industry?
A) Recovery in Private Equiry Activity after the 2008-2009 Doldrums
The global financial and economic recession severely hit the private equity sector as deal activity, exits and fundraising faced a dramatic decline in 2008 and 2009, not to mention the sharp decrease and big balance sheet write-downs of portfolio companies due to an overall drop in valuation levels. Nevertheless, signs of recovery are clear now as activity picked up in 2010-2011.
Global Private Equity Deal Activity
After five years of continued growth with a peak in 2006 at almost $700 billion (globally), private equity deal activity dramatically shrank under the effect of the financial and economic crisis. Before the crisis hit, the sector experienced a tremendous expansion mainly driven by cheap financing, strong economic growth, asset price escalation and institutional investors'
willingness to allocate a significant amount of funds for PE firms. The sharp reversal experienced by the credit market in the summer of 2007 entailed a strong rise in risk aversion and a dry-up of loan securitization, in particular collateralized loan obligations or "CLOs" on which large buyout firms were dependent to finance leveraged transactions. This important change in the credit market directly affected the ability if private equity firms to borrow under favorable conditions and consequently their capacity to generate deals. The climate of economic uncertainty and poorer performance of portfolio companies has made PE professionals more doubtful about investment opportunities and focus more on restructuring their existing investments.
However, overall deal activity started picking up again at the end of 2009. With a CAGR of +91 % over 2010-2011, private equity-backed M&A transactions increased from $71 billion in 2009 (lowest level since 2001) to $258 billion in 2011 (in line with volume levels in 2004-2005) along with the global economic recovery (Figure 1.1).
Figure 1.1
USD Bilion Global Private Equity Deal Activity
900 - /54% 154% 800 /35 S 700 -- --- -600 ----300 - -200 20113 99 1418 10 30 32 180, 95 96 97 98 99 00 01 02 03 04 05 06 07 08 09 10 11
nGlobal Buyout Deal Value -% Growth
Soume: Bain Global Private Equit y Report 2011, Preqin Research Report "2011 Private Equity Deahr and Exits"
Private equity experts agree that the current trends in private equity deal activity is driven by the factors listed below.
- A huge and aging "dry powder"
At the end of 2009, private equity firms had approximately $1 trillion of dry powder - the amount of capital committed by LPs to private equity funds but remaining uncalled -, half of which for buyouts (other categories mainly include real estate, venture capital, distressed PE,
mezzanine)2
. More importantly, the dry powder for many of the PE firms is aging capital needs to be urgently put to work. As PE funds have typically an investment period of 4 to 6 years and very high amounts of capital were raised between 2005 and mid-2008 (Figure 1.2), GPs are under pressure to invest before the investment period expires; otherwise, they would end up losing management fees associated to invested capital and loose somehow their "credibility".
Valuation levels higher than expected
This pressure on GPs to invest is important to understand why the deal activity picked up as soon as the economic environment showed some signs of improvement. However, one of the perverse effects of this ticking clock is that valuations surprisingly came back to high levels. According to Bain & Company', strong competition made acquisitions pricey and drove valuation levels almost up to the levels seen before the crisis (in 2010, on average 8.5x EBITDA in the US and 9.2x EBITDA in Europe). Most GPs were expecting to pay between 5.Ox and 7.Ox EBITDA2. Wary of overpaying, some of them preferred financing and supporting their portfolio companies rather than purchasing new assets and underestimating downside risks. Therefore, one might reasonably induce that the rebound in PE deal activity could have been even stronger if prices were more in line with downside risks related to the uncertainty hanging on global economic conditions.
- A renewed but still fragile credit market
Leveraged loans suffered from the crisis and decreased from over $700 billion freshly issued in 2007 to slightly over $100 billion in 2009'. Moreover, the fact that CDOs almost disappeared (from $1 trillion in 2006-2007 to barely $3 billion in the first semester of 20115) is a key element to understand the current trend in private equity deal financing.
However, the appetite of credit markets for high-yielding assets significantly increased as the general level of interest rates is low (due to the expansionary monetary policy undertaken by central banks). Approximately $100 billion3 of fresh leveraged loans were issued in 2010 versus
$150 billion only in the first semester of 2011. "Covenant-lite loans" which are popular with companies owned by private equity firms because of less stringent conditions on the borrowing company, are now back on the market after 3 years during which almost no "cov-lites" were sold. The risk appetite of banks for those high-yielding products faces a structural challenge though: as
the regulatory framework is moving towards more prudence regarding banks' balance sheets, banks are likely to ask for higher returns and drive spreads up in order to make their new model consistent. The "pickiness" of banks, the collapse of securitization and the availability of cash among bond investors have significantly increased the recourse to high-yield bonds. Those securities represented 25% of leveraged financing in 2010 and 2 8% in 2011 whereas their share was barely above 0% before. The volatility in capital markets makes it periodically difficult for PE firms to use high yield bonds to finance acquisitions; however, bridge financing is currentdy flexible enough to allow an opportunistic access to the market.
The renewed access to financing is an important driver of the current PE deal activity. The overall system has become "healthier" and more risk averse than it used to be before the crisis (Table 1.1).
3Bain, "Global Private Equity Report", 2011 4
S&P LCD, 2011 s SIFMA, 2011
Table 1.1'
Leverage
Structure
Minimum Equity Contribution
Repayment Pricing Covenants Syndication Q2 2007 7.Ox
Senior, Second lien, PIK 20%
All bullet
Senior: Ubor + 2.25% Second Len: Libor + 4.0*/o
PIK Libor + 9.0%
Leverage only
Up to 100% underwriter
2011/2012
4.0x-5.Ox
Senior / Mezzanine or High yield bond
30-45%
Partly amortized, partly bullet
Senior. Libor + 5.0-6.0% Mezzanine / High yield: Libor + 10.0-12.0%
Leverage, interest rate coverage, cash-flow cover, capital expenditure More than one bank (or club syndicate for
smallerdeals)
Global TInIds in I undrah ising;/<
The fundraising activity of private equity firms also steeply declined over 2007-2009 and continued to decline in 2010 (capital raised divided by 3 over the three-year period) while it increased only by 15% in 2011 (Figure 1.2).
Figure 1.2
Global Fundraising Activity
USD Billion 800 700 19% -600 -d / -4 %.67% -, 335% 21 15% 500 (28 400 - - - -334 900 30 - 9296-- - - - 25T - ~ ~ -220 20828 200-- -- 142 141 100 3 4 9 95 96 97 98 99 00 01 02 03 04 05 06 07 08 09 10 11
MGlobal PE Capital Raised -% Growth
Soune: Bain Global Private Equigi Report 2011, Preqin Research Report "2011 Private Equiy Fundraising"
As previously developed, private equity funds wield a huge amount of dry powder (slightly under $1 trillion in 2010) due to the high level of fundraising activity pre-crisis. However, GPs
6 Indicative information provided by a professional during a presentation at the Alternative Investment Conference at LSE in January 2012
are currently having difficulties to raise fresh money from LPs (half of PE funds which closed in 2010 and 35% in 2011 have not managed to raise their target amount). Several factors justify the tightness of the fundraising market.
- Overcrowd in GPs seeking to raise funds
The imbalance between LPs' liquidity shortage and the volume of funds sought by GPs partly explains why a significant number of GPs were not able to raise their target amount. According to a study conducted by Preqin, there are currently 1,814 funds on the road seeking to raise an aggregate value of $744 billion whereas only $262 billion were raised in 2011.
Fige 1.3
Private Equity Funds in Market, 2008-2012
2,000 1,8001 1,600 1,400 - --1,200 -_ --- _-1,000 -= -800 ----602 600 400 200
January 2008 January 2009 January 2010 January 2011 January 2012
R# of Funds Raising E Aggregate Target ($bn)
Soure: Preqin, 2012
- Negative impact of dry powder
The large amount of uncalled capital and the currently high valuation levels raise doubts about opportunities for private equity investments. The c. $1 trillion of capital commitments also represents a huge overhang for LPs as they will have the contractual obligation to supply GPs with liquidity once capital calls are triggered.
- Capital allocation impacted by the valuation of other asset classes ("denominator effect")
As displayed in Figure 1.4, most of private equity capital is committed by institutional investors.
Figure 1.4
PE Investment Breakdown by Type of LP in 2010 (%)
3% 3% E Public Pension Funds
4%
N Private Pension Funds 6%
29% M Foundations
MBanks
9%
* Insurance Companies * Sovereign Wealth Funds 9 Investment Companies N Goverment Agencies 13% U Family Offices 9% M Other 12% Source: Preqin, 2011
Institutional investors usually allocate their investments in private equity as a proportion of their total assets under management (pension funds, which account for 42% of capital committed to PE funds in 2010, allocate for instance on average 6-7% of their assets under management to private equity"). Consequently, as the overall valuation of the assets was hit by the crisis, the absolute amount allocated to private equity investments also shrank. The fact that institutional investors are reluctant to overweight an asset class in their portfolio dramatically reduces the
room for more commitments to private equity GPs.
- Mismatch between calls and distributions
Although PE exits recently picked up, a study conducted by Bain & Company3 shows that capital calls have surpassed capital distributions since 2007. It is indeed common during the lifecycle of a private equity fund (that is to say before its liquidation) that GPs distribute part of the capital to LPs as they exit some of their investments. The fact that capital calls currently outpace distributions increases the liquidity pressure on LPs.
- GP-LP relationship toughened up
The rate of re-ups by GPs has decreased since 2007, which reflects the fact that LPs are seeking to invest with top quartile funds and are now favoring quality over quantity. The increased "pickiness" about proven track record, the more intense and exhaustive due diligence required, and finally the tougher negotiations on the compensation and the terms of partnerships, exacerbate the difficulty GPs are facing to raise funds.
According to a survey conducted by Preqin, fundraising is even more difficult for first-time GPs as almost 40% of interviewed LPs closed their doors to first-time funds. The mix of new GP relationships expected in 2012 is shown in Figure 1.5.
Figure 1.5
Investors' Intention to Form New GP Relationships in 2012
3% U
Entirely Allocated to
Re-10% 16% ups with Existing
Managers
" Mostly Re-ups, some New GP Relationships
E Mix of Re-ups and New GP Relationships
2 Mostly New GP
29% Relationships
42%
U Only Investing with New
Managers
Soune: Preqin, 2012
Another indicator of LPs' "pickiness" in committing capital post-2008 is the increase in the average time taken for funds to close (Figure 1.6). While it took on average one year for fund managers to close a fund in 2007, they needed on average more than a year and a half to do so in 2010.
Figue 1.6
Average Number of Months Taken for Funds to Achieve a Final Close by Year of Fund Close 20.0 8.7 18.0 17.6 16.0 14.0 12.0 10.0 8.0 6.0 4.0 2.0 2006 2007 2008 2009 2010 2011
E Average Number of Months
According to an article posted in "Private Equity Manager"', there is a growing tension between GPs and LPs over terms in funds' formation, more especially about fee structure. Quoting the journalist, "as the world crawled out of economic malaise and back into investment mode, LPs made clear they would no longer accept uniform charges across funds of varying performance". Typically, the compensation of GPs follows the "2-20" rule: funds' managers receive 2% of committed capital ("management" fee) and 20% share of the upside ("performance" fee). Such structure can entail a misalignment of interests because of the significant amount management fees represent (GPs would be less incentivized to deliver high performance returns). A research conducted by Oliver Gottschalg and Bernd Kreuter shows that GPs earn on average more than three times in management fees than in carried interest. This element combined to the current slowdown in PE activity explains why LPs have become more sensitive to fee structure. According to Bernd Kreuter, head of alternatives at Feri Institutional Advisors, "there is a risk a GP will be more concerned about their ability to raise a next fund instead of maximizing returns for their current investors". As a matter of fact, one of the most preeminent institutional investors, the California Public Employees' Retirement System ("Calpers"), won fee concessions from CIM Group and Apollo Management of $175 million in 20119. Therefore, LPs now tend to toughen their due diligence of fund managers. According to Bela Schwartz, CFO of The Riverside Company, "more LPs are asking for a firm's budget or projection of future operational expenses".
Fees charged to portfolio companies are another way for PE firms to generate revenues. Those fees are mainly composed of "deal" fees (charged to portfolio companies post-transaction) and "monitoring" fees (paid by portfolio companies to PE owners for their advisory services). A study conducted by Preqin and Dechert LLP shows that such fees significantly increased in 2009 and 2010 (Figures 1.7 and 1.8). One could reasonably assume that the increased tension with LPs over compensation has pushed GPs to increase fees charged to their portfolio companies.
Figure 1.7
Average Transaction Fee as Percentage of Deal Size: 2005-2008 vs. 2009-2010
1.40% T-- 1.28% 1.28% 1.24% 11.20%2-1 .2 0 %
~0
.9 9 %1 . 4 1.00% -0.80% 0.80% 0.60% 0.40% -0.20% 0.00%Less Than $500 Million $500 Million to $I Billion More Than $1 Billion
02005-2008 E2009-2010
Soun-e: Preqin & Decbett LLP, 2012
9 htp://www.p uiymanagr.cojm, Nicholas Donato, "Fees Trump Carry in GP Compensation", 20-July-2011
Figure 1.8
Average Monitoring Fee as Percentage of EBITDA: 2005-2008 vs. 2009-2010
3.00% - - -2.53% 2.50% -l.00%/ 0.50%/ 0.00%
Less Than $500 Million $500 Million to $1 Billion More Than $1 Billion
02005-2008 M2009-2010
Soune: Preqin & Dechert LLP, 2012 - More optimism among LPs
As the activity is recovering, there is currently an overall sentiment of optimism among investors regarding their commitments in private equity investments. As shown in a survey conducted by Preqin (Figure 1.9), only 40% of the investors interviewed expected to commit less capital in 2011 than in 2010.
Figure 1.9
Amount of Capital Committed in 2011 Compared to 2010
12/ 1% mSignificantly More Capital
in 2011 than in 2010
*Slightly More Capital in
11% 2011 thanin 2010
ESame Amount of Capital in 2011 as in 2010
18%
E Slightly Less Capital in 2011 thanin 2010
17% 0 Significantly Less Capital
in 2011 thanin 2010
E Did not Invest in 2010 but Investingin 2011
27%
Moreover, private equity as an asset class has historically delivered higher returns than the equity and bond markets (Figure 1.10). The industry performed relatively well throughout the financial and economic crisis. The higher performance of private equity investments is underpinned by a study conducted by A.T. Kearney in 2011 showing that private equity-owned firms provide a better top-line performance and turned to be more resilient to the crisis in 2009
(Figure 1.11). Figure 1.10
Private Equity Returns versus Equity and Bond Returns, as of 31 December2010
14.0% 12.8% 12.0%--9.9% 10.0% - ---8.0% 6.0% -- --- --- 5.6% 6.0% -2.0%
T
0.00/A0 -2.0% -4.0% --- -- -2.9%----US Private Equity Index DowJones S&P 500 Barclays Govt / Credit Index
N3Years N25 Years
Soune: Cambridge Assocates, 2011
Figure 1.11
Revenue Growth of Private-Equity Owned Companies versus Peer Companies*
20.0% 14.8% 15.0% 11. 10.0% 5.0% 0.0% -5.0% Bond 12.5% -10.0%-91 -15.0% 2007 2008 2009
N Private Equity-Owned Companies N Peer Companies
'Based on 109 privat eqij-ownedftrmi in Germmay, Ausfhia ad Suitrand and apeer gmap of 309 companies
Soue: A.T. Keamy Report, 2011
--The attractive "alpha" delivered by the industry translates into a high "satisfaction rate" among LPs (Figure 1. 11). According to a study conducted by Preqin, 63% of investors expect their private equity returns to be 400 basis points higher than returns in public markets, and a quarter of them expect a positive difference of 200-400 basis points. This element constitutes a positive sign regarding future fundraising activity. However, the overall attractive performance
should not hide the difference between top-tier and less performing PE funds and the fact that LPs are expected to be choosier in their future private equity commitments.
Figure 1.12
LPs' Expectations about their Private Equity Investments, as of 31 December 2011
6% 19%
" Expectations Exceeded
" Expectations Met
" Expectations Not Met
75%
Soun: Preqin, 2012
Although there is a cyclical trend in rates of return delivered by private equity funds (crises have an adverse impact on returns whereas macroeconomic growth entails high positive returns), returns generated by vintage year (the year in which the fund is launched), which constitutes a better indicator to LPs, have proved to be counter-cyclical over time (Figure 1.13)'0. More precisely, in a period of economic downturn, private equity investments generate higher returns. This might be due to more scrutiny in investments and lower asset prices. According to Deutsche Bank, this anti-cyclical correlation is even truer for top-quartile funds. Even though the overhanging dry powder drives valuation levels up, the current gloomy economic prospects could paradoxically generate higher returns by vintage year in the future.
Figure 1.13
GDP Growth and Returns on Private Equity Investments by Vintage Year, USA
35% 30/0 25% 200/ 15% 10% 5% 0/0 1 F F F 1 I 1 - TT I f I T 1 F 86 87 88 89 90 91 92 93 94 95 96 97 98 99 00 01 02 03 04 05 06 07 08 09
- Private Equity IRR (Left) -- Real GDP Growth (Right)
6.0% 5.0% 4.0% 3.0% 2.0% 1.0% 0.00/0 -1.0% -2.0% -3.0% -4.0%
Sounre: Deutsche Bank Repor, Bunau of Economic Analysis
B) Shift towards Emerging Markets
R/Se
O/ Initeres! l ,/ tetrig A lIarketsAs shown in Figure 1.14, private equity activity in emerging markets ("EM") has strongly increased since 2004 in terms of funds raised and capital invested:
- Funds raised grew from $7 billion in 2004 to $39 billion in 2011 with three major trends: a sharp increase from 2004 to 2008 with a peak in 2008 at $67 billion, a strong decrease in 2009-2010 at $23 billion for both years, and finally a significant recovery in 2011 with total funds raised standing at $39 billion. In terms of percentage of global fundraising, 2011 was historically the strongest year with funds raised targeting emerging markets peaking at 15% of global funds raised. This element shows the stronger investors' appetite for private equity investments in emerging markets.
- Private equity capital invested in emerging markets also significantly grew between 2004 and 2008 from $7 billion to $48 billion with a peak in 2007 at $53 billion. Despite the sharp decrease in 2009 to $22 billion, capital invested in emerging markets as a percentage of global private equity investments in 2009 was at a historical peak. This fact reflects the resilience of emerging markets to the global financial and economic crisis as well as the availability of investment opportunities in such markets.
Figure 1.14
Private Equity in Emerging Markets: Fundraising and Investments
USD Billion 1001 14 13% 3 5% 4%4 80-14%% 1/ -110-4 7% 7% 70 5%/ 4 5% -6 60 3 95 508 40 - - - - __ -___ 30 20 - -10 - --3 2002 2003 2004 2005 2006 2007 2008 2009 2010 2011
MFunds Raised (USD Billion) M Capital Invested (USD Billion)
-*-Funds Raised (% of Global Total) -*-Capital Invested (% of Global Total)
Soumre: EMPEA
)if/ereti/ I'd
m0d
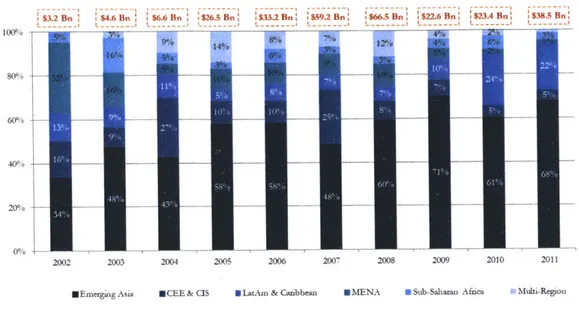
gw ih "E L;ergoig A larkets" GnipAs indicated by Figure 1.15, private equity fundraising targeting emerging markets was primarily captured by (emerging) Asian countries (with China on the front line). The preeminence of Asian countries has been particularly steady since 2008, with a share of 60% to 71% of total funds raised in emerging markets. One should also notice that the share of Latin American and Caribbean countries significantly increased in 2010 and 2011 (respectively 24% and 22% whereas the arithmetic average from 2002 to 2008 was around 9%). On the other hand, the share of CEE & CIS and MIENA in EM fundraising post-2008 significantly decreased (respectively 5% and 1% in 2011). Finally, Sub-Saharan Africa's share was historically low (average of 4/6).
Breakdown of Private Equity Fundraising among the "Emerging Markets" Group $3.2 Bn $4.6 Bn $6.6 Bn $26.5 Bn | $33.2Bn |59.2Bn: $66.5Bn: $22.6Bn| $23.4Bn
L --- I --- -I --- I L- - -- i- - -- i L----I L----
---2002 2003 2004 2005 2006 2007 2008 2009 2010 2011
HEmergong Asia *CEE& CIS NLaLtn & Caibbean EMENA *Sub-Sahami Afnca ;Multi-Region
Souce: EMPEA
Figure 1.16 confirms the dominance of PE activity by Asian countries as their share in total capital invested by far surpassed other emerging regions (average of 63% over 2003-2011 with a peak of 70% in 2011). Emerging Asian countries were followed by LatAm & Caribbean and CEE & CIS regions (each of them displaying a 2003-2011 average of 12% of the total PE capital invested in emerging markets). The MENA region and Sub-Saharan Africa captured the smallest portion of capital investments as they respectively displayed a 2003-2011 average of 5% and 8% of total investments while they represented only 1% and 4% in 2011.
Figure 1.16
Breakdown of Private Equity Investments among the "Emerging Markets" Group
$2.0 Bn $7.0 Bn $7.2 Bn $11.8 Bn L ---- -- ---t O 0- - - - -60% 20% 00/0 2 2004 20 $47.8 11n $22.1 Bn ;S28.Bn $26.8 Bn| 2 008- 20 21 ---1 2008 2009 2010 2011 $34U.7 B n :$53.1 Bn ! L- ---2006 2007
*CEE&CIS ELatAm & Canbbean 0 MENA *Sub-Saharan Africa
Source: EMPEA Figure 1.15 100% W0 60% 40% 20% 0% mEmerging Asia i
Figure 1.17 compares the different emerging regions on the basis of a ratio defined by funds invested over funds raised (at a certain year). A ratio superior to 1.0x indicates that the investment activity is "hotter" than the fundraising activity; on the contrary, a ratio inferior to 1.0x indicates that the fundraising activity is ahead of the investment activity. Several observations can be made:
- The ratio for the Asian region was the most stable over time and the closest to 1.Ox (the arithmetic average over 2002-2011 is 1.0x), which means that the investment cycle parallels the fundraising cycle on average and that investment opportunities justify the high amounts raised in the region.
- The ratio for Latin America & Caribbean was historically above 1.0x (average of 1.2x over 2002-2011). Nevertheless, the region had the lowest ratio in 2011 (0.4x) due to a buoyant fundraising activity.
- The ratio for Sub-Saharan Africa was historically far above 1.0x (average of 1.62x over 2002-2011). One could reasonably infer that funds are put to work faster than they are raised. However, the fact that the ratio fell below 1.0x in 2010 and 2011 suggests that the dry powder in the region increased. In 2011, capital invested was as low as funds raised and the ratio dropped close to 1.0x.
- The ratio for the MENA region was constantly below 1.0x from 2002 to 2008: fund managers in the region increased their dry powder with a "hot" fundraising activity relatively to capital effectively put to work. Nevertheless, the trend reversed in 2009 and 2010 due to a weaker fundraising activity.
- The ratio for CEE & CIS was quite volatile between 2002 and 2007 but it remained constantly above the 1.0x threshold from 2008 to 2011 (the highest ratio among the group in 2011 at 2.0x). This recent trend reflects investors' lower appetite for the region and funds formerly raised being invested.
Overall, emerging markets have been piling up dry powder as investment activity was lower than the fundraising activity when looking at the emerging group as a whole. As a matter of fact, dry powder in emerging markets has increased at a 32% compounded annual rate since 2005" (compared to 8% in Western Europe and 7% in the US).
Figure 1.17
Comparison of Funds Invested/Funds Raised Ratios*
9"
2003 2004 2005 2006 2007 2008 2009 2010 2011
- MENA -Emergmig Asia - CEE & CIS - LatAM & Caribbean Sub-Saharan Afnca
Soum: Based on EMPEA data
'Not adjustedfor "noise" due to multi-regionfunds (lack of data)
Dr'iers o/ Ph Expani in Eeging larkels
As private equity activity in emerging markets is gaining interest among the LPs community, it becomes essential to understand the underlying drivers of PE expansion in such markets. Moreover, this step is important to apprehend Tunisia's positioning in a later stage. In this regard, the central question should be: which factors, when combined, would trigger private equity deal flow in emerging markets?
Five building blocks can be seen as essential for the expansion of private equity in an emerging country12:
a) Availability of Funds
As previously developed, the private equity model is based on a basic GP-LP relationship: typically, a GP would seek funds from LPs in order to manage them in return for performance and management fees. Therefore, when funds provided by LPs are scarce, the private equity deal flow is weak. There are four types of potential LPs for fund managers seeking to raise capital targeting PE investments in emerging markets:
- Development financial institutions (CDFIs"): This group encompasses international
development organizations whose first objective is to promote private sector investments in developing countries. Providing PE fund managers with capital to invest is one way for them to do so. They often play a crucial role in supporting first-time funds in emerging 12 Based on an analysis conducted by the IFC ("Emerging Market Equity: Private Equity, Public Equity, Risks & Opportunities", World Pensions and Investments Forum 2012, Paris, 9 February 2012) and a report published by the Boston Consulting Group ("New Markets, New Rules", November 2010)
40x 3.5x 3.Ox 15x 2.Ox 1.5x LOX 0. 5x O.Ox 4-2002
markets. Some examples of such institutions are the World Bank's International Finance Corporation ("IFC"), the European Bank for Reconstruction and Development ("ERBD"), the Overseas Private Investment Corporation ("OPIC"), the UK's CDC Group, and Germany's DEG.
- State-owned investment vehicles: Governments can play an essential role in PE
expansion by devoting investment vehicles unlocking funds devoted to private equity. In this perspective, sovereign wealth funds ("SWFs") are expected to be on the front line (resources are estimated at $4.7 trillion in 20111"). The accumulation of cash in oil-rich economies (notably in the Middle-East), the surplus of foreign currency reserves in fast-growing economies (e.g. China) as well as the willingness of sovereign wealth funds to invest in alternative assets providing higher returns, should result in a higher inflow of funds toward PE funds in emerging markets from SWFs. However, while some of these SWFs aim at a global reach (e.g., Abu Dhabi Investment Authority, Kuwait Investment Authority), others are more focused in developing the PE sector in their home economies (e.g. Mubadala Development Company in Abu Dhabi, Temasek Holdings in Singapore)".
- Asset managers: This group is composed of financial institutions which have an asset
management activity and whose main aim is to allocate investments in order to optimize their overall portfolio (private equity is one asset class in which they invest among others). Such a group of institutional investors typically includes private and public pension funds, insurance companies, foundations and universities (endowments).
- High-net-worth individuals: High-net-worth individuals can constitute potential LPs for
PE fund managers in the sense that private equity constitutes one of the asset classes they would invest in to manage their fortune. However, individual investors are less reliable than institutional investors due to higher needs in liquidity and generally lower sophistication in asset management.
There are two main factors explaining global LPs' rise of interest in emerging markets: portfolio diversification (less exposure to developed markets and de-correlation) and access to emerging markets' fundamentals (stock markets are usually underdeveloped and do not give direct access to economic fundamentals). LPs often base their investment allocations on proven track records: good track records of PE funds in a country or region can sometimes be vital to sustain fundraising activity.
b) Economic Conditions for Investment Opportunities to Emerge
A market-based economy is essential to attract LPs' interest in private equity investments. As a matter of fact, entrepreneurial activities typically increase, companies within the range of PE ticket sizes emerge, private investments expand and "real" economic growth is not artificially sustained by government interventionism, services and products get more sophisticated while consumer demand is bolstered, management practices improve enough to be interesting for PE investments.
Economy openness is also an important factor to be taken into consideration. Less stringent trade barriers and capital control entail more competitive pressure and push domestic companies to meet international standards in terms of efficiency. The possibility to expand beyond national frontiers makes room for potential regional leaders to grow more substantially. The deal flow is stimulated as companies need more capital to expand offshore, improve operations and become more efficient, large conglomerates might be faced with the necessity to sell off non-core assets.
c) Scalability
Scalability is often decisive to attract capital from potential LPs as most PE investments in emerging markets are categorized as growth-capital private equity. The size of the population and the economy is a good proxy for the potential market (especially for B2C businesses): simplistically, small population and economy would cap potential for growth whereas large population and economy would offer portfolio companies with greater growth prospects. When the domestic market is limited, the economy needs to be at least open enough to allow potential regional expansion.
d) Structural Factors
The transparency and the stability of the legal system, investor protection and corporate governance are critical to measure private equity attractiveness. "Trust" makes it easier for GPs to raise money from foreign LPs, undermines fears from political and legal risks, gives a greater value to contractual agreements, and makes the due diligence processes easier.
An attractive fiscal system can provide incentives to domestic investors. The levels of corporate tax rate as well as the tax on dividends and capital gains are the fundamental elements defining "tax-attractiveness". From the perspective of foreign LPs, double taxation agreements are also essential to avoid additional layers of taxation.
The human and social environment is also an important element to consider for LPs as the cost of doing business in emerging markets is often higher than it is in developed markets. The flexibility of employment, the level of corruption, the overall level of education, the business costs of violence and crime are in this regard indicators assessing to some extent the quality of the human and social environment.
e) Banks and Cap~ital Markets
The quality and sophistication of bank lending and debt capital markets facilitate investments in lower growth companies. The possibility of leveraged acquisitions can increase deal flow as slower growth companies become viable targets. However, an easy access to lending and an overwhelming availability of "bad" credits can distort capital markets and make it more difficult for PE investors to generate deals.
Stock exchange liquidity can help PE activity thrive as exit windows improve in the sense that IPOs generally provide better exit multiples. The development of stock markets improves exit conditions, increases return expectations, and therefore indirectly stimulates private equity deal
flow.
Ke Sass ac}trs fir PE, Firms Operatin in EmeTIng Market
According to a study conducted by BCG (based on a dataset provided by the IFC), there are several differences between success factors for PE funds investing in developed markets and those investing in developing countries". Several important inferences can be made:
Minority deals are more successful than majority deals. Most of the businesses in
emerging markets are still in the early stage of their development. Owners typically want to keep control of the company that they are still developing. However, clear corporate governance often helps private equity investors to protect themselves from the lack of control.
It is better to invest in businesses focusing in domestic markets rather than those
targeting internationally-oriented companies. While there are good arguments for investments in internationally-oriented companies, the dataset provided by the IFC shows that companies focusing on their domestic market are on average outperformers. Such observation might be explained by the expertise and in-depth knowledge managers tend to have in their domestic market.
It is important to identify industry cycles as some sectors in emerging markets can
significantly outperform others in terms of returns. The IFC dataset shows that investments in telecommunications, healthcare and materials were clear outperformers. While the analysis of potential trends in individual sectors is essential for GPs' investment thesis, sector specialization in emerging markets can be risky since potential uncertainties can be magnified by a lack of diversification.
First-time funds in emerging markets perform well as they match and sometimes exceed
returns achieved by experienced fund managers. The IFC dataset unexpectedly shows that first-time managers delivered very decent results since 46% of the top-quartile performers were first-time funds and first-time fund managers delivered on average approximately the same performance as experienced GPs.
Funds with a local presence are much better performers than international funds without
any local presence. They delivered returns on average five times higher than funds without local offices. In this regards, local presence enables fund managers to strengthen their domestic network and have a better understanding of specific socio-economic conditions.
Top-line growth is the main driver of strong performance among top-quartile funds. The
IFC dataset suggests that superior returns delivered by top-quartile funds are driven by revenue growth rather than leverage.
Bigger funds outperform smaller ones according to the IFC dataset. This observation
suggests that bigger funds allow GPs to build stronger ties with local businesses. However, diseconomies of scale might be triggered if the funds become "too" big relatively to the absorption capacity of local businesses. Moreover, medium-sized investments provided better returns on average than small investments: the mid-cap market in emerging countries seems to have a better risk-return profile than the small-cap market.
3) Rationale for Investing m Tunisia: a Top-Down Perspective
A) Macroeconomic
Fiundamentals
With 10.5 inhabitants and a gross domestic product ("GDP") of $44 billion in 2010, Tunisia is a relatively small country. In this regards, Figure 1.18 compares the "size" of the Tunisian economy to its Middle-Eastern and North African neighbors. The relatively low GDP mirrors the limited capacity to absorb investments, especially when compared with much bigger economies such as Turkey, Saudi Arabia, UAE and Egypt or to a lesser extent Algeria and Morocco. This is notably due to a relatively modest population (which limits the market reach for investors) but also to a lack of natural resources comparatively to countries such as Saudi Arabia, UAE or Algeria.
Figure 1.18:
Benchmarking the "Size" of the Tunisian Economy
USD Billion 800.0 700.0 -600.0 500.0 - 3 400.0 300.0 200.0 100.0 81.1 Million 90.0 80.0 70.0 60.0 50.0 40.0 30.0 20.0 10.0 0.0
I
CO
*2010 GDP (Left, in USD Billion) U 2010 Population (Right, in Million) GDP as per 2009 for Libya
Soure: World Bank
However, when Tunisia is compared to its neighbors in terms of GDP at purchasing power parity per capita (which is often considered as a good proxy of the standard of living), it turns out that is fairly well positioned (Figure 1.19). It should be noted that the high GDP per capita PPP in UAE, Saudi Arabia and Libya is significantly biased by the preeminence of natural resources (essentially oil and gas) in their economies. Moreover, the proactive education policy undertaken in Tunisia since 1966 significantly decreased the illiteracy rate (people ages 10 and above) from 51% in 1966 to 19% in 201014; the Tunisian population is highly educated relatively to the region's standards.
However, the relatively high levels of standard of living and literacy rate should not hide the internal disequilibrium prevalent in Tunisia.
- By the end of 2011, the unemployment rate reached 18.9% at the national level and 30.5% for those with university degrees" (with even higher rates in underdeveloped regions).
- The poverty rate is standing at 25% (share of citizens living with less than 2$ per day)'. - The disparity between the illiteracy rate in rural regions and urban areas is significant
(respectively 310% and 13%) ".
- The economy is dual with a notable regional disequilibrium and a severe fracture between
coastal regions and inland areas.
While the social and economic instability subsequent to the Tunisian revolution has exacerbated this internal disequilibrium, it also revealed that it had been already very severe under the regime of the ex-President Ben Ali.
Figure 1.19:
Benchmarking the Tunisian Standard of Living: GDP per Capita PPP (2010)
547,2U
UAE Saudi Arabia "GDP as per 2009 for Ubya
$15,687
Libya* Turkey
$9,550 A
Tunisia Algeria
$6,180 $5,749 $4,712
Egypt Jordan Morocco
Source: World Bank
The GDP growth of Tunisia fell in the 5-6% range over 2003-2007 and in the 3-4% range over 2008-2010 (Figure 1.20). While the growth profile does not seem as attractive as in some emerging countries displaying GDP growth closer to 10%, the "growth story" remains attractive compared to developed markets and the economy proved to be relatively resilient to the global recession (before the uprising in 2011). Nevertheless, the social and economic instability following the 2011 revolution severely hit the overall economy as the GDP is estimated to have fallen by 2.2% in 2011. Tourism and the phosphate industry, two key sectors in the Tunisian economy, were particularly harmed. Despite the drawbacks and internal instability suffered by the country, the 2012 budget released by the Ministry of Finance remained optimistic about the growth prospects in 2012 (first set at 4.5% then revised at 3.5%).
1s National Institute of Statistics ("INS")
16 Tunisie Valeurs, "Revue de Recherche", February 2012
30 $50,000 $45,000 $40,000 $35,000 $30,000 $25,000 $20,000 $15,000 $10,000 $5,000 $0
-I
I
Fifure 1.20: Tunisian GDP Growth (%) 7.0% 6.0% 5.0% 4.0% 3.0% 2.0% 1.0% 0.0% -1.0% -2.0% -3.0% 2003 2004 2005 2006 2007 2008 2009 2010
Source: World Bank until 2010, Tunisian Central Bank for 2011 estimate, Tunisian Ministry of 2012projection
-2.2%
2011 2012 Estimated Projected
Finance (2012 budget) for
The country's current account deficit was also negatively impacted by the recession (from 1.5% of the GDP in Q1 2011 to 2.3% in Q1 2012) as imports increased faster than exports (respectively 21.6% and 9.1%). The overall deficit of the balance of payments was lower than in
Q1
2011 due to an increase in financial accounts (mainly via foreign direct investments and public indebtedness). As a consequence of account deficits, the Central Bank reserves depleted from 113 days of imports at the end of 2011 to 101 days in Q1 2012", which might be seen as an alarming sign of vulnerability regarding the Tunisian currency (the relatively long term nature of foreign capital mainly composed of foreign direct investments and long-term debt is reassuring tough).As displayed in Figure 1.21, the government budget deficit had been historically low until the revolution hit the country. The deficit went from -1.3% in 2010 to -4.3% in 2011. In the 2012 budget, the government expects it to reach -6.2% in 2012 (above the threshold of -5% usually seen by economists as the "psychological" threshold). This element might appear even more alarming when one notes that government projections of GDP growth (3.5% in 2012) and tax collections are optimistic.
1 Tunisian Central Bank, "Conjoncture 6conomique et financiere nationale: principales 6volutions jusqu'au 16 avril 2012" (National economic and financial situtation: main evolutions until April 16,2012), 2012
Figure 1.21:
Government Budget Deficit (% GDP)
0.0% ,--1.0% -20%---22% -2.5% -2.4% -. %45 -3.0% -- 2.8%9/- ---5.0% -6.0% -7.0% 2003 2004 2005 2006 2007 2008 2009 2010 2011 2012 Estimated Projected
Soure: World Bank until 2010, Tunisian Central Bank for 2011 estimate, Tunisian Ministij of Finance (2012 budget) for
2012projection
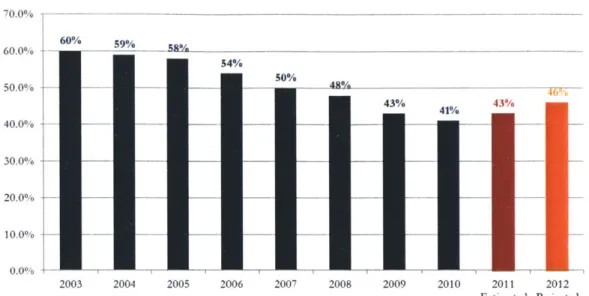
The Tunisian public debt to GDP ratio decreased from 60% in 2003 to 41% in 2010 (Figure 1.22). The trend inverted in 2010 (ratio of 43%) and is expected to follow the same direction in 2012 (the ratio is expected to rise to 46%). Based on the criteria of economic orthodoxy (the European Maastricht Treaty sets the level of acceptable indebtedness to 60% of GDP) and the current world's ratio (estimated at around 70% by the IMF), such levels of indebtedness seems to be sustainable. The low leverage of the country should give the government some room for manoeuvre to finance the nation's deficits and the investments needed to help the economy recover.
Figure 1.22: Public Debt (% GDP) 70.0% - - --- -- -- - - - -- - - - - -60.0% - . 9 -58%--54% 50.0% - -- 5- - -- -43% 4% 43% 40.0%
T
30.0%-20.0% 10.0%-0.00/0 -2003 2004 2005 2006 2007 2008 2009 2010 2011 2012 Estimated ProjectedSource: World Bank until 2010, Tunisian Central Bank for 2011 estimate, Tunisian Ministy of Finance (2012 budget) for 2012projection
B) Investment Env ronment
Revolulionl anid limes/or Coifidenice
An increase in the CDS spread of government bonds (cost of insurance) and a credit
downgrade are often seen by foreign investors as appealing signs of increased investment riskiness. In this regards, S&P and Moody's cut the credit rating of Tunisia by one notch while CDS spreads increased from 120 bps (13"' January 2011) to 275.5 bps (9t' December 2011)'8.
However, indicators on the activity of foreign investors reflect even better the perception of the
country by the investment community. While portfolio investments (in stocks, bonds or other liquid securities) are not "reliable" inflows of capital, foreign direct investments ("FDIs") not only are a stable source of foreign capital for the Central Bank but also contribute to productive investments in the economy. Foreign direct investments represent a substantial source of capital inflows for the Tunisian Central Bank; according to the World Bank's dataset, FDIs represented on average 5.2% of the Tunisian GDP between 2006 and 2010. Moreover, FDIs have by far the largest share in foreign investments (on average 95% versus 5% for portfolio investments between
2006 and 2011).
The economic and social instability following the revolution in January 2011 seems to have spread fear among the foreign investor community. As displayed in Figure 1.232, FDIs dropped by 25.7% in 2011 '. Some key sectors were more particularly hit by the decline in FDISs: -83% drop in tourism, -42% in manufacturing and -19% for energy.
18 Gulf Research Center