Publisher’s version / Version de l'éditeur:
Proceedings of the 18th International Conference on Port and Ocean Engineering under Arctic Conditions, 2, pp. 595-604, 2005
READ THESE TERMS AND CONDITIONS CAREFULLY BEFORE USING THIS WEBSITE.
https://nrc-publications.canada.ca/eng/copyright
Vous avez des questions? Nous pouvons vous aider. Pour communiquer directement avec un auteur, consultez la première page de la revue dans laquelle son article a été publié afin de trouver ses coordonnées. Si vous n’arrivez pas à les repérer, communiquez avec nous à PublicationsArchive-ArchivesPublications@nrc-cnrc.gc.ca.
Questions? Contact the NRC Publications Archive team at
PublicationsArchive-ArchivesPublications@nrc-cnrc.gc.ca. If you wish to email the authors directly, please see the first page of the publication for their contact information.
NRC Publications Archive
Archives des publications du CNRC
This publication could be one of several versions: author’s original, accepted manuscript or the publisher’s version. / La version de cette publication peut être l’une des suivantes : la version prépublication de l’auteur, la version acceptée du manuscrit ou la version de l’éditeur.
Access and use of this website and the material on it are subject to the Terms and Conditions set forth at Analysis and results of 30 years of iceberg management
Rudkin, Pip; Young, Carrie; Barron Jr., Pat; Timco, Garry
https://publications-cnrc.canada.ca/fra/droits
L’accès à ce site Web et l’utilisation de son contenu sont assujettis aux conditions présentées dans le site LISEZ CES CONDITIONS ATTENTIVEMENT AVANT D’UTILISER CE SITE WEB.
NRC Publications Record / Notice d'Archives des publications de CNRC:
https://nrc-publications.canada.ca/eng/view/object/?id=7deaaa28-c001-4bf1-8261-1628c0802627 https://publications-cnrc.canada.ca/fra/voir/objet/?id=7deaaa28-c001-4bf1-8261-1628c0802627
595
Proceedings 18th International Conference on Port and Ocean Engineering under Arctic Conditions, POAC’05
Vol. 2, pp 595-604, Potsdam, NY, USA, 2005.
ANALYSIS AND RESULTS OF 30 YEARS OF ICEBERG MANAGEMENT
Pip Rudkin1 and Carrie Young1 and Pat Barron Jr. 1 and Garry Timco2
1
Provincial Aerospace Limited (PAL), St John’s, NL, Canada
2
Canadian Hydraulics Centre, NRC, Ottawa, ON, Canada ABSTRACT
Iceberg management operations have been conducted off eastern Canada for the past 30 years. Various analyses on the success of those operations had been conducted and the results included in reports that were proprietary documents. A small study (Bishop, 1989) analyzed a few years of data and assessed the success of iceberg towing to be 85% while other anecdotal information suggested the success was more like 95%.
Provincial Aerospace was contracted to assemble all available iceberg management data into a structured database, with the final outcome to be a publicly available database, capable of providing information to assist in defining ice risk.
The PERD Comprehensive Iceberg Management Database contains detailed information on over 1,500 iceberg management operations. These data have helped define bench marks against which future ice management operations can be compared and has directly contributed to a reassessment of the risk of iceberg collision with offshore structures. This paper provides an overview of the database and discusses the results of a subsequent detailed analysis.
BACKGROUND
With an increase in sub-sea equipment associated with floating oil production systems on the Grand Banks, there has been renewed interest in assessing the success of iceberg towing operations. Since the initial iceberg tow tests in 1971, there has been in excess of 1500 iceberg management operations conducted to support oil drilling operations off the east coast of Canada. However, information associated with those
596
operations was spread across numerous reports in several libraries. Most of the information quoted on iceberg tow success is mainly anecdotal and actual quantifiable data on the success of these operations was almost non-existent. Although a few studies into towing success in the early 80’s were conducted (Bishop, 1989), there has never been a complete data source of ice management operations.
Several recent reports, including some PERD funded projects (Wright et. al, 1997, Crocker et. al, 1998), have suggested that the offshore operators should attempt to address the question of effectiveness or successfulness of iceberg management. Both industry and stakeholders have been debating what constitutes success as many different definitions have been used in past reports (Rudkin and Paschke, 2000). In the spring of 2002, the PERD Comprehensive Iceberg Management Database (CIMD) was released and including annual updates, now represents the most complete dataset of iceberg towing operations available today.
DATA
Raw data primarily came from the various “Well History Reports” that the regulator required to be filed on completion of all wells drilled off Eastern Canada. A search of the Regulators library uncovered iceberg towing data in 65 of those well history reports. As a general rule, there were six different data products available from each well history report:
1. Plot Sheets of the Icebergs Track 2. Iceberg Track Listing
3. Iceberg Tow Logs 4. Iceberg/Tow Summaries 5. Chronology of Events Log 6. Environmental Observations
While all of these products were not available for all of the well sites, in general terms there were at minimum some combination or derivatives of these products for most locations. The total data flagged was in excess of 5000 pages of information.
Prior to beginning the database design, a stakeholder’s workshop was held to discuss the available data and what types of questions would the stakeholders like this database to answer. Based on these discussions, the database design was finalized and a process of quality analysis was performed on the data prior to entering it into the database.
GENERAL OBSERVATIONS
These data spanned a period of over thirty years and ranged from hand written reports in the beginning, to fully computerized data collection and reporting in the later reports. This allowed for some interesting observations regarding how the approach to
597
iceberg management operations had changed over time and with the introduction of technology. These observations have proved important when one attempts to analyze various components of an ice management operation.
There was little consistency in the report formats between the different contractors. However, for the most part there was consistency in each contractor’s reports for different operators. In general terms the earlier datasets (1970-1980) contain more detail than the later ones (1980-1990). It is believed that this reflects the change from an operational based R&D approach to a purely operational approach.
The Labrador datasets were generally complete in all respects and contain extremely detailed information on towing operations while the Grand Banks data tended to be a bit more vague and required reprocessing to extract the required data.
Data from the early 1980’s varied in the accuracy of the drift and tow tracks. Although the Labrador data obtained from the drillships radar appeared to be quite accurate, the data from the Grand Banks did not. In many cases the accuracy problems were attributed to the DECCA navigation units used to provide positions. There was a considerable difference in mass calculations that had been used from one contractor’s report to another. As a result (where iceberg measurement or estimates were available) all data was recalculated using the commonly accepted formula of:
[1] Mass=7.12*L*W*H*Va
where 7.12 is a ratio of density of glacial ice to sea water, L in the above water length in meters, W is the above water width in meters, H is the above water height in meters, and Va is a shape factor.
It was interesting to note that the level of supporting information drops off proportionally to the advancing use of computers. Most of the data prior to 1980 was recorded by hand on hard-copy logs and contained much more supporting information in the way of notes and comments. As the level of electronically recorded data increases through the 1980’s, the level of supporting notes and comments decreases. This probably reflects the fact that early computers were good for storing and processing numbers, but they did not lend themselves well to adding text.
On the whole the available data were quite good. Where values required for the database had not been recorded; they could be extracted by reprocessing the available data.
DATABASE CONTENT
The final database was constructed in MS Access and the design contained four linked tables with the main tow table comprising of 46 individual fields. The executable database utilizes a multi-layer query module that allows users to customize what data
598
fields are queried. Query results can be exported to MS Excel for further analysis if required. Table 1 provides an overview of the key fields along with the number of data points within that field.
Table 1: Overview of Database Fields
Item Value
Total number of individual management records 1505
Total number of individual icebergs 973
Types of Management
Total number of tows 1303
Total number of prop-washings 73
Total number of water cannon management 34
Total number of rammings 5
Total number two vessel tows 33
Total number of net tows 45
Total number other management techniques 8
Associated Data Fields
Total number complete iceberg measurements 1332
Total number of connection times 538
Total number of tow headings 1256
Total number of force measurements 683
Total number wind data 1393
Total number wave data 1225
Total number visibility data 939
Total number end reasons 1505
Total number TCPA measurements 1077
ANALYSES
The first multiple well analyses were conducted in the late 1980’s in an attempt to quantify the overall success of iceberg management (Bishop, 1989). This report analyzed 354 iceberg management operations. However, the methodology used to determine the success was based on the assigned values recorded in the Environmental Summaries, the criteria for which was poorly documented (Rudkin, 2002). Nevertheless, this small sampling remained the basis of risk analysis for most offshore oil projects undertaken since 1990.
With the release of the PERD Comprehensive Iceberg Management Database and the subsequent analysis of the 1500 operations, there are now definitive bench marks to which future seasons can be evaluated. In addition, the question of the success of iceberg management can be viewed in a statistical manner.
599
Data from the Labrador or northern operations and the Grand Banks are significantly different. Much of this stems from the different approaches to ice management between those two areas. This occurs primarily from the much larger ice zones associated with anchored rigs on the Grand Banks versus dynamically positioned vessels used in the northern programs.
In most instances these data were analyzed as a whole followed by separating into the two distinct geographic or operational areas. The first set of analysis conducted was a general one that covered the entire database with no separation by area or type of operation and was conducted to benchmark various individual components of an ice management operation. Those data included the following analysis and results:
DEFLECTION ANGLE
The assessment of past deflection angles provides insight into the probability of successfully deflecting an iceberg a certain amount off its natural drift and by association at what distance an ice management operation should start. This is perhaps the single most useful value for field personnel planning any iceberg management operation.
Probability of Tow Deflection Angle Success
0% 10% 20% 30% 40% 50% 60% 70% 80% 90% 100% 0 10 20 30 40 50 60 70 80 90 >90 Deflection Angle P robabi li ty of Ex ceedence 1974 - 2003 Data
Figure 1: Deflection probability exceedence of all methods
The deflection angle was calculated by comparing a projection of the icebergs free drift to the course made good while the iceberg was under management. Figure 1 shows the results. In this case, there were no real surprises and the data confirmed that the more successful operations utilized small amounts of deflection.
600
ELAPSED TIME
The elapsed time required to conduct the iceberg management operation is another key factor to successfully planning an operation. Ice management vessels are usually at a premium and have other duties not related to ice management but critical to the continued operation of the drilling or production facilities. To that end, it is important to be able to assess how long these resources are likely to be tied up with an ice management operation.
The elapsed time values were then grouped into subjective ranges starting at less than 0.5hour and progressing through to greater than 48 hrs. The mean elapsed time was 10.4 hours. However, there were distinct differences between Labrador and Grand Banks operations which showed 6.9 and 14.7 hours respectively.
END REASON
In the design phase of the database, considerable discussion was held on the reasons to end a management operation. While there are no doubt numerous reasons for a tow to end, a review of the data showed that in most cases it could be reduced to one of eleven standardized reasons. The analysis showed the vast majority (61%) of reasons centered on the management ending because it had achieved the required result, the second most common (22%) reason was that the towrope slipped off the iceberg. Iceberg rolling was the third most common reason and occurred in 9% of the records. It is interesting to note that the reason of Other Ice Priorities is present in less than 1% of the records indicating that for the most part, the operational field decisions made over the past 30 years have been sound. Also of note is the occurrence of the towrope failure, which again has only occurred in less than 1% of the operations.
NUMBER OF ATTEMPTS
In many cases, it has proved extremely difficult to define what constitutes a new operation as opposed to another attempt within an existing operation. Two workshops (PAL Environmental Services and C-CORE) have been held over the past few years and while some headway has been achieved, the definition of new operation or additional attempt is still somewhat subjective if it had not been recorded at the time. If the attempt number was not recorded, the time between one attempt ending (through any reason) and the next starting was used. If it exceeded twelve hours then this was considered a new operation.
The maximum number of significant attempts was twelve and only two individual icebergs recorded attempts exceeding five. The mean number of attempts was calculated at 1.4. These data showed little difference between the two operational areas.
601
MANAGEMENT METHOD
There are thirteen different management methods listed in the database. Many were experimental methods that were only used on one or two operations while others are more standard techniques that are still commonly utilized. Of these more common methods, the floating towrope is by far the most common, accounting for 87 percent of all operations. Prop-washing was second but this represents only 5 percent of the operations. Water cannon, nets, and two-vessel tows account for between two and three percent. Five entries for ramming were recorded in some early reports but were dismissed as being too dangerous to continue as a standard method of management.
OVERALL SUCCESS
Past attempts to qualify the success of an ice management operation included assessing the number of times the tow-vessel had to connect to the iceberg, or comparing the difference between the tow-vessels heading and the course made good over the tow. Still others compared the deflection angle between the drift made good of the free-floating iceberg against the course made good while under tow. It was obvious that a standardized and measurable definition of tow success was required. The C-CORE (2002) Workshop defined two definitions of tow success:
o Operational Success
“A tow can be considered successful if downtime was avoided” o Technical Success
“A tow can be considered technically successful if (a) a demonstrated change in course was achieved and (b) the towed iceberg achieved a course made good with one or multiple attempts”
The workshop provided no value for “change in course” and it is difficult to state that a deflection was achieved when the amount of deflection is smaller or equal to the icebergs natural meander. As such, for this analysis, any change in course less than 5o was not considered to meet this criterion. Table 2 presents the results of the analysis based on these two definitions of tow success.
Table 2: Tow Success
Definition Number of Operations Percentage of Total
Operational Success 1,492 99.1%
Technical Success 1,287 85.5%
Using these data as a starting point, the analysis looked at success verses iceberg size, management method, external environmental effects, and vessel experience. These
602
factors had less of an effect than might be expected. The level of success based on iceberg shape varied only 14% between the most and least successful while only 8% separated iceberg size.
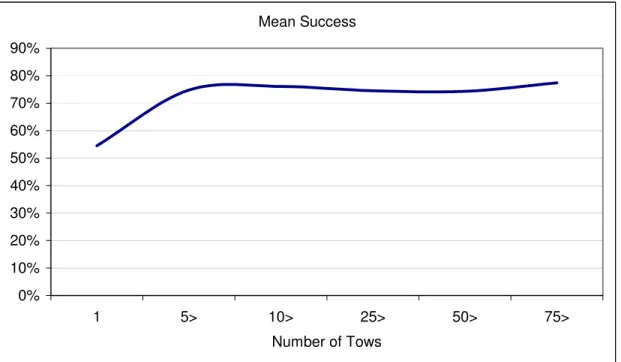
VESSEL EXPERIENCE
This analysis attempted to quantify if vessels that have conducted many towing operations over several ice seasons have better success than those vessels that are used for only one season. The resulting conclusions do not take into account that different crews may have been involved with a single vessel over many seasons.
Mean Success 0% 10% 20% 30% 40% 50% 60% 70% 80% 90% 1 5> 10> 25> 50> 75> Number of Tows
Figure 2: Mean success of vessel experience
The database contains either the vessel name or radio call sign of 82 individual tow vessels responsible for 1,365 ice management operations. Eleven vessels conducted only one tow while six vessels conducted in excess of 50 tows.
Figure 2 shows the results of the analysis. The results show a noticeable increase in towing success from one operation to five or more. From that point onward there is only a gradual, small increase in the level of success.
In terms of seasons of experience, 65 vessels were used for only one season while at the other end of the scale, two vessels have greater than 6 seasons experience.
603
When looking at the number of seasons experience the results show a gradual increase in the level of success that range from just above 70 percent for the first season to just under 90 percent for the two vessels that have more than six seasons experience.
TOWING WORKSHOP
The results of the management analysis were presented at a workshop for vessel masters and ice management personnel to solicit feedback and discussion on the results from the data analysis. In cases where there were sufficient data points to get a meaningful result (e.g. Figure 1), the attendees generally agreed with the results, based on their experiences. However, where the data points were limited, some conclusions did not fit with the field experience of those in attendance.
Some interesting conclusions contrary of the accepted outcome are related to:
Vessel Power
The analysis on the distribution of tow force and its affect on a successful tow outcome were also discussed in some detail at the Workshop. The vessel masters interpretation of these data was as follows:
• The success of a tow is established right at the beginning of the tow when the applied bollard pull on the towrope is in the 10 – 25 tonne range. If the berg remains stable with the rope attached, then the chance of success is greatly improved.
• There is a usable limit of around 75 tonnes bollard pull after which many icebergs become unstable and roll.
This was an interesting observation that was not immediately obvious from the analysis but became clear from the workshop discussion with the experienced Vessel Masters.
Vessel Experience
Probably one of the more interesting analyses is those related to vessel experience. As shown in Figure 2, there is a steep learning curve from one-to-five operations where the success rate jumps almost 20%. With more tows, there is a steady but very slow improvement in the success rate. Those results were discussed in detail with the vessel masters attending the workshop. The consensus was that these results were correct in as much as a new master has to get a feel for the best way to deploy the towrope for the given conditions and also how icebergs react as tow force is applied.
Interestingly, an examination of vessels with multiple seasons experience indicates that there is again a very slow increase in the level of successful operations. Based on the available data, the difference between a new vessel on its first tow and a well seasoned one is about 30 percent. This observation was contested by the experienced vessel masters who believed that once the initial learning curve had been established, there was no reason why the success would improve over multiple seasons.
604
DATABASE AVAILABILITY
This paper has summarized a very comprehensive analysis of iceberg management on the Grand Banks. A copy of the complete analysis (Rudkin et al., 2005) and the current ice management database can be obtained from the website of the Canadian Hydraulics Centre (www.chc.nrc.ca). It can found under Cold Regions Technology, PERD/CCTII.
ACKNOWLEDGEMENTS
The authors would like to acknowledge the financial support of the Canadian Program of Energy Research and Development (PERD) through the ice-structure interaction activity in the Offshore Environmental Factors POL.
REFERENCES
Bishop G., (1989). Assessment of Iceberg Management for the Grand Banks Area: Analysis of Detection and Deflection Techniques, Mobil Oil Properties Property Development Department.
C-CORE, (2002). Integrated Ice Management R&D Initiative-Year 2001. C-CORE Report R-01-24-605 to Chevron, ExxonMobil, Husky, Norsk Hydro, PERD and Petro-Canada.
Crocker G., B. Wright, S. Thistle, and S. Bruneau, (1998). An assessment of Current Ice Management Capabilities. Prepared by C-Core and B. Wright and Associates Ltd. PERD/CHC Report 20-33, St. John’s, Canada.
Rudkin, P., and P. Paschke, (2000). Report on the 2000 Ice Season on the Grand Banks of Newfoundland. Report for the Grand Banks Joint Operators. Prepared by PAL Environmental Services. CNOPB Library. St. John’s, Canada.
Rudkin, P., (2002). Comprehensive Iceberg Management Database Phase-1 Report. PERD/CHC Report 20-69, St. John’s, Canada.
Rudkin, P., C. Boldrick and P. Barron Jr., (2005). Comprehensive Iceberg
Management Database Report 2005. PERD/CHC Report 20-72, St. John’s, Canada. Wright B., K. Croasdale, and M. Fuglem, (1997). Ice Problems Related to Grand Banks Petroleum Fields. PERD/CHC Report 20-6, Calgary, Canada.