Integrated chemo- and biostratigraphic calibration of early animal
evolution: Neoproterozoic-early Cambrian of southwest Mongolia
M. D. BRASIER*, G. SHIELDS!, V. N. KULESHOV* & E. A. ZHEGALLO§
* Department of Earth Sciences, Oxford University, Parks Road, Oxford 0X1 3PR, UK t Geologisches Institut, Sonneggstrasse 5, ETH-Zentrum, CH-8092, Switzerland
% Geochemical Institute, Russian Academy of Sciences, Moscow, Russia
§ Palaeontological Institute, Russian Academy of Sciences, Moscow, Russia
{Accepted 18 March 1996)
Abstract - Five overlapping sections from the thick Neoproterozoic to early Cambrian sediments of western Mongolia were analysed to yield a remarkable carbon-isotope, strontium-isotope and small shelly fossil (SSF) record. Chemostratigraphy suggests that barren limestones of sequences 3 and 4, which lie above the two Maikhan Uul diamictites, are post-Sturtian but pre-Varangerian in age. Limestones and dolomites of sequence 5, with Boxonia grumulosa, have geochemical signatures consistent with a post-Varangerian (Ediacarian) age. A major negative 813C anomaly (feature 'W') in sequence 6 lies a short distance above an Anabarites trisulcatus Zone SSF asemblage with hexactinellid sponges, of probable late Ediacarian age. Anomaly ' W provides an anchor point for cross-correlation charts of carbon isotopes and small shelly fossils. Trace fossil assemblages with a distinctly Cambrian character first appear in sequence 8
(Purella Zone), at the level of carbon isotopic feature 'B', provisionally correlated with the upper part of
cycle Z in Siberia. A paradox is found from sequence 10 to 12 in Mongolia: Tommotian-type SSFs continue to appear, accompanied by Nemakit-Daldynian/Tommotian-type 87Sr/86Sr ratios but by increasingly heavy 5'3C values that cannot be matched in the Tommotian of eastern Siberia. The steady rate of generic diversifi-cation in Mongolia also contrasts markedly with the Tommotian 'diversity explosion' in eastern Siberia, which occurs just above a major karstic emergence surface. One explanation is that sequences 10 to 12 in Mongolia preserve a pre-Tommotian portion of the fossil record that was missing or removed in eastern Siberia. The Mongolian sections certainly deserve an important place in tracing the true course and timing of the 'Cambrian radiation'.
1. Introduction
Over the last decade, increasing interest in events across the Precambrian-Cambrian boundary has highlighted the need for a high-resolution chronostratigraphic frame-work. At present, this framework is often taken from sections on the Siberian platform, despite the selection of the Precambrian-Cambrian boundary stratotype in south-eastern Newfoundland (Landing, 1994; Brasier, Cowie & Taylor, 1994). These Siberian sections have the advan-tage of being relatively flat-lying and undeformed, with richly fossiliferous carbonates amenable to carbon and strontium isotope stratigraphy. Recent work has certainly illustrated the potential of the Siberian carbon isotopic record as a standard for global correlation of lower Cambrian stages (e.g. Magaritz, Holser & Kirschvink, 1986; Magaritz, 1989; Magaritz et al. 1991; Kirschvink
et al. 1991; Pokrovsky & Missarzhevsky, 1993; Bowring et al. 1993; Brasier, Khomentovsky & Corfield, 1993;
Brasier et al. 1994a; Brasier et al. \99Ab\ Ripperdan, 1994; Knoll et al. 1995a; Pelechaty, Kaufman & Grotzinger, in press). Latterly, it has also been shown that the Siberian Platform carries an important 87Sr/86Sr record (Derry et al. 1994; Nicholas, 1996; Kaufman et al.
1996).
Evidence is emerging, however, for a substantial break
in the stratigraphic record of the Siberian Platform, at the base of the Tommotian Stage (Knoll et al. 1995b). An erosional, karstic surface can be traced in dolostones beneath this level across much of Siberia (Khomentovsky & Karlova, 1993). This karstic surface is followed by an abrupt change in lithology that variously includes richly fossiliferous basal Tommotian (Khomentovsky & Karlova, 1993; Rozanov, 1992) or middle Tommotian (Vidal, Moczydlowska & Rudavskaya, 1995), and even volcaniclastic conglomerates (Bowring et al. 1993). Carbon isotopic values show a very abrupt negative shift across this disconformity in eastern Siberia (Brasier, Khomentovsky & Corfield, 1993) though deposition may have continued in northern Siberia, to lay down carbon-ates with very positive values (Knoll et al. 1995b). Further evidence for this gap in eastern Siberia includes a rapid shift in 87Sr/86Sr towards less radiogenic values across the Nemakit-Daldynian/Tommotian boundary (Derry etal. 1994; Nicholas, 1996).
The carbonate-dominated successions of the Zavkhan basin in western Mongolia hold potential for testing, correlating and complementing this Siberian Neo-proterozoic and Cambrian record. This region is suggested to have lain adjacent to the Siberian Platform in the terminal Neoproterozoic to Cambrian (§engb"r, Natal'in & Burtman, 1993), and the sedimentary and
There are some important distinctions, however. (1) Mongolian strata previously assigned to the Nemakit-Daldynian to Tommotian are some ten times thicker than those seen in the eastern or northern Siberian Platform. (2) The Mongolian rocks can also be traced downwards, through a continuous succession of carbonates, to the top of a Neoproterozoic diamictite (Maikhan Uul Member: Lindsay et al. 1996b, this issue). (3) Archaeocyathan sponges first appear in the early Tommotian of Siberia but are unknown until putative late Atdabanian in southwest Mongolia (Voronin et al. 1982; Astashkin ef al. 1995). (4) Biomineralized trilobites radiated in the early Atdabanian of Siberia but are as yet unreported from the lower Cambrian of southwest Mongolia (Astashkin etal. 1995). Russian palaeontologists have provided a wealth of fossil data that allow correlation between successions in western Mongolia and Siberia (e.g. Amantov, 1963; Bezzubetsev, 1963; Markova, Korobov & Zhuravleva, 1972; Markova, 1975; Korobov & Missarzhevsky, 1977; Missarzhevsky, 1977; Korobov, 1980). A pilot study of the Salaany Gol section suggested correlations with the base of the Tommotian, Atdabanian and Botomian stages in Siberia (Voronin et al. 1982). Subsequent work on other sections (e.g. Voronova et al. 1986; Endonzhamts & Lkhasuren, 1988; Gibsher & Khomentovsky, 1990; Gibsher et al. 1991; Dorjnamjaa & Bat-Ireedui, 1991; Dorjnamjaa et al. 1993; Esakova & Zhegallo, 1996; Ushatinskaya, 1995) has allowed further characteriza-tion, including recognition of the earlier, Nemakit-Daldynian Stage of Siberia (Dorjnamjaa & Bat-Ireedui, 1991, p. 124; see also Khomentovksy & Gibsher, 1996, this issue). In this paper, we add further data to the fossil record and consider objective methods for correlations into Siberia and beyond.
It has recently been suggested that the base of the Nemakit-Daldynian stage may approximate to the base of the Cambrian System in the Newfoundland stratotype
(e.g. Brasier, 1992; Bowring etal. 1993). The position of
the Precambrian-Cambrian boundary in Mongolia and elsewhere is, however, still open to debate for two main reasons: the stratotype in Newfoundland is unsuitable for carbon or strontium isotopic correlation (Brasier, Anderson & Corfield, 1992); and the Phycodes pedum ichnofossil assemblage which defines it cannot be corre-lated with precision (Goldring & Jensen, 1996, this issue; Lindsay et al. 1996a, this issue). We have, provisionally, taken the base of the Cambrian System at the first appear-ance of Cambrian-type ichnofossil assemblages in sequence 8, but we acknowledge that it may lie lower.
2. Field work
The well-exposed gorge and mountain sections of the Zavkhan basin were sampled on two separate excursions: during the 21st Joint Soviet-Mongolian Palaeontological Expedition (Zhegallo & Zhuravlev, 1991) and again
V / -DZABKHAN | /
/ ' • ^ - T1 /
/ / Altay" / MONGOLIA „/
CHINA
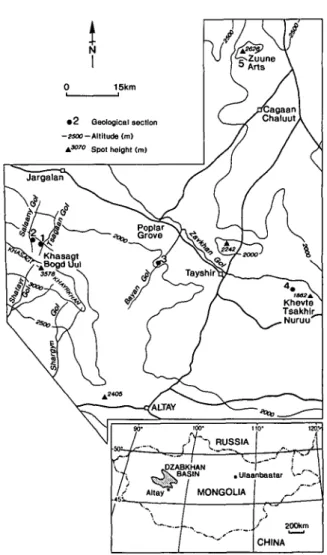
Figure 1. Map showing the location of sampled sections 1 to 5, in relation to major physiographic features and human settle-ments. (1) Tsagaan Gol gorge, which lies close to (2) Salaany Gol ridge; (3) Bayan Gol gorge, which lies c. 35 km east; (4) Khevte-Tsakhir-Nuruu ridge, which lies c. 30 km east-southeast of Tayshir; (5) Zuune Arts ridge, which lies c. 70 km north of Tayshir and 65 km southwest of Uliastay.
during the Joint IGCP Project 303-Mongolian Academy of Sciences expedition (Dorjnamjaa et al. 1993). Five previously documented sections were selected for research (see Fig. 1). Correlation in the field was achieved using the lithological markers outlined by Gibsher et al. (1991, fig. 3), the maps of Khomentovsky & Gibsher (1996, this issue) and the sequence boundaries of Lindsay etal. (1996a, this issue).
3. Samples and methods 3.a. Carbon isotopes
In this study we report on some 319 carbon isotope analy-ses from the Oxford laboratory and a further 123 from Moscow. The Moscow laboratory used a stepwise decomposition of carbonates in orthophosphoric acid to separate the extraction of CO2 from calcite and dolomite.
Each sample was ground to powder, and then plunged into the acid and decomposed for one hour at 25 °C. The
liberated C02 gas was then collected and removed for
isotopic analysis. This portion of gas was assumed to cor-respond, broadly, to the product of calcite decomposition (Walters, Claypool & Phillip, 1972). The decomposition temperature was then heightened to 100 °C and the sam-ple was kept in for a further one hour to comsam-plete the decomposition process. The second portion of the gas was assumed to correspond, broadly, to the product of decomposition of less soluble materials, in this case, of dolomite (e.g. Rosenbaum & Sheppard, 1986). Mass-spectrometry measurements were performed using a domestically manufactured MI-120IB mass spectrome-ter. Reproducibility of replicant measurements was no lower than 0.25 %. Relative amounts of calcite and dolomite were then determined by the volume of the rejected gas. Measurements were made against the PDB standard for 813C and SMOW scale for 818O, calibrated against an in house standard. Conversion of the oxygen isotopic results, from SMOW to the PDB scale, was therefore necessary for comparison with results from the Oxford laboratories and earlier results, using the follow-ing formula derived from Friedman & O'Neill (1977):
81 8OPDB= 818OSMOW-30.86
1.03086
Samples returned to Oxford were largely studied as stained thin sections to determine composition. Well-preserved rock chips were submitted to the Age Laboratory for preparation by Julie Cartlidge. Fine-grained micrite or microspar was selectively drilled from the most homoge-neous regions (to avoid mixed components, veins and vugs) to form a powder, which was then cleaned using H2O2 and (CH3)2CO and dried for 30 minutes at 60 °C.
The samples were then reacted with purified orthophos-phoric acid at 90 °C, using a VG Isogas PRISM mass spectrometer, attached to an on-line VG Isocarb prepara-tion system. This method is rapid and easy to use, but no discrimination is possible between calcite and dolomite components in a mixed sample. Reproducibility of repli-cant standards was better than 0.1 %. Calibration to the PDB standard via NBS 19 and Cambridge Carrara Marble was performed daily using the Oxford in-house (NOCZ) Marble Standard.
3.b. Strontium isotopes
Over two hundred samples were collected by GS in 1993 in parallel with collection for carbon isotope analysis by MDB. Stained thin-sections were made for all samples
and studied petrographically. Some 100 samples were
then chosen for preparation and analysis. With a few exceptions, dolostones, impure limestones (that is, < 85 % acetic acid soluble) and samples with oxygen iso-topic values more negative than -10%o PDB were consid-ered unsuitable for analysis and avoided. The exceptions included stratigraphic intervals where more suitable car-bonates were not available. Here, a few dolostones were examined by dissolution in < 5 % HC1. Trace element
concentrations of Sr, Rb, Mn, Fe and Mg in carbonates were measured using a Perkin Elmer atomic absorption spectrometer on weak acetic acid soluble fractions. The same acetic acid leachates were also used for the Sr iso-tope work. Samples whose Sr contents were unusually low for any particular stratigraphic level were not rou-tinely analysed for their strontium isotope composition because low Sr content was considered to give the best indication of excessive diagenetic exchange of strontium. Such a selection procedure helped to ensure that only those samples most likely to have retained a sea-water Sr isotopic signature were measured at each stratigraphic level.
Reproducibility for Mn and Fe ppm was good (< 5 %) whereas that for Sr was irregular (< 10%). All "Sr/^Sr ratios were corrected for the decay of 87Rb based on the decay constant of Rb (1.42 x 10"": Steiger & Jaeger, 1977). This had only a minor influence on the final ratio, due to the low concentrations of Rb and the relatively high concentrations of Sr in the carbonates. Only one sample, Bay SI a, was significantly affected by this cor-rection. Results were largely obtained in two laboratories (Institute of Geology, ETH Zurich and CGS, Strasbourg, CNRS), although a small number of reconnaisance sam-ples were also run for us by Martin Whitehouse in the Department of Earth Sciences, Oxford. No significant difference could be detected between these laboratories with respect to standard values or double measurements of the same sample. Sr isotopes were measured on a Finnegan MAT 261 multicollector at the ETH Zurich, (long-term mean NBS 987: 0.710245±7; n = 13, 2 s.e.) and at the CGS, Strasbourg on a VG Sector multicollector, (long-term mean NBS 987: 0.710254 ±4, n = 73, 2 s.e., and short-term mean over the period of measurement: 0.710249 ±6; n = 4, 2 s.d.). At Oxford, a few samples were measured on a VG 54E single collector; NBS 987 gave 0.710257 ±6, n = 10, 2 s.e., with comparable errors and reproducibility to those above. All our values are close to 0.710242 and 0.710246 obtained from NBS-987 by Nicholas (1996) and slightly higher than 0.710171 obtained by Derry et al. (1994). Data mentioned in the text have been normalized to the relatively common NBS 987 standard value of 0.71025 and are cited to the fourth decimal place only.
Isotopic results and other geochemical or petrographic data are made available in tabular form in the Appendix: Table 1 shows data for strontium isotopes, Tables 2 to 7 data for carbon and oxygen isotopes.
4. Component and diagenetic signals 4.a. Carbon isotopes
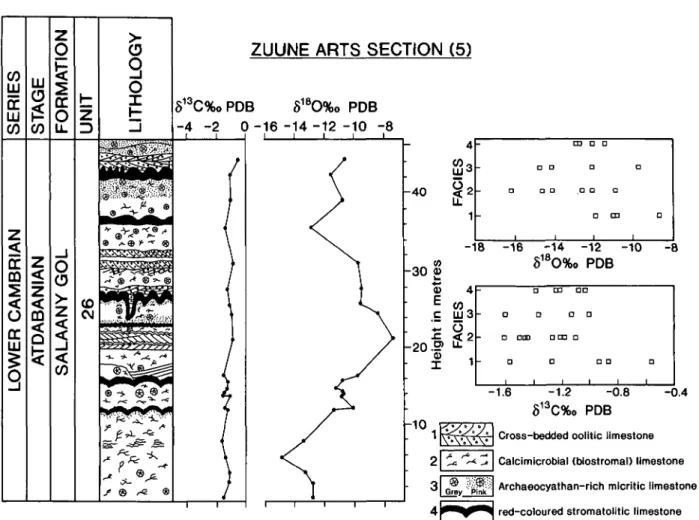
Variability in 8I3C may be due not only to temporal changes in sea-water chemistry but also to changes in car-bonate components and lithofacies through time (see, e.g. Grant, 1992). To test this, we sampled the Zuune Arts section, where rhythmic alternations occur between four limestone biofacies (Fig. 2; see Wood, Zhuravlev &
oolitic limestones.
A separate concern involves the admixture of dolomite and calcite components in many carbonates from the Tsagaan Oloom Formation. Dolomite may be enriched by as much as 2 %o at 25 °C relative to calcite in empirical experiments (Sheppard & Schwarcz, 1970), but in prac-tice the differences are generally much smaller than this (see Kaufman & Knoll, 1995). As mentioned above, some attempts were made by the Moscow laboratory to separate these components. The data do not suggest, how-ever, that carbonate mineralogy has a major influence upon the 513C record.
A related concern is that temporal variation in 513C may be masked by carbonate heterogeneity, brought about by mixing between 'primary' signals from the sedi-ment matrix and diagenetic signals from vugs, veins and cement. To test for heterogeneity, we drilled pairs of sub-samples from the matrix, each some 10 mm or more apart, on specimens from the Tsagaan Gol, Salaany Gol and Bayan Gol sections (see, e.g. Fig. 3). A good
correla-the latter (Fig. 3b). Such results suggest that carbon iso-topic variation within each sample of matrix is, for the most part, relatively minor.
Previous studies have shown that oxygen isotopes are relatively prone to isotopic exchange with meteoric and burial waters during diagenesis, since these contain more of the lighter isotope I6O and are likely to have a higher temperature (see, e.g. Hudson, 1977). Carbon isotopes are less vulnerable, but exchange may also take place, with isotopically lighter I2C liberated by the decay of organic matter in meteoric waters or within the sediment (see, e.g. Irwin, Curtis & Coleman, 1977). This problem has proven greatest in nodular-concretionary limestones, argillaceous limestones, and thin limestone beds within clastic strata (e.g. the 'temperate' carbonates of south-eastern Newfoundland: Brasier, Anderson & Corfield, 1992). None of the sampled Mongolian carbonates are of this type. Carbonates associated with phosphorites may also show 13C depletion (see, e.g. Brasier et al. 1990). While such horizons do occur at intervals through the
CO
9
o
XZUUNE ARTS SECTION (5)
813C%oPDB S18O%o PDB - 4 - 2 0 -16 - 1 4 - 1 2 - 1 0 - 8 - 4 0 -10 -30 S « 4 E « , c UJ 3 Z O •C < 2 -20 .2*
"-5 1
CD D D • D D a a .no o 0 CD I I -18 -16 -14 -12 -10 818O%o PDB - 8 D CD DO a • a a D DDD D CD D D 0 D D I I I | -1.6 -1.2 -0.8 -0.4 81JC%o PDB Grey 'PinkCross-bedded oolitic limestone Calcimicrobial (biostromal) limestone Archaeocyathan-rich mlcritic limestone red-coloured stromatolitic limestone
Figure 2. Carbon- and oxygen-isotope stratigraphy of the lower Salaany Gol Formation at Zuune Arts ridge. At right are shown plots of carbon- and oxygen-isotopic ratios in relation to facies divisions 1 to 4, which correspond to shallowing upward cycles from subtidal oolite banks to peritidal stromatolites (see Wood, Zhuravlev & Chimed Tseren, 1993, for detailed account). There is no clear relation-ship between lithofacies and 5I3C values; 18O tends to be depleted in some limestones beneath shallow to emergent horizons. Unit num-bers from Zhegallo & Zhuravlev (1991). Key as for Figure 5.
lower Cambrian in Mongolia, only one yielded a highly discordant negative result and this has been excluded from the 8'3C summary curve.
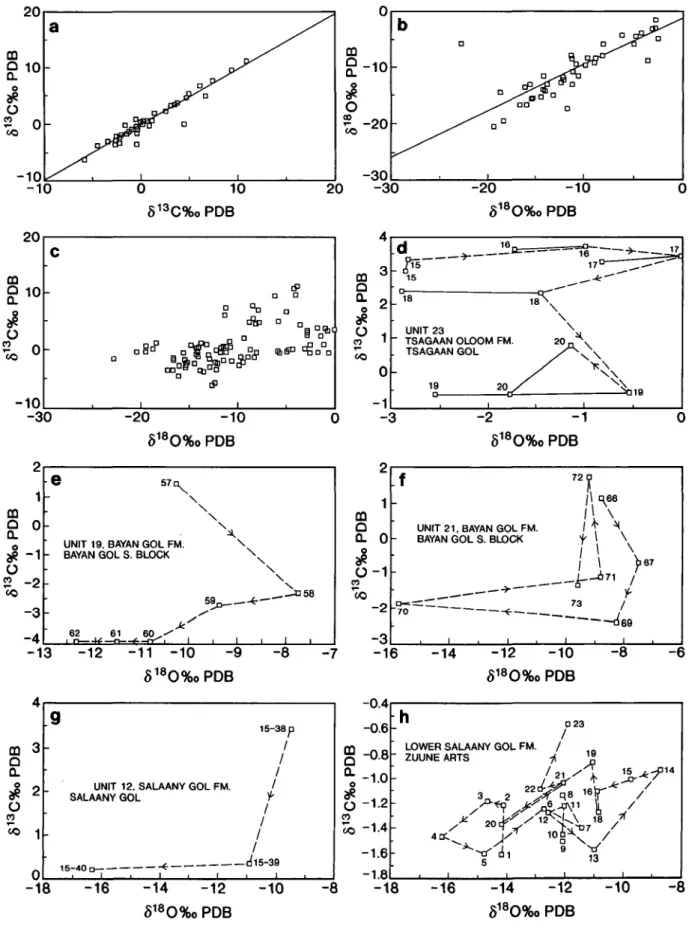
Diagenetic modification of the 813C signal may be indicated by plotting the covariance between 813C and 5I8O values in a given section (see, e.g. Brasier, Khomentovsky & Corfield, 1993). Figure 3c provides such a plot for the Tsagaan Gol data set. Such a wide scat-ter does not indicate a systematic modification of the whole section by diagenesis. Figure 3d-h represents finer scale studies on adjacent samples, intended to explore the influence of diagenesis during emergence at sequence boundaries. Some covariant shifts are apparent on a minor scale, and these are noted below. Allen & Matthews (1982) have shown that not only 13C depletion but also I8O enrichment takes place beneath karstic sur-faces. In the Mongolian samples, there is a tendency for 818O to increase through a sequence towards its upper boundary and then suffer depletion just below and above the boundary. This can best be explained, however, by a greater influence of burial diagenesis on the more-clastic and therefore more-porous sediments in the lower parts of each sequence. With some exceptions discussed below, the carbon signals do not appear to have been reset by sequence-related diagenesis.
Although examples with strongly negative 818O values appear to be numerous in Mongolia, the 818O and 813C fluctuations are seldom correlated through time (e.g. Figs 5, 7-10). This is so, even in samples which yield extremely negative 818O values (>-15%o). Even so, we regard the following kinds of sample as likely to yield 'suspect', diagenetically modified 813C values: those with 8I8O values below -15 %o, with 813C values below -6%o, or showing conspicuous ferroan carbonate phases in the matrix (Brasier, Anderson & Corfield, 1992; Brasier etal. 19946). Such 'suspect' samples are separately noted in Figures 11 to 13 and Tables 2 to 7. Inspection of the data shows that such 'suspect' values have little impact on the overall stratigraphic trends and that the 813C values dis-cussed below are likely to reflect, for the most part, initial variations in the 813C of Neoproterozoic to Cambrian sea-water.
4.b. Strontium isotopes
No single geochemical or textural indicator has proved to be an infallible test for the degree of preservation of
primary Sr isotopic signatures in ancient carbonates. In
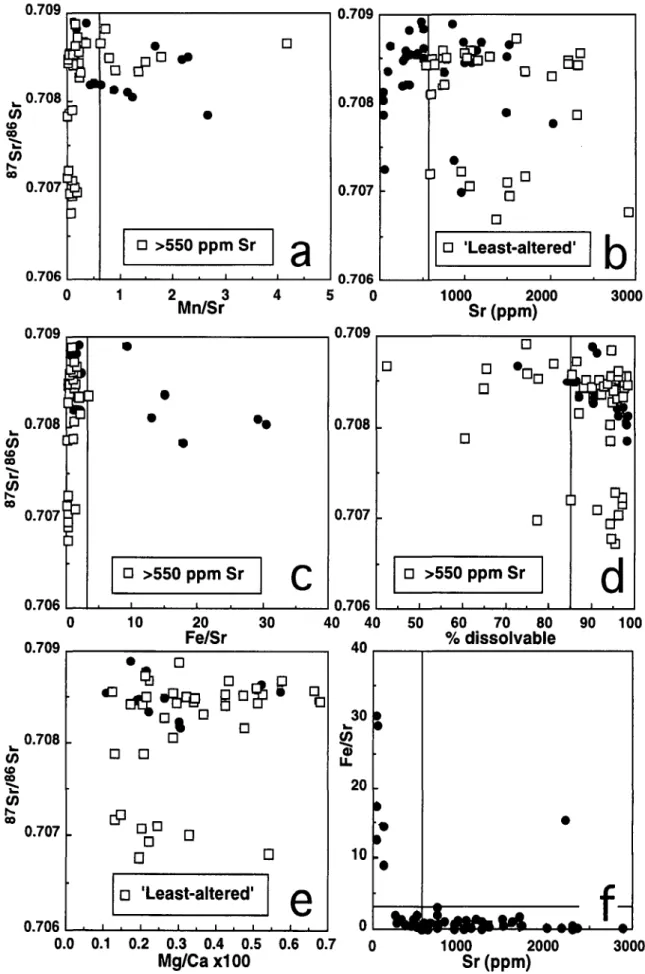
addition to petrographic and stable isotopic screening, the relative abundances of Mn, Fe and Sr have been used as indicators of post-depositional alteration (see, e.g. Brand & Veizer, 1980; Deny, Kaufman & Jacobsen, 1992; Deny et al. 1994; Nicholas, 1996). Such studies have taken the greatest confidence in 87Sr/86Sr values obtained from samples that are not dolomitized (that is, with low Mg/Ca ratios), that have < 0.6 Mn/Sr, < 3.0 Fe/Sr and that yield the lowest ratio for a given interval. In this study, we follow these guidelines with the caution that the Mn/Sr
and Mg/Ca concentrations do not appear to be consistent indicators of post-depositional alteration (e.g. Fig. 4a, e).
In order that only calcite and not dolomite (where pre-sent) was measured, weak < 5 % acetic acid was used to dissolve the calcite and the reaction was carried out very rapidly. It was regarded as unnecessary that all the calcite present should dissolve. This 'rapid reaction' technique was intended to avoid excess leaching of dolomite or clay minerals. Previous studies have shown that dolomite may be dissolved by acetic acid and that this dolomite can have a significant effect on the strontium isotopic compo-sition of the soluble fraction (Deny et al. 1994). A further check on this was made by analysing the concentration of Mg in the soluble fraction. In general, Mg concentrations were below 4000 ppm and hence well within the region of normal content for calcite; there was no correlation of "Sr/^Sr ratios with Mg (see, e.g. Fig. 4e).
Strontium may also be incorporated into calcite from surrounding clay minerals during diagenesis. To have some control over this possible effect and the general problem of leaching from non-carbonate detrital miner-als, it is important to determine the amount of insoluble residue in the sample. Figure 4d shows a plot of the per-centage of sample dissolvable in acetic acid against the Sr isotopic composition. A few samples showing low per-centages of soluble components also display high
87
Sr/86Sr ratios. No sample measured contained more than 2 ppm Rb in the soluble fraction. This helps us to exclude the possibility that there was any significant leaching of Rb or Sr from clay minerals or other detritus. In a few cases to be mentioned later, selected components were drilled and measured to assess sample homogeneity. This did not produce any significant differences in isotopic signal (see Section 5.b.2). Although samples with over 70% insoluble residue have been regarded as yielding acceptable strontium isotope ratios (e.g. Nicholas, 1996), we have set the rejection level at a more cautious 15 % (Fig. 4d, Table 1).
Interpretation of 'least-altered' samples in the follow-ing account must be somewhat arbitrary. Many of the Mongolian samples show remarkably high Srppm concentrations when compared with coeval carbonates studied elsewhere (Fig. 4b; cf. Deny et al. 1994; Nicholas, 1996). We find that those samples with >550 Srppm tend to plot entirely within the 'least-altered' field for Fe/Sr (Fig. 4c, f). Even so, samples with low Fe/Sr and high Srppm may plot outside the 'least-altered' fields for Mn/Sr (Fig. 4a) and for percentage of dissolvable components (Fig. 4d). Perhaps the best indication of a reasonably well-preserved Sr isotope signature at any one stratigraphic level, therefore, is the clustering of samples with high strontium concentrations (> 550 ppm) and low Fe/Sr ratios (<3.0) around relatively low 87Sr/86Sr ratios. Of the 74 samples analysed here, thirty are regarded as satisfying all the rejection criteria discussed above and shown in Figure 4 and Table 1. The others, including those without adequate trace element data, are regarded as yielding 'suspect' values.
0 10 813C%oPDB -30 20 -30 -20 -10 518O%o PDB 20 -20 -10 8180%o PDB -1 -3 d i!a ?15 15 18 UNIT 23 " TSAGAAN OLOOM FM. . TSAGAAN GOL 19 20 ./ 16 17 1 8 " \ \ / I 1 — • — - ^ 17 U ^^ ""' \
2^19
-2 - 1 818O%o PDBm
Q 0. g|o
CO CO 1 0 - 1 - 2 - 3 - 4 e 5 7 ^ \ \ \UNIT 19. BAYAN GOL FM. - BAYAN GOL S. BLOCK
„ 62 61 6 0 . ^ I. \ \ N \ __. J3 58 I i I i CO
a
o
o-0-1 CO
-13 -12
-11 -10 -9 818O%oPDB - 8 -7 -3 -16f
-"70
UNIT 2 1 . BAYAN GOL FM. BAYAN GOL S. BLOCK
' """"" e i I • I > I k *
J\\
_ _ ^ _ _ O 7 1 73 i i I \ \ ^167 /f
69 i , « "70 - 1 4 -12 -10 518O%o PDB - 8 - 6 CQ 3 Q 0. O m9
UNIT 12. SALAANY GOL FM. SALAANY GOL 15-40c / (_ ^15-39
g
-0.4 -0.6 -0.8 -18 -16 -14 -12 -10 a? O-1-2 CO «5 -1.4 -1.6 -1.8-8
-18 -16
LOWER SALAANY GOL FM. / ZUUNE ARTS • 23 q8
3
V " d 19 16 13 15 518O%o PDB -14 -12 -10 818O%o PDB -8Figure 3. Studies of carbon and oxygen isotopic variation in the Mongolian sections, as described in the text, (a-c), studies of intrasample variability within the Tsagaan Gol-Salaany Gol succession, (a) 813C variation in 48 pairs of samples drilled from carbonates in the Tsagaan Gol-Salaany Gol sections; this shows a strong correlation between sample pairs (r2=0.921). (b) 8I8O sample pairs from the same sections; this also shows a good correlation between pairs (r^OJOl). (c) carbon-oxygen isotopic covariance between samples; this shows no clear correlation between carbon- and oxygen-isotopic values (r2=0.241). (d-h) studies of C - 0 covariance between adjacent samples at levels associated with suspected emergence. Sample numbers and arrows indicate younging direction in each section, (d) from the upper 24 m of the Boxonia unit (unit 23) at Tsagaan Gol; sample pairs show great variability of 8I8O, with no clear C - 0 trend between sample sets (^=0.001). (e) from the upper 20 m of unit 19, Bayan Gol southern block; samples 60 and 61 are from
5. Integrated stratigraphy 5.a. Tsagaan Gol gorge
5.a. 1. Lithostratigraphy and biostratigraphy
This gorge section lies about 6 km north of Khasagt Bogd Uul mountain and 4 km east-northeast of the Salaany Gol ridge. It exposes a largely unbroken succession from volcanic rocks of the Dzabkhan Formation to carbonates of the lower Bayaan Gol Formation (Fig. 5). An outline of the geology and stratigraphy can be found in Voronin
et al. (1982), Gibsher & Khomentovsky (1990) and
Khomentovsky & Gibsher (1996, this issue).
The Dzabkhan Formation comprises up to 2500 m of riftogenic calcalkaline volcanic rocks, which elsewhere are known to lie unconformably upon Archaean-Lower Proterozoic crystalline basement (Dorjnamjaa & Bat-Ireedui, 1991). A Riphean age for these volcanic rocks has been inferred from correlation with the Dunzhugur and Darkhat-Sarkhoy island-arc suites of northern Mongolia and eastern Sayan (Rb-Sr isochrons of 752 Ma: Ilyin, 1982; and 718±30Ma: Buyakayte & Kuz'michev, 1989). Riphean Rb-Sr ages have also been obtained from putative fore-arc and arc-related ophiolite complexes in adjacent domains, as for example at Khantayshir (740±10Ma: Lesnov, 1993) and in the Darib region (695 ±15 Ma: Baikova & Amelin, 1994). Younger, Vendian, ages have been obtained from Sm-Nd studies of ophiolite suites at Khan Dharbi (Coleman, 1990) and Bayan Khongor (569 Ma Sm-Nd isochron: Kepezhinskas, Kepezhinskas & Pukhtel, 1991). Poorly substantiated radiometric ages of 777, 732 and 725 Ma have been cited for the Dzabkhan volcanic rocks (Dorjnamjaa & Bat-Ireedui, 1991). Although a middle Riphean age is also inferred by the Dorjnamjaa & Bat-Ireedui (1991) from intercalated oncolite assemblages, their value for dating is questionable (see Khomentovsky & Gibsher, 1996, this issue).
Only the upper part of the Dzabkhan Formation is seen in this section, which comprises about 180 m of acidic to intermediate volcanic rocks, with intercalations of sandstone and conglomerate. These are overlain by the Tsagaan Oloom Formation, which has the Maikhan Uul Member (295 m thick) at its base. The latter comprises lower and upper diamictites with intervening shales, of probable Sturtian or Varangerian age (Lindsay et al.
1996b, this issue). A thin bed of mudstones (0.5 m) marks
the relatively abrupt change to carbonates within the Tsagaan Oloom Formation (c. 900 m). The lower part comprises organic-rich, fine-grained, laminated limestones and limey dolomites, which pass up into
crys-talline limestones in the upper part of unit 19, along with collapse breccias suggestive of karstic dissolution and replacement. Units 20 to 23 are mainly dolomitic carbon-ates, of which the latter yields the characteristic Vendian stromatolite Boxonia grumulosa (Lindsay et al. 1996a, this issue), and an Ediacaran age is generally inferred (Dorjnamjaa & Bat-Ireedui, 1991; Khomentovsky & Gibsher, 1996, this issue). We note, however, that this species is known from below Varanger diamictites in Svalbard (Raaben & Zabrodin, 1969) and closely related species occur through the Cryogenian (Preiss, 1976). This unit is succeeded by dark, laminated shales, with thin dolomitic, phosphatic and cherty interbeds (unit 24) suggestive of deeper waters, and then by a return to shelf and peritidal carbonate deposition.
Here we report, for the first time, the discovery of hexactinellid sponge spicule assemblages in cherts that lie some 15 m above the base of unit 25 in Tsagaan Gol (Brasier et al. unpub. data). This early record can be inte-grated with other published small skeletal fossil (SSF) records from the Salaany Gol, Bayan Gol and Orolchayn Gol sections by means of the lithological and sequence stratigraphic correlations discussed by Khomentovsky & Gibsher (1996, this issue) and Lindsay et al. (1996a, this issue). In Figure 6a and b we have built upon the synthe-sis of Khomentovsky & Gibsher (1996, this issue) by adding records on SSF assemblages outlined in Zhegallo & Zhuravlev (1991) and Astashkin et al. (1995) and doc-umented in Esakova & Zhegallo (1996) and Ushatinskaya (1995). As can be seen from Figure 6a, the sponge spicules near the base of unit 25 at Tsagaan Gol correlate with the first appearance datum (FAD) of Anabarites
trisulcatus and Cambrotubulus decurvatus in the
Orolchayn Gol section (Endonzhamts & Lkhasuren, 1988). The calcimicrobe Renalcis sp. first appears within unit 25, while calcimicrobe Korilophyton inopinatum appears in unit 27 (Dorjnamjaa et al. 1993). These fossils, and correlation across the region (Khomentovsky & Gibsher, 1996, this issue), suggest that the start of the Anabarites
trisulcatus Zone lies close to the base of unit 25.
The top of unit 27 contains Osagia oncoids, which are characteristic of the top of the Tsagaan Oloom Formation. The base of the Bayan Gol Formation is marked by shales and thin-bedded, grey to pink argillaceous limestones in the interval between beds 29 and 35. Numerous small burrows occur in unit 29, while SSFs of the Purella Zone appear in strata correlated with units 34 to 35 (cf. Khomentovsky & Gibsher, 1996, this issue). Massive limestones of unit 36 (103 m) provide a prominent marker, traceable onto the Salaany Gol ridge (Gibsher & Khomentovsky, 1990). Tommotia sp. and other fossils
the same level, 100 m apart; no overall C-O correlation is seen (r2=0.121) but samples 58-60, 62 show a stronger correlation ( r ^ 0.877). (f) from the upper 35 m of unit 21 at Bayan Gol, southern block; sample 70 shows extreme alteration of 818O; overall corre-lation between C and O is poor (1^=0.076). (g) from the top 32 m of unit 12, Salaany Gol; alteration of 818O is suspected at the top of the bed, but 813C is less affected (1^=0.478). (h) from the lower 50 m of the Salaany Gol Formation at Zuune Arts ridge (see Fig. 2); some covariant shifts are apparent but there is no clear trend (r2=0.212).
0.706 0.709 0.708 CO "2: CO 0.707 0.706 0) 2 3 4
Mn/Sr
1000 2000Sr (ppm)
3000 0.709 0.708 . 0.707 . 0.709 0.708 0.707 0 706 0 -10 L-H L D D D D 20 Fe/Sr•
D D 'Least-altered' I . I . I . I . I 30 D Ae
0.706 40 40 40 50 60 70 80 90 100 % dissolvable 30 2010
0.0 0.1 0.2 0.3 0.4 0.5 0.6 0.7 0 Mg/Ca x100 1000 2000Sr (ppm)
3000Figure 4. Studies of strontium isotopic variation in the Mongolian sections, (a) Mn/Sr versus 87Sr/86Sr values, (b) Sr (ppm) versus 87
Sr/86Sr values, (c) Fe/Sr versus 87Sr/86Sr values, (d) per cent dissolvable components versus ^Sr/^Sr values, (e) Mg/Ca ratio versus 87
Sr/86Sr values, (f) Sr (ppm) versus Fe/Sr. Straight lines drawn on the diagrams mark an arbitrary division between samples considered more and less likely to contain strontium with sea-water 87Sr/86Sr ratios. Hence, those samples with Sr > 550 ppm, Fe/Sr <3.0, Mn/Sr<0.6, and per cent dissolvable components > 8 5 % are considered to be 'least-altered' as opposed to 'suspect' samples. The
previously thought to be characteristic of the lower Tommotian in Siberia, occur from this level upwards in correlated sections (Voronin et al. 1982; Esakova & Zhegallo, 1996; Khomentovsky & Gibsher, 1996, this issue). This problem of the basal Tommotian Stage is dis-cussed in Section 7.
5.a.2. Carbon isotope results
This succession was sampled for isotopes on two occa-sions. In 1991, VK sampled using the unit numbers of Voronin et al. (1982) and Zhegallo & Zhuravlev (1991). This scheme was established for exposures at the foot of the Salaany Gol ridge, however, and not for Tsagaan Gol. Gibsher & Khomentovsky (1990) have argued that a fault cuts out most of beds 26 to 35 at Salaany Gol. In 1993, MDB therefore followed the latter scheme, and these more recent collections are here used to characterize beds 27 to 35. The two separate sets of results have been collated to give an overall picture of the isotopic record (Fig. 5).
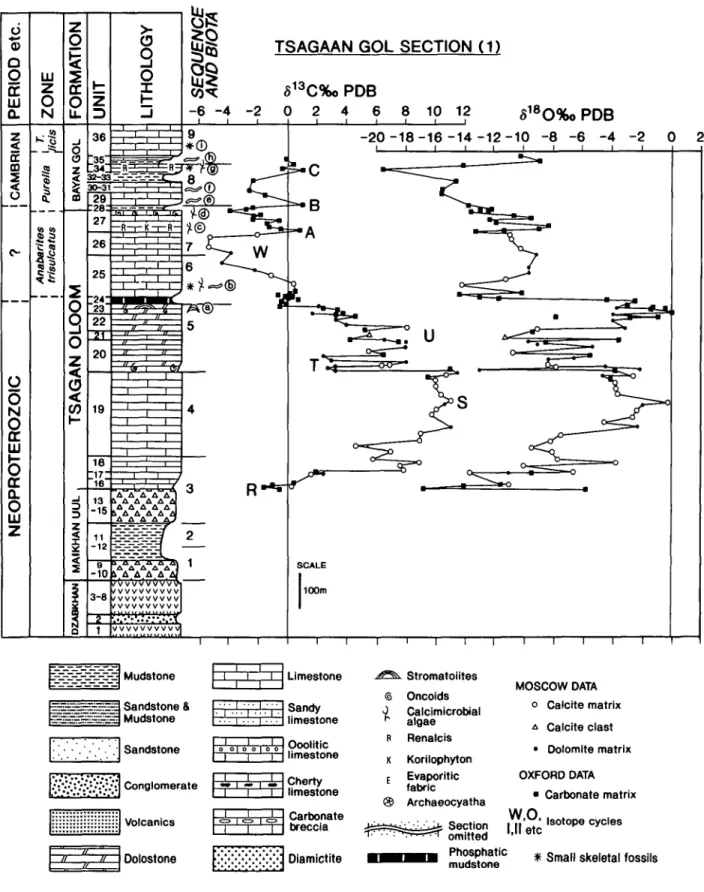
The carbon isotope profile shows a number of features, here identified by capital letters. 513C values rise from negative values (negative anomaly 'R'), to positive values above the top of the upper Maikhan Uul diamictite, in the limestones of sequence 3 (Tsagaan Gol Formation). Relatively stable and very positive values (feature 'S') occur through the limestones of sequence 4, reaching up to +11.4 %o near the top. Extremely high 818O values (for the Precambrian) rise through sequences 3 and 4 to a maximum of around zero. A sharp fall in 813C%o (to +2.8) occurs in the lower part of sequence 5 (feature T ' ) , which lies above the putative zone of karstic emergence. Slightly higher positive 8'3C values characterize higher dolomites and limestones (feature 'U'), declining upwards towards the Boxonia unit (-0.5 %o\ Fig. 5, fossil marker 'a'). Although changes take place in dolomite and calcite mineralogy at this level (Fig. 5, units 20-23), there is no consistent effect upon 813C values. Nor does the major facies change at the base of sequence 6 have much effect upon 8I3C (Fig. 5, units 24 to 25). There is, how-ever, a sharp negative shift in 818O at the base of unit 25.
A continued fall is seen in 813C between beds 25 and 26, reaching minimal negative values for the Ediacarian-Cambrian interval (-5.3 %o; negative anomaly 'W'). This contrasts with the preceding fall in 818O mentioned above, since it is part of a prolonged fall in values (rather than an abrupt shift), and it lies up to 150 metres higher in the section, that is, after the phosphatic shale interval rather than coincident with it. Hence it cannot be dis-missed as the product of organic degradation associated with phosphogenesis. An oscillatory rise (-3.9 to +1.0%o) is seen between units 26 and 36. Here, we provisionally label the positive features as 'A', 'B' and ' C . Some of the samples from units 30 to 36 could be regarded as
'suspect' (8I8O >-15.0%o, Fig. 5, Table 1), but the pattern of 'filtered' data remains similar.
5.a.3. Strontium isotope results
The Dzabkhan Formation at Tsagaan Gol lacks carbon-ates, but an opportunity was taken to sample limestones overlying the Lower Proterozoic crystalline basement at Kantayshir, some 240 km to the east of Govi-Altay. These have been compared in stratigraphic position with the base of the Dzabkhan Formation (Dorjnamjaa & Bat-Ireedui, 1991) and have yielded to us a single low "Sr/^Sr ratio of 0.7057. This sample contained 1230 ppm Sr, 10 ppm Mn and 123 ppm Fe, which would tend to indicate that little post-depositional trace element exchange has taken place.
Ten samples were collected by GS for strontium isotope analysis through some 50 m of limestones above the Maikhan Uul diamictite (units 16 to 17). Sr concen-trations are very high here (950-2900 ppm) and there is little evidence for post-depositional trace element exchange (see Table 1). Least-altered 87Sr/86Sr values show a linear rise from 0.7067 to 0.7072. Four samples were analysed in the Oxford laboratories across the zone of karstic emergence at the top of bed 19 (0.7073) and into lower bed 20 (0.7072 rising to 0.7077). These values are provisional and 'suspect' owing to the lack of trace element data. Six samples from limestones and dolo-stones beneath the top of the Boxonia grumulosa marker bed (units 20, 22, 23) yielded 'suspect' ""Sr/^Sr ratios between 0.7079 and 0.7083 and a single 'least-altered' ratio of 0.7079. Two samples from units 22 and 23 whose Sr concentrations were particularly high, but are otherwise 'suspect', also yielded ratios of 0.7079. Three 'least-altered' samples from the lower part of the Bayan Gol Formation (units 25 to 36) yielded "Sr/^Sr ratios of 0.7084 to 0.7086.
5.b. Salaany Gol ridge
S.b.l. Lithostratigraphy andbiostratigraphy
This section lies 20 km southwest of Jargalan village, on the northeast slope of the Khasagt-Khayr Khan range (section 2 of Fig. 1). The deep gorge of Salaany Gol
defines the western margin of the section, which exposes
the limb of a monocline dipping at 40-60° SW, compli-cated by minor folds and low amplitude dislocations.
To the east, the succession can be traced down to the Tsagaan Oloom and Dzabkhan formations (Voronin et al. 1982) but, as mentioned above, equivalents of beds 26 to 35 appear to be cut out by a fault (Gibsher & Khomentovsky, 1990; Khomentovsky & Gibsher, 1996, this issue). The two sections can be correlated by means
efficacy of using Sr (ppm) is illustrated by the ornaments on the figures: white squares = samples with Sr >550 ppm; black dots = 'suspect' samples.
TSAGAAN GOL SECTION (1) -20-18-16-14-12-10 -8 -6 -4 -2 Mudstone Sandstone & Mudstone Sandstone i . i I I Limestone • T.!.T!.T:i Sandy I. I . I. I • rr| limestone Stromatoiites @ Oncoids •I Calcimicrobial <- algae i l l O O I O O I 0 0 Ooolitic limestone g ^ g ] Conglomerate | | I i I 1 Renalcis Volcanics Oolostone i l l Carbonate breccia ! ' ! v j Diamictite K Korilophyton r Evaporitic fabric ® Archaeocyatha Section omitted Phosphatic mudstone MOSCOW DATA ° Calcite matrix A Calcite clast • Dolomite matrix OXFORD DATA • Carbonate matrix WO I II Isotope cycles # Small skeletal fossils
Figure 5. Carbon- and oxygen-isotope stratigraphy of Tsagaan Gol. The suggested positions of carbon isotopic features 'R' to ' W and 'A' to ' C are shown. Sequence boundaries are from Lindsay et al. (1996a, this issue). Biota first appearance datum (FAD) points are from Dorjnamjaa etal. (1993), Khomentovsky & Gibsher (1996, this issue), Lindsay etal. (1996a, this issue), as follows: (a) beds with stromatolite Boxonia grumulosa; (b) FAD (first appearance datum) of simple traces and hexactinellid sponge spicules; also SSFs
Anabarites trisulcatus, Cambrotubulus decurvatus (both by correlation from Orolchayn Gol); calcimicrobes Botominella lineata, Renalcis; (c) calcimicrobes Renalcis, FAD of Korilophyton; (d) oncoids with Osagia; (e, f, h) simple traces; (g) FAD of SSFs Lopochites sp., Purella cristata, Archaeooides granulatus, Maikhanella multa, Protohertzina sp., Siphogonuchites sp., plus Renalcis;
(i) FAD of SSF Tommotia sp. and others at nearby Salaany Gol. The zones are as shown in Figure 6. Unit numbers and lithostratigraphy are from Gibsher & Khomentovsky (1990), except the Maikhan Uul Member of the Tsagaan Oloom Formation, informally named by Dorjnamjaa etal. (1993, p. 21) and defined by Lindsay etal. (19966, this issue).
of the prominent limestone of unit 5 (sensu Voronin et al. 1982 = unit 7 of Zhegallo & Zhuravlev, 1991), which is equivalent to unit 36 at Tsagaan Gol.
The western part of the section exposes the most com-plete and fossiliferous succession through the Bayan Gol, Salaany Gol and Khayrkhan formations. This part of the succession was described in detail by Voronin et al. (1982; palaeontology summarized in English by Brasier, 1989), whose fossil markers are shown in Figures 6 and 7. In this paper we have modified the zones, to take account of new SSF data brought together in Figure 6a and b.
The Bayan Gol Formation consists predominantly of sandstones and siltstones, intercalated with three thick limestone beds (units 5, 7 and 12) and numerous thin limestone beds (units 9, 11 and the labelled fossil marker beds) that are traceable across the ridge. Phosphatic lay-ers in the limestones preserve a variety of SSFs used to establish local biozones. The Tiksitheca licis to Ilsanella
compressa-Anabarella plana Zones have usually been
correlated with the Tommotian of Siberia (e.g. Voronin et
al. 1982). Elements typical of the middle Tommotian
appear in the lower part of unit 10, towards the top of the Bayan Gol Formation (Voronin et al. 1982; Khomentovsky & Gibsher, 1996, this issue). Assemblages of the
Watsonella crosbyi Zone have been compared with the
middle Tommotian of Siberia (Missarzhevsky, 1982) or even the lower Atdabanian (Voronin et al. 1982; Astashkin etal. 1995). The latter interpretation appears to be based upon an isolated record of poorly illustrated acritarchs referred to Dictyotidium priscum,
Gonio-sphaeridium varium and Asteridum tornatum. These
would indicate assignment to the Heliosphaeridium
dissimilare-Skiagia cilosa assemblage, which is now
known to occur at least as low as the middle Tommotian in Siberia (Vidal, Moczydlowska & Rudavskaya, 1995). Recent work has also shown that the associated SSFs
Watsonella crosbyi and Stenothecoides sp. are both
known from the basal Tommotian in eastern Siberia (Khomentovsky & Karlova, 1993).
The top of unit 12 is reddened and overlain by con-glomerates of unit 13 (c. 150 m), containing siliceous and calcareous clasts that mark the base of the Salaany Gol Formation. The hiatus at the base of this formation is var-iously suggested to span the middle to upper Tommotian (Missarzhevsky, 1982) or the mid-Atdabanian (Astashkin
et al. 1995). The Salaany Gol Formation is intruded near
its base by a sill of pink, coarse-grained granite up to 5 m wide. The upper part of unit 13 marks a return to lime-stone deposition, and the first appearance of archaeocy-aths of Atdabanian type (Voronin et al. 1982; Astashkin
et al. 1995). Unit 14 comprises 270 m of massive,
bioher-mal limestones with archaeocyaths, interpreted as late Atdabanian (Voronin et al. 1982; Wood, Zhuravlev & Chimed Tseren, 1993; Astashkin et al. 1995). The formation is capped by up to 11 m of tabular-bedded limestones with archaeocyaths and SSFs taken to be of late Atdabanian age (e.g. Voronin et al. 1982).
The base of the Khayrkhan Formation (up to 500 m
thick) is an uneven, angular unconformable surface that, elsewhere, cuts down into the Bayan Gol Formation (Voronin et al. 1982, fig. 4). Sediments are predominantly sandy with conglomeratic interbeds (including Neo-proterozoic and lower Cambrian clasts) with subordinate siltstones, mudstones and limestones. Archaeocyaths and SSFs occur in the limestone bands (Voronin et al. 1982), but much of this biota appears to have been derived by erosion from underlying units, making it difficult to assess the age of this unit with precision. The appearance of SSFs Mongolodus rostriformis, Lapworthella dentata and Rhombocorniculum cancellatum (Korobov & Missarzhevsky, 1977; Missarzhevsky, 1977) have sug-gested a Botomian age for the base (Astashkin et al. 1995).
5.b.2. Carbon and strontium isotope results
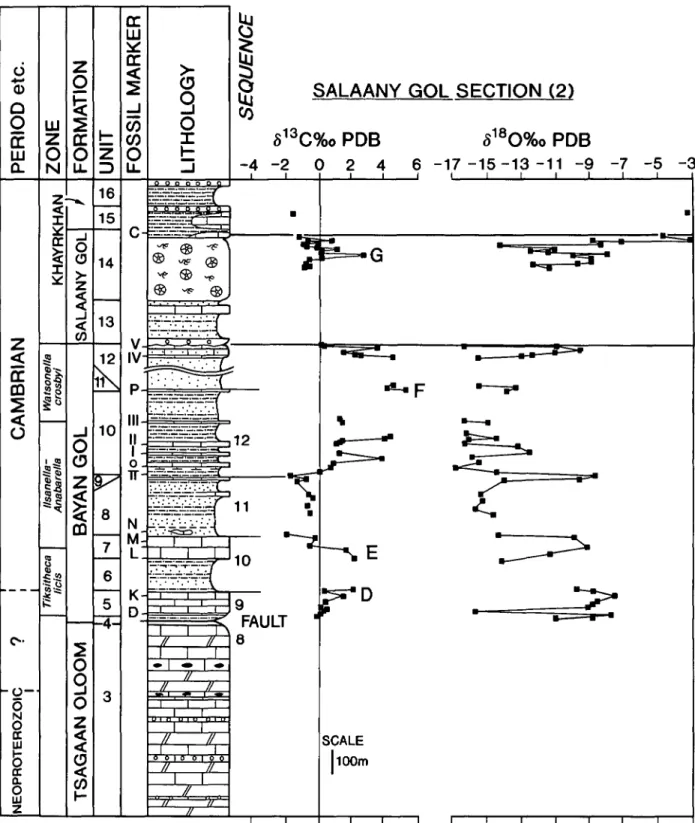
This section was sampled for carbon isotopes by MDB in 1991 and 1993, while the upper part was sampled for Sr isotopes by GS in 1993. The carbon isotopic profile (Fig. 7) is interrupted by thick units of sandstone. Even so, four broad phases can be distinguished. Positive 813C values (up to +2.3%o) are found in unit 5 (feature 'D') and mid-unit 7 (here separated as feature 'E' for reasons discussed below). A shift to negative 513C values in mid-unit 7 is sustained through the thin limestone beds of beds 8 and 9 (down to -1.9 %o). Positive but oscillatory 513C values are found in beds 10 to 12 (feature ' F \ up to 5.1 %o). Negative values predominate through the upper part of unit 14 and into 15, although five samples outline a posi-tive excursion (Fig. 7, at top; -1.1 to +2.5 %o, here labelled as feature 'G')- No data are available from beds 13 and lower 14, but this interval was sampled at Zuune Arts, which yielded stable, negative values (c. -0.6 to -1.6%o,Fig.2).
Seven 'least-altered' samples of carbonates from the lower part of the Bayan Gol Formation (units 5-7) show remarkably consistent "Sr/^Sr values of around 0.7084/5 (see Table 1). Five samples from the upper part of the Formation (units 8 to 12) lie between 0.7083 and 0.7088. Of these, two 'least-altered' samples with very high Sr concentrations yield 0.7083.
Two samples (5 analyses) from the upper part of the Salaany Gol Formation yielded consistent 87Sr/86Sr values of between 0.7081 and 0.7082. An archaeocyath and early diagenetic cement (SG3r and SG3w respectively) were measured separately. Sample SGI from the upper part of the Salaany Gol Formation was measured three times, to examine sample homogeneity and establish a suitable preparation technique. A further sample, from limestones in the lower part of the Khayrkhan Formation, was measured twice: KHm (micrite inside a broken archaeocyath) and KHr (a recrystallized archaeocyath). Both gave a ratio of 0.7083. From field observations, it is possible that these components may have been reworked from the underlying Salaany Gol Formation. Trace element chemistries for these samples from the top two formations, where measured, cannot rule out the effects
< O
I I
O w ZONES - 3II
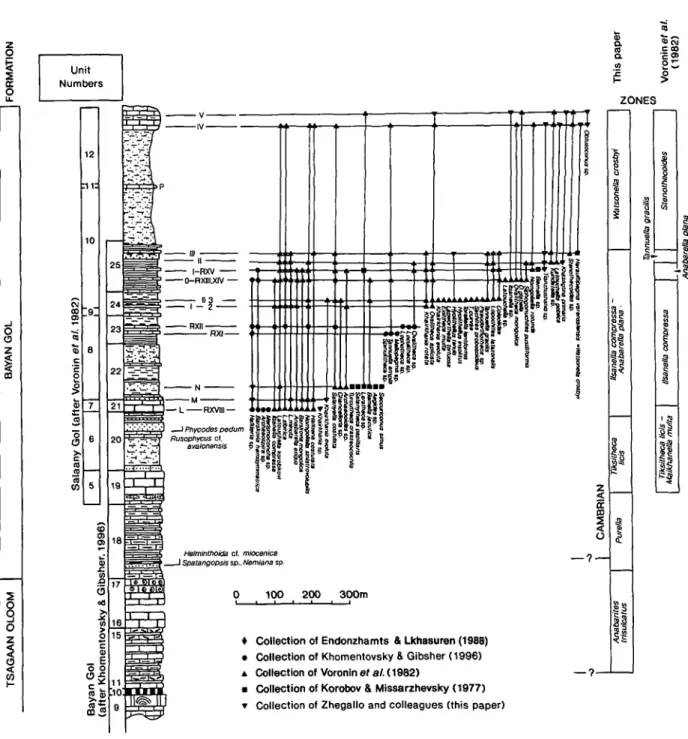
fc<sFigure 6. (a, b) Composite range charts for small skeletal fossils through the Neoproterozoic-Cambrian transition of western Mongolia; Anabarites trisulcatus to Tiksitheca licis Zones. These incorporate data from five separate collections: (1) Endonzhamts,
in Endonzhamts & Lkhasuren (1988); (2) Khomentovsky & Gibsher (1996, this issue); (3) authors in Voronin et al. (1982);
(4) Korobov & Missarzhevsky (1977); (5) Zhegallo & colleagues (Zhegallo & Zhurvalev, 1991; Astashkin et al. 1995; Esakova & Zhegallo, 1995; Ushatinskaya, 1995). The fossil horizons are collated according to the scheme of Khomentovksy & Gibsher (1996, this issue). Correlation between the units numbers for Bayan Gol (after Khomentovsky & Gibsher, 1996, this issue), Salaany Gol (after Voronin et al. 1982) and Tsagaan Gol (after Gibsher & Khomentovsky, 1990) are shown at left. A revised zonal scheme is shown at right, alongside that put forward by Voronin et al. (1982). The first appearance of two main trace fossil assemblages is shown against the log (after Goldring & Jensen, 1996, this issue). The Precambrian-Cambrian boundary is provisionally placed at the lowest level with a Cambrian-type trace fossil asemblage.
o Unit Numbers ZONES n ___ 100 200 300m
Collection of Endonzhamts & Lkhasuren (1988) • Collection of Khomentovsky & Gibsher (1996) A Collection of Voronin et al. (1982)
• Collection of Korobov & Missarzhevsky (1977) T Collection of Zhegallo and colleagues (this paper)
Figure 6. (b) For legend see facing page.
of post-depositional alteration (Table 1) and they are regarded as 'suspect', but the ^Sr/^Sr values show a broadly consistent picture.
S.c. Bayan Gol gorge
5.c. 1. Lithostmtigmphy and biostratigraphy
The section along Bayan Gol gorge provides a long but much faulted section through the following units: acid volcanic rocks of the Dzabkhan Formation; thin diamic-tites of the basal Tsagaan Oloom Formation (Maikhan Uul Member); overlying carbonates of the Tsagaan Oloom Formation; and terrigenous-carbonate intercala-tions of the Bayan Gol Formation. Two separate sets of unit numbering have been used: those of Zhegallo &
Zhuravlev (1991); and those of Gibsher et al. (1991), followed by Khomentovsky & Gibsher (1996, this issue).
The lower unit of the Maikhan Uul Member comprises beds of diamictite followed by a unit of coarse-grained arkosic sandstone (25 m; Fig. 8, unit 1). The upper diamictite is not visible, either because of poor exposure or because of removal by an unmapped thrust fault (Lindsay et al. 1996b, this issue). The overlying, middle member of the Tsagaan Oloom Formation exposes a thick succession (< 550 m) of interbedded dolomites varying from light-grey to almost black. In the upper member of this formation, dolomites are replaced by limestones (from dark- to light-grey) with black siliceous concre-tions. The conformably overlying Bayan Gol Formation includes various interbedded limestones (including
are-SALAANY GOL SECTION (2)
5
18O%o PDB
6 -17-15-13-11 -9 -7 -5 -3
5
13C%o PDB
- 4 - 2 0 2 4
Figure 7. Carbon- and oxygen-isotope stratigraphy of the Salaany Gol ridge section. The suggested positions of carbon isotopic fea-tures 'D' to 'F' are shown. Sequence boundaries are from Lindsay et al. (1996a, this issue). Fossil markers, unit numbers and forma-tions are from Voronin et al. (1982). Zones as in Figure 6. Key as for Figure 5.
naceous, argillaceous or dolomitic varieties), siliciclastic sandstones and siltstones.
5.C.2. Carbon and strontium isotope results
Samples from the 'northern block' of Bayan Gol gorge were collected by VK and MDB in 1991. These results are shown in Figure 8, using the 'ZZ' unit numbers of Zhegallo & Zhuravlev (1991). A return to the gorge in
1993 showed that faulting had disturbed the natural suc-cession about their beds 12 and 13 and no reliance could be placed on the 1991 data from this point and above. Figure 8 shows the results of further collecting by MDB and GS in 1993. Beds 8-16 were collected from the 'northern block', up to the fault zone, using the maps and 'GK' unit numbers of Gibsher (in Khomentovksy & Gibsher, 1996, this issue). Isotopic comparisons between 'GK' units 8-16 and 'ZZ' units 11-12 in Figure 8, suggest
3
O I
BAYAN GOL SECTION (3A)
8
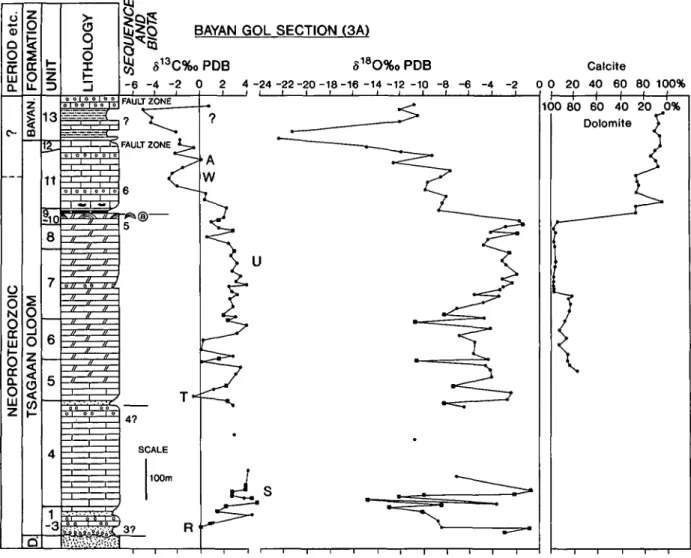
^ «13C%o PDB 518O%o PDB -6 - 4 - 2 0 2 4-24-22-20-18-16-14-12-10 -8 -6 -4 -2 Calcite 0 0 20 40 60 80 100% 100 80 60 40 20 0% DolomiteFigure 8. Carbon- and oxygen-isotope stratigraphy of the lower succession at Bayan Gol, northern block. The positions of carbon iso-topic features 'R' to 'A' are shown. A fault zone disturbs the top of this section. Calcite and dolomite data are differentiated in the upper part only. Column at right shows the shift from dolomite- to calcite-dominant carbonates above the Boxonia grumulosa stromatolite unit (biota datum 'a'). Sequence boundaries are from Lindsay et al. (1996a, this issue). Unit numbers and formations are after Zhegallo & Zhuravlev (1991). D. = Dzabkhan Formation; BAYAN = Bayan Gol Formation. Key as for Figure 5.
that the isotopic profiles are comparable. The upper part of the section ('GK' units 17-21) was studied in the 'southern block', alongside researches on sequence stratigraphy and trace fossils (Lindsay et al. 1996a, this issue; Goldring & Jensen, 1996, this issue).
The carbon isotope profiles (Figs 8, 9) show a number of distinct features. 813C rises from low values (c. 0%o, top of negative anomaly 'R') just above the Maikhan Uul diamictite, to positive values (4.6%o, cf. feature 'S') in unit 4 of the Tsagaan Gol Formation, followed by values near to zero in units 5 and 6 (cf. feature X ) . Relatively stable and positive carbon values between 4.0 and 2.0 %o occur through units 7 to 9 (feature 'U').
Carbonates through this section contain a fine-scale mixture of dolomite and calcite grains, with the balance between these shifting abruptly from dolomite to calcite above the base of unit 11 (Fig. 8, at right). This change in mineralogy is accompanied by a negative shift in 818O, but there is no abrupt 5I3C shift. Carbon isotopic ratios continue to decline above this level, reaching low values
in negative anomaly ' W (c. -2.8 %o). As at Tsagaan Gol, this anomaly comes well above the abrupt negative shift in 818O (Figs 8,9).
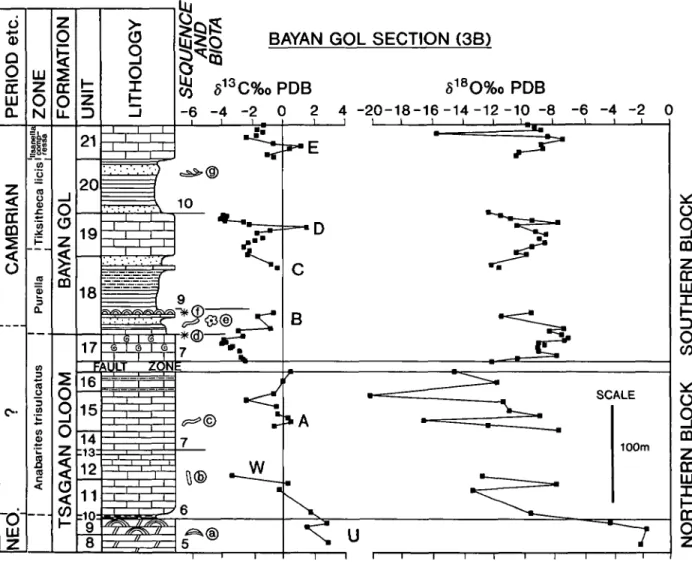
Above this, there is a fall in 813C through the top of the Tsagaan Oloom Formation (top of feature 'A', unit 17, Fig. 9); a 813C peak at the base of the Bayan Gol Formation (feature 'B', unit 18); a drop from the top of unit 18 to the base of unit 19 (upper part of feature 'C'); and a rise in 813C through unit 19 (feature 'D', Fig. 9). The covariant trend in 818O values (Figs 3e, 9), and the presence of fenestral calcite, both suggest that meteoric diagenesis may have affected 813C in the upper part of unit 19. No data are available through the thick clastic strata of unit 20. A 813C peak near the base of unit 21 declines upwards to negative values (feature 'E', Fig. 9).
With regard to 87Sr/86Sr values, dolomitic sample Bay Sla was the only sample whose ratio was significantly decreased by the Rb decay correction. It decreased from 0.7089 to 0.7086, even though the sample contains little Rb (1.7 ppm). This Sr value is considered unreliable
BAYAN GOL SECTION (3B)
4 -20-18-16-14-12-10 -8 -6 -4 -2
Figure 9. Carbon- and oxygen-isotope stratigraphy of the upper succession at Bayan Gol, northern and southern blocks (section 3 on Fig. 1). Carbon isotopic features 'U' to ' W and 'A' to 'E' are shown. Sequence boundaries are after Lindsay et al. (1996a, this issue). Biota FADs are from Dorjnamjaa et al. (1993), Goldring & Jensen (1996, this issue), Khomentovsky & Gibsher (1996, this issue) and Lindsay etal. (1996a, this issue): (a) stromatolite Boxonia grumulosa; (b) FAD of simple burrows, including small, Skolithos-WVs spar-filled pipes preserved as tubular fenestrae; (c) horizontal meandering burrows; (d) FAD of SSFs Pseudorthotheca bistriata,
Protohertzina unguliformis, Purella sp.; (e) FAD of trace fossils Didymaulichnus miettensis, Helminthoida cf. miocenica, Planolites
isp., Spatangospsis isp.; (f) FAD of SSFs Cambrotubulus decurvatus, Angustiochrea magna; (g) FAD of trace fossils Cochlichnus isp.,
Monomorphichnus isp., Palaeophycus tubularis, Phycodespedum, Rusophycus cf. avalonensis, Taphrhelminthoida cf. meandria. Unit
numbers and lithostratigraphy are after Gibsher et al. (1991) and Khomentovsky & Gibsher (1996, this issue). Zones as for Figure 6. Key as for Figure 5; calcite and dolomite samples undifferentiated.
because of the error associated with such a correction, together with evidence for unsuitable trace element chemistry and high amounts of insoluble residue (Table 1). Consistent, lower values (0.7084-0.7085) were found in samples through overlying units 11 to 14. Of six sam-ples through unit 17, one 'least-altered' sample yields 0.7085, while another from the middle of unit 19 also yields 0.7085. Of six samples from unit 2 1 , one 'least-altered' sample also yields 0.7085.
5.d. Khevte-'ftakhir-Nuruu (KTN) ridge 5.d. 1. Lithostratigraphy and biostratigraphy
This section is located c. 30 km southeast of Tayshir village, on the left bank of the River Zavkhan (section 4
on Fig. 1). Here is exposed a monocline, dipping south-east at 30° to 40° and broken into repeated successions by faults. A 'northern block' exposes a thick succession from beneath unit 1 to the top of unit 3. A 'southern block' repeats this succession up to unit 16 without major dislo-cation. Minor faulting was commonly observed at the boundary between units 1 and 2 (Zhegallo & Zhuravlev,
1991).
The general succession is shown in Figure 10. The Dzabkhan Formation and the Maikhan Uul Member of the Tsagaan Oloom Formation are not exposed. The faulted base of the Tsagaan Oloom Formation here begins with an unbroken, 350-m-thick succession of dolomites, varying from light-grey to almost black in colour. The
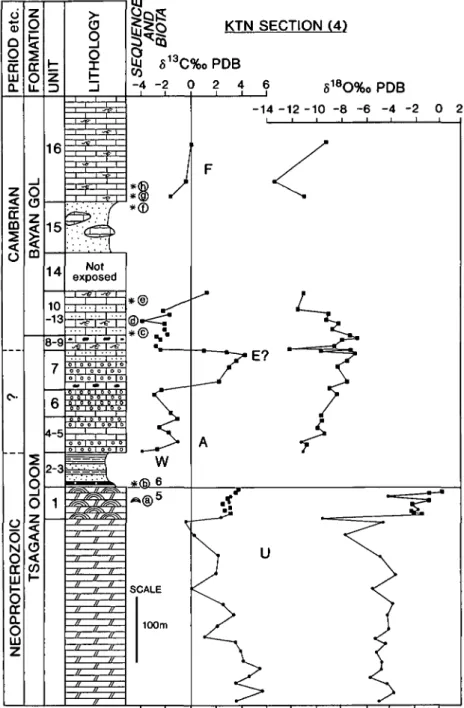
KTN SECTION (4) 513C%o PDB
- 1 4 - 1 2 - 1 0 - 8 - 6 - 4 - 2 0 2
Figure 10. Carbon- and oxygen-isotope stratigraphy of the Khevte-Tsakhir-Nuruu (KTN) ridge section. The positions of carbon iso-topic features ' U \ ' W , 'A'. 'E?' and 'F' are suggested. Biota FADs are from Zhegallo & Zhuravlev (1991), Dorjnamjaa et al. (1993) and Esakova & Zhegallo (1995): (a) stromatolite Boxonia grumulosa; (b) supposed FAD of SSF Anabahtes trisulcatus according to Dorjnamjaa et al. (1993); (c) FAD of SSFs Maikhanella multa, Rozanoviella atypica, Cambrotubulus decurvatus, Siphogonuchites sp.,
Lopochites cf. latazonalis, Archaeooides sp.; (d) FAD of SSFs Latouchella korobkovi, Khairkhania sp., Gonamella sp., Halkieria amorphe; (e) FAD of SSFs Nomgoliella sinistrovolubilis; (f) FAD of SSFs Tannuella sp., Spinulitheca sp., Hyolithellus tenuis; (g) FAD
of SSFs Nomgoliella rotundata, Bemella jacutica, Ovalitheca glabella; (h) FAD of SSF Purella sp. Assemblages (d) to (g) have faunas that correlate best with the Ilsanella compressa-Anabarella plana Zone. The unit numbers and formation boundaries are those of Zhegallo & Zhuravlev (1991). Key as for Figure 5; calcite and dolomite samples undifferentiated.
of the dolomites (unit 1). This is followed by thin siliceous phosphorite (unit 2) reported to contain
Anabarites trisulcatus (Dorjnamjaa et al. 1993).
Over-lying mudstones, siltstones and sandstones (unit 3) are followed by limestones of light- and dark-grey colour, with ooliths and black chert concretions (units 4 to 7). Mixed terrigenous and carbonate rocks, perhaps to be correlated with the Bayan Gol Formation, follow above a
local disconformity. Sediments consist of interbedded dark-grey limestones, siltstones and sandstones.
5.d.2. Carbon and strontium isotope results
Samples for isotopic analysis were collected for study at Moscow by VK, and independently for Oxford by Dr E. Zhegallo and Dr S. Bengtson in 1991. A
discrep-numbers. Further collection of the critical interval (unit 7) was therefore undertaken by MDB in 1993. The collated isotopic profiles are given in Figure 10. This easterly sec-tion is important for carbon isotope stratigraphy because unbroken carbonate deposition appears to have continued for longer than seen in the west.
Neither the extremely positive 813C values of feature 'S' nor the low values of feature 'T' have been encoun-tered in this section. Values up to c. 5.8 %o in the lowest exposed part of the Tsagaan Oloom Formation are com-pared with feature 'U' of previous sections. Ratios tend to decline upwards, followed by a reversal of this trend through the Boxonia unit, much as seen at Tsagaan Gol.
A peak of negative 813C values (c. -3.9%o) occurs directly above the phosphatic shale, in unit 4, correlated with negative anomaly ' W . A positive 813C excursion in unit 7 (up to +4.3 %o) cannot be matched at this level in other sections. A rapid return to negative 813C values is seen in upper unit 7 to unit 13. An isolated positive 813C value is found in the top of unit 13, and negative values occur in unit 16.
Four samples of dolomite (KTN1 to KTN4) were analysed for ^Sr/^Sr, from 20 m below the appearance of
Boxonia grumulosa to the top of this marker bed (unit 1).
These samples give 87Sr/86Sr ratios of 0.7079 to 0.7081. These dolomitic samples must be considered 'suspect', but their strontium isotopic ratios are broadly consistent with each other and concordant with the general strati-graphic trend.
5.e. Zuune Arts ridge
S.e.l. Lithostratigraphy and biostratigraphy
This section lies 65 km southwest of Uliastay, between the granite massifs of Zuune Arts and Barun Arts (section 5 on Fig. 1). The succession exposes a monocline, dip-ping at 20° to 40° and complicated by faults. Only the Salaany Gol Formation was studied here in 1991, although the Tsagaan Oloom Formation (415 m), with
Boxonia grumulosa marker unit, and the Bayan Gol
Formation, with Phycodes pedum near the base, are both
present (Voronin et al. 1982). Study of this part of the succession was planned in 1993 but prevented by cata-strophic flooding which destroyed bridges across the Zavkhan River.
The lower part of the Salaany Gol Formation com-prises poorly exposed silty limestones and siltstones (27 m). Above these lie rhythmically bedded units of oolitic, grey to pink archaeocyathan-microbial, and pink to red domal stromatolitic limestones (Fig. 2). The palaeontol-ogy of these rocks has been described by Drozdova (1980), Sayutina (1985), Ushatinskaya (1993, 1995), Wood, Zhuravlev & Chimed Tseren (1993) and Esakova 6 Zhegallo (1996). Archaeocyaths give evidence for a late Atdabanian age (Voronin et al. 1983; Wood, Zhuravlev & Chimed Tseren, 1993). The lithofacies and
subtidal calcimicrobial and archaeocyathan biostromes, to reddened stromatolites penetrated by neptunean dykes (see Wood, Zhuravlev & Chimed Tseren, 1993).
5.e.2. Carbon and strontium isotope results
Carbon isotope results have been obtained by the Oxford Laboratory from collections made in 1991 (Fig. 2). The 818O values vary widely, with some evidence for 18O depletion in the shallower facies 2 to 4. The 813C values remain steady and negative throughout (c. -0.6 to -1.6%oPDB), despite rhythmic changes in facies. Comparable negative 8I3C values were obtained from the upper part of the Salaany Gol Formation at Salaany Gol (Fig. 7). The only sample so far analysed for 87Sr/86Sr (ZA-8) yielded a 'least-altered' ratio of 0.7082. This value is consistent with 'suspect' samples measured from slightly higher in this formation at Salaany Gol (Table 1). 6. Regional synthesis
6.a. Carbon chemostratigraphy
Carbon isotopic data from the sections described above are brought together in Figure 11, alongside correlation of major lithological marker units (Khomentovsky & Gibsher, 1996, this issue) and sequence boundaries (Lindsay et al. 1996a, this issue).
Sequences 3 to 4 at Tsagaan Gol are characterized by a
rise from negative to positive 6
13C values, which reach up
to 11.4%o at one level (Fig. 11, features 'R' to 'S'). Limestones predominate in this part of the Tsagaan Oloom Formation, and karst-like breccias near the top of sequence 4 may indicate an important episode of emer-gence. At Bayan Gol, comparable limestones extend through the lowest 350 m of the formation, and the low 813C values of negative anomaly 'R' are seen above the Maikhan Uul diamictite, but values in sequence 4 do not exceed 4.6 %o. This may be because wide sample spacing has led to our missing peak values. An alternative expla-nation is that erosion (or faulting?) at the top of sequence
4 (or perhaps above the diamictite) has removed feature
'S' with maximal 813C values, but as yet there is no evi-dence for this.
The base of sequence 5 at Tsagaan Gol is marked by a sharp drop in 813C values (to 2.8 %o), followed, mainly, by dolomites whose values do not exceed 8.0%o. Much lower values are seen in dolostones to the east, at Bayan Gol (<4.0%o) and Khevte-Tsakhir-Nuruu (KTN) (<5.8%o). This, and the clear differences in the profiles, are best explained by contrasting patterns of sediment accumulation. The interval with oscillatory and negative values ('T') is thicker at Bayan Gol, thinner at Tasgaan Gol and apparently not sampled at KTN. While the decline in values towards the Boxonia grumulosa bed ('U') is seen in each section, there are distinct contrasts at the level of this marker: the positive shift at Bayan Gol
Basal congolomerate Sandstone and siltstone
Sandstone, siltstone and limestone Shale with phosphate and chert
Mainly limestone Mainly dolostone Diamictite G 10
1,2
SequenceKhayrkhan Salaany Gol Bayan Gol
Lower Cambrian
Tsagaan Oloom
? Neoproterozoic
Figure 11. Comparison and correlation of carbon isotope curves obtained from the Neoproterozoic to early Cambrian of western Mongolia, calibrated by the boundaries of sequences 3 to 12 of Lindsay et al. (1996a, this issue). The columns show Section 1, Tsagaan Gol; Section 2, Salaany Gol; Section 3A, Bayan Gol northern block, plus Section 3B, Bayan Gol southern block; Section 4, Khevte-Tsakhir-Nuruu; Section 5, Zuune Arts. 'Suspect'carbon isotopic values (with 813C>-5%o, 8'80>-15%oorferroan carbonate phases in the matrix) are shown as open circles. As can be seen, the filtering out of such values would have little impact on the curves. The suggested correlation of carbon isotopic features 'R' to ' W and 'A' to 'G' indicates considerable contrasts in depositional rate between the sections.
missing at Tsagaan Gol.
Sequence 6 is marked by the distinctive negative anomaly of feature ' W at each section, followed by the multiple peaks of carbon isotopic feature 'A' in sequence 7. The latter feature is seen at Bayan Gol and Tsagaan Gol but is not clearly defined at KTN. The top of sequence 7 is marked by sharply falling values.
The base of the Bayan Gol Formation (sequence 8) has a minor excursion at both Tsagaan Gol and Bayan Gol (Fig. 11, feature 'B'). Sequence 9 contains two peaks at both localities (features ' C , 'D') of which the latter reaches values of up to 2.0 %c. At Bayan Gol, the upper-most carbonates in this sequence show a negative trend which is not seen at Salaany Gol, suggesting that non-deposition or erosion has cut out this portion of the pro-file.
Correlation of the Bayan Gol Formation at KTN is hin-dered by the lack of marker beds. Negative anomaly ' W is here followed by values up to 4.3 %o, which cannot be matched in sections to the west (Fig. 11). The succeeding, negative interval contains fossil assemblages at the base that elsewhere are not found below sequence 9, followed by others typical of sequence 10. This can best be explained if the positive excursion at KTN correlates with feature 'E', of which only the upper part is seen in sequence 10 at Salaany Gol and Bayan Gol (Fig. 11).
Slightly negative values are found above feature 'E' in sequence 11, both at Salaany Gol and at a correlative horizon at KTN. The carbon isotopic character of sequence 12 in the upper part of the Bayan Gol Formation is so far known only from data at Salaany Gol. Here, the great increase in thickness of clastic units, coupled with the relatively stable faunal character (Fig. 6a, b), suggest that the rate of sediment accumulation was increasing. This is also suggested by carbon isotopic feature 'F', in which positive values above 3%o (maximum 5.1 %o) are spread through some 450 m of strata. A major break at the top of the Bayan Gol Formation is suggested by a weath-ered horizon followed by conglomerates. The Salaany
Gol Formation at both Zuune Arts and Salaany Gol has
yielded mainly negative 513C values (feature 'G'). Figures 12 and 13 show a composite carbon isotopic curve based upon the Tsagaan Gol-Salaany Gol section, to which extra data from Bayan Gol and Zuune Arts have been added. The suggested position of KTN feature 'E'? is also shown.
6.b. Strontium chemostratigraphy
Previous studies have shown that the lowest 87Sr/86Sr ratios for a given time interval typically provide the best indication of coeval sea-water values (e.g. Deny et al. 1994; Smith et al. 1994; Nicholas, 1996) although this is not always the case (see Gao & Land, 1991). Our 'least-altered' samples from Mongolia follow this general rule of thumb quite well. In Figures 12 and 13, we put forward
The low "Sr/^Sr ratio (0.7057) of Riphean carbonates from Kantayshir must lie at some point below the base of the lower Maikhan Uul diamictite (see Section 5.a.3). If this value represents coeval sea-water (which appears possible from trace element and lithofacies data), this would indicate a pre-Sturtian stratigraphic age, that is, >710 Ma (see, e.g. Asmerom et al. 1991). In Figures 12 and 13, the 87Sr/86Sr values obtained from carbonates above the upper diamictite are plotted against the com-posite carbon isotopic scale. The linear rise in values from 0.7067 to 0.7072 in sequence 3 coincides with the major rise in 513C from -1.9 to +7.3 %o. 'Suspect' ^Sr/^Sr values in sequence 4 are not much higher (0.7073), while one 'suspect' sample from the base of sequence of 5 yields 0.7072. There is little control yet over whether these latter values accurately record coeval sea-water, so they must be considered as maximum values for this time.
A steep rise in ^Sr/^Sr values takes place through sequence 5, from 0.7072 in dolomites at the base, through 0.7077 in dolomites in the middle, to 0.7079 in a 'least-altered' limestone near the top. Similar 'suspect' values (0.7079-0.7081) are also found in dolomites from just below the Boxonia grumulosa unit at KTN and continue to its top. Unfortunately, there is little control over whether or not such dolomites provide reliable 87Sr/86Sr ratios, but there are precedents for believing that dolomite samples can retain values close to those of original sea-water (e.g. Burns & Matter, 1993; Nicholas, 1996).
The shift towards 0.7084 in sequences 5 and 6 (at Bayan Gol and Tsagaan Gol) takes place through an interval of rapidly declining 813C values and is punctuated by an abrupt drowning of the carbonate platform and the appearance of the Anabarites trisulcatus fauna. Ratios of 0.7084-0.7085 are maintained through the negative car-bon isotope anomaly of feature ' W and positive feature
'A' (sequence 7, Bayan Gol and KTN).
The change towards clastic facies in the Bayan Gol Formation is not accompanied by an appreciable change
in "Sr/^Sr ratios. Sequences 8 and 9 in the Bayan Gol
Formation yield 'least-altered' values of 0.7084 (at Tsagaan Gol) rising to 0.7085 (at Salaany Gol). Similar values are maintained through sequence 10 (at Bayan Gol and Salaany Gol Ridge). It therefore appears that
87
Sr/86Sr ratios remained relatively stable throughout the lower 800 m or so of the Bayan Gol Formation. 'Least-altered' values in the upper part of the Formation at Salaany Gol Ridge (at the levels of sequences 11 and 12) show a drop to 0.7083. A comparable but 'suspect' value of 0.70835 has also been obtained from just below calcimicrobial bioherms at Tayshir (sample Tayshir 1). Both results suggest that a slight decline in 87Sr/86Sr took place through the middle to upper part of the Bayan Gol Formation.
An erosional break lies beneath the Salaany Gol Formation, of which the lower part reveals a further drop