Cardiovascular responses to the ingestion of sugary drinks using
a randomised cross-over study design: does glucose attenuate the
blood pressure-elevating effect of fructose?
Erik K. Grasser*, Abdul Dulloo and Jean-Pierre Montani
Division of Physiology, Laboratory of Integrative Cardiovascular and Metabolic Physiology, Department of Medicine, University of Fribourg, Chemin du Muse´e 5, Fribourg 1700, Switzerland
(Submitted 12 September 2013 – Final revision received 6 January 2014 – Accepted 18 February 2014 – First published online 29 April 2014)
Abstract
Overconsumption of sugar-sweetened beverages has been implicated in the pathogenesis of CVD. The objective of the present study was to elucidate acute haemodynamic and microcirculatory responses to the ingestion of sugary drinks made from sucrose, glucose or fructose at concentrations similar to those often found in commercial soft drinks. In a randomised cross-over study design, twelve young healthy human subjects (seven men) ingested 500 ml tap water in which was dissolved 60 g of either sucrose, glucose or fructose, or an amount of fructose equivalent to that present in sucrose (i.e. 30 g fructose). Continuous cardiovascular monitoring was performed for 30 min before and at 60 min after ingestion of sugary drinks, and measurements included beat-to-beat blood pressure (BP) and impedance cardiography. Additionally, microvascular endothelial function testing was performed after iontophoresis of acetylcholine and sodium nitroprusside using laser Doppler flowmetry. Ingestion of fructose (60 or 30 g) increased diastolic and mean BP to a greater extent than the ingestion of 60 g of either glucose or sucrose (P, 0·05). Ingestion of sucrose and glucose increased cardiac output (CO; P, 0·05), index of contractility (P, 0·05) and stroke volume (P, 0·05), but reduced total peripheral resistance (TPR; P, 0·05), which contrasts with the tendency of fruc-tose (60 and 30 g) to increase resistance. Microvascular endothelial function did not differ in response to the ingestion of various sugary drinks. In conclusion, ingestion of fructose, but not sucrose, increases BP in healthy human subjects. Although sucrose comprises glucose and fructose, its changes in TPR and CO are more related to glucose than to fructose.
Key words:Sucrose: Haemodynamics: Cardiac output: Total peripheral resistance
Overconsumption of soft drinks is now considered to be a major public health concern with implications for the patho-genesis of obesity, type 2 diabetes and CVD. There is
compel-ling evidence that consumption of sugar-sweetened
beverages, as well as sugar in the form of fructose or glucose, is associated with increased blood pressure (BP)(1). Further-more, reduced consumption of sugar-sweetened beverages, as well as sugars in the form of sucrose, glucose and fructose, was found to be significantly associated with reduced BP in a prospective study(2).
Although several long-term and epidemiological studies have evaluated the association between sugars and BP(1 – 5), little is known about postprandial cardiovascular and haemo-dynamic responses to sugary drinks. In healthy elderly sub-jects, consumption of sucrose and glucose, but not fructose,
decreased BP(6), suggesting differential haemodynamic
responses to the ingested sugars. Recently, work in our
laboratory has shown that BP increased acutely after fructose, but not glucose, ingestion in healthy young adults(7). In the latter study, the BP response was accompanied by a substan-tial drop in total peripheral resistance (TPR) after glucose ingestion, which was not observed with fructose ingestion(7). Microvascular endothelial dysfunction was found to be associ-ated with increased BP in obese and lean women(8)as well as in normal subjects(9). Recently, a study has found no alteration of endothelial function after ingestion of either a glucose or isoenergetic glucose – fructose (45:55, w/w) beverage(10), but in this latter study, they did not measure haemodynamics, therefore, a relationship between endothelial function and the BP effect of sucrose, glucose and fructose is still lacking.
The purpose of the present study was to evaluate in young and healthy adults the haemodynamic consequences of sucrose, and its building blocks fructose and glucose ingested separately as well as in combination. A second aim was to
* Corresponding author: E. K. Grasser, fax þ 41 26300 9734, email [email protected]
Abbreviations: ACh, acetylcholine; BP, blood pressure; CO, cardiac output; DBP, diastolic blood pressure; HR, heart rate; IC, index of contractility; MBP, mean blood pressure; SBP, systolic blood pressure; SV, stroke volume; TPR, total peripheral resistance.
qThe Authors 2014
British
Journal
of
investigate microvascular endothelial function to determine a possible relationship to the observed BP-elevating effects of fructose.
Materials and methods Subjects
A total of twelve healthy young adults (five women, seven men), aged 22·0 (SE0·4) years, were recruited from local stu-dents and their friends. The mean height of the participants was 175 (SE 3) cm, body weight was 66 (SE 3) kg and BMI was 21·5 (SE 0·7) kg/m2. All of the test subjects were
non-obese with normal resting BP (brachial systolic blood pressure (SBP)/diastolic blood pressure (DBP) , 135/85 mmHg). None of the subjects had any diseases or were taking any medi-cation affecting cardiovascular regulation. All participants fasted for $ 12 h and abstained from alcohol, smoking and caffeine, as well as from vigorous exercise for 24 h, before each test and were advised not to change their dietary habits between the tests. The present study was conducted according to the guidelines laid down on the Declaration of Helsinki, and all procedures involving human subjects were approved by the local ethics committee (approval no. 132005). Written informed consent was obtained from all subjects.
Experimental design
All studies started between 08.00 and 09.00 hours in an air-conditioned (temperature 22 ^ 18C), quiet laboratory, with subjects at thermal comfort. Every test subject attended four separate experimental sessions (separated by at least 3 d) according to a randomised cross-over design. Randomis-ation was performed using a random sequence generator (http://www.random.org/sequences/) by which the session order was determined for twelve test subjects before the commencement of the study. At each experimental session, cardiovascular responses to one of four test drinks were mon-itored. The drinks tested were as follows: (1) water containing 60 g sucrose; (2) water containing 60 g glucose; (3) water
containing 60 g fructose; (4) water containing 30 g fructose. Each test drink also contained 10 ml lemon juice (to cover par-tially the difference in sweetness) and was made up to a total of 500 ml by addition of tap water (water temperature 22 ^ 18C). The subjects were not informed about the order of the drinks.
On arrival at the laboratory, subjects were asked to empty their bladders if necessary and to sit in a comfortable armchair. All subjects wore light clothing consisting of a t-shirt and trou-sers. The equipment was then connected and the test subject’s upper part of the body was covered with a light blanket. After waiting for a period (within 30 min) to reach stable values for cardiovascular functions (heart rate (HR), BP and cardiac output (CO)), the microvascular function test was performed (time required: approximately 32 min). Cardiovascular record-ings started immediately after the microvascular testing with a 30 min baseline period after which the subjects ingested the test drink over a period of 4 min, which was followed by post-drink cardiovascular recordings made for 60 min. At the end of this period, the BP measuring equipment was removed and microvascular function testing was repeated. Throughout the procedures, subjects were allowed to watch documentaries.
Haemodynamics
Cardiovascular recordings were performed using a Task Force Monitor (CNSystems Medizintechnik AG) with data sampled at a rate of 1000 Hz(11). Continuous BP was monitored using the Penaz principle from either the index or middle finger of the right hand and was calibrated to oscillometric brachial BP measurements on the contralateral arm. Impedance cardiogra-phy measurements(12), in which the changes in thoracic impe-dance are converted to reflect the changes in thoracic fluid content/volume over time, were performed based on the orig-inal Kubicek et al.(13) approach but using an improved esti-mate of thoracic volume(14), which allows calculation of cardiac stroke volume (SV). Electrocardiogram/impedance electrodes were positioned together with upper-arm and Table 1. Baseline haemodynamic data recorded 30 min before ingesting each of the test drinks and baseline laser Doppler
perfusion for microvascular measurements (Mean values with their standard errors)
Fructose (60 g) Fructose (30 g) Glucose (60 g) Sucrose (60 g)
Mean SE Mean SE Mean SE Mean SE
Systolic blood pressure (mmHg) 117 3 118 3 115 3 116 4
Mean blood pressure (mmHg) 89 2 91 3 88 2 88 3
Diastolic blood pressure (mmHg) 76 2 77 3 74 2 75 3
Heart rate (beats/min) 64 3 64 2 63 2 62 2
Stroke volume (ml) 81 4 80 4 82 3 85 3
Cardiac output (litres/min) 5·1 0·2 5·2 0·2 5·1 0·2 5·2 0·2
Total peripheral resistance (mmHg £ min per litre) 17·6 0·6 17·7 0·8 17·3 0·5 17·2 0·7
Index of contractility (1000/s) 54 3 55 3 56 3 57 4
Acetylcholine (PU)† 15·2 2·5 19·8 3·2 19·9 2·3 22·5 3·9
Sodium nitroprusside (PU)† 10·9 1·8 12·7 1·8 15·6 2·5 15·9 3·4
PU, perfusion units.
† Baseline skin blood flux, average over the last 30 s before the first application.
British
Journal
of
finger BP cuffs. Electrode strips were placed at the neck and thoracic regions, the latter specifically at the midclavicular line at the xiphoid process level (CNSystems standard elec-trode kits). Myocardial contractility parameters were derived through impedance cardiography measurement(12).
Microvascular endothelial function
Microvascular endothelial function was assessed non-inva-sively in the finger-skin microcirculation by a combination of iontophoresis and laser Doppler flowmetry (Perimed PF5010; Ja¨rfa¨lla), using a standard protocol(15).
Acetylcholine (ACh, 1 %, Fluka; Sigma-Aldrich Chemie GmbH) was delivered to the middle dorsal phalanx of the third finger of the non-dominant hand using an anodal electri-cal current, consisted of seven doses (0·1 mA for 20 s) with a 60 s interval between each dose. The electrical current was conveyed by a battery power supply that was isolated from the mains electricity. Then, sodium nitroprusside (0·01 %, Riedel-de Haen; Sigma-Aldrich Laborchemikalien GmbH) was delivered to the same spot of the fourth finger using a
cathodal current, consisted of nine doses (0·2 mA for 20 s) with a 90 s interval between each dose. Skin perfusion responses were recorded by a laser Doppler flowmetry probe (in perfusion units), and the temperature of the probe was kept constant at 328C during all measurements. The pro-tocol was chosen because it is sufficient to provide effective ACh and sodium nitroprusside delivery but avoids
non-specific vasodilation observed with higher electrical
charges(16). CV for the maximum response to ACh was 31 (SE 5) % and to sodium nitroprusside was 40 (SE5) %, deter-mined from all pre-drink tests, which is in agreement with a previous study(17).
Data and statistical analysis
The present sample size is based on variability estimates for BP (our primary outcome) obtained from our previous exper-iments(7). Power analysis, with type I error (a) of 0·05 and a desired power (1 2 b) of 0·80, suggests that for such an investigation of repeated measures (on the same subject), a total number of twelve subjects would be required.
10 (a) (b) 8 6 4 2 0 ∆ SBP (mmHg) ∆ SBP (mmHg) ∆ DBP (mmHg) –2 –4 –30 –15 0 15 30 * * * * *** *** *** *** ***††‡‡ ***†‡‡ *** ***† * *** ** ** ** * *** *** *** 45 60 0 1 2 3 4 5 6 7 8 0 1 2 3 4 5 6 7 8 Fructose Fructose 30 Glucose Sucrose Fructose Fructose 30 Glucose Sucrose Time (min) 10 8 6 4 2 0 ∆ DBP (mmHg) –2 –4 –30 –15 0 15 30 45 60 Time (min)
Fig. 1. Time course for changes in systolic blood pressure (SBP) (a) and diastolic blood pressure (DBP) (b) before and after ingestion of fructose ( ), fructose at 30 g (fructose 30; ), glucose ( ) and sucrose ( ). Time 0 indicates the resumption of the recordings after the 4 min drink period. Values are means, with their standard errors represented by vertical bars. Mean value was significantly different from that at baseline over time: * P, 0·05, ** P, 0·01, *** P, 0·005. Mean value was significantly different from that of the sucrose drink (equivalent to the AUC): † P, 0·05, †† P, 0·01. ‡‡ Mean value was significantly different from that of the glucose drink (equivalent to the AUC) (P, 0·01).
British
Journal
of
Assumptions employed in the power analysis of the present study for BP, our most relevant variable, include the following: (1) standard deviation (s) of the difference in post-drink BP response of 5 mmHg; (2) physiologically and clinically relevant difference (d) in post-drink BP change of 5 mmHg.
Values of cardiac interval, BP (SBP, mean blood pressure (MBP) and DBP), cardiac SV and index of contractility (IC) were averaged every 15 min during the baseline period and over the 1 h post-drink period. CO was derived as the product of SV and HR. TPR was calculated as MBP divided by CO, whereas MBP was calculated from DBP and SBP, respectively:
MBP ¼ DBP þ 1=3ðSBP 2 DBPÞ:
The IC reflects the aortic peak flow and it is the maximum impedance changes (DZ divided by Dtmax) normalised to the ground impedance Z0. Maximal increase in skin perfusion was computed as the average of the last two stimuli minus baseline.
All values are reported as means with their standard errors. Statistical analysis was performed by two-way ANOVA for repeated measures with time (0, 15, 30, 45 and 60 min) and treatment – sucrose (60 g), glucose (60 g), fructose (60 g)
and fructose (30 g) – as within-subject factors using statistical software (Statistix version 8.0; Analytical Software). Where sig-nificant differences were found, the effects of each drink over time were analysed by comparing the values at each time point over the post-drink period with the baseline values recorded during the 30 min period immediately before drink-ing. One-way ANOVA with Dunnett’s multiple comparison test and repeated-measures ANOVA with the Newman – Keuls post hoc test were used to determine the changes over time from baseline levels and to compare mean changes between the drink types. A paired t test was used to compare mean changes from baseline over 60 min for each drink, respect-ively. A Friedman test with Dunn’s post hoc testing was used to compare vasodilatory responses before and after drug administration. All reported P values are two-sided. For all tests, significance was set at P# 0·05.
Results
Cardiovascular responses to the sugary drinks
Resting values were similar for both haemodynamic and microvascular measurement parameters (Table 1). None of
10 (a) (b) 8 8 7 6 5 4 3 2 1 0 0 Fructose Fructose 30 Glucose Sucrose 1 2 3 6 4 2 0 –2 ∆ MBP (mmHg) ∆ HR (beats/min) ∆ MBP (mmHg) ∆ HR (beats/min) –4 –4 –6 –8 –2 0 2 4 6 8 –30 –15 0 15 30 *** *** *** *** ***††‡‡ ***†‡‡ *** *** *** *** ** *** * ** ** * 45 60 Time (min) –30 –15 0 15 30 45 60 Fructose Fructose 30 Glucose Sucrose Time (min)
Fig. 2. Time course for changes in mean blood pressure (MBP) (a) and heart rate (HR) (b) before and after ingestion of fructose ( ), fructose at 30 g (fructose 30; ), glucose ( ) and sucrose ( ). Time 0 indicates the resumption of the recordings after the 4 min drink period. Values are means, with their standard errors represented by vertical bars. Mean value was significantly different from that at baseline over time: * P,0·05, ** P, 0·01, *** P,0·005. Mean value was significantly different from that of the glucose drink (equivalent to the AUC): † P,0·05, †† P, 0·01. ‡‡ Mean value was significantly different from that of the sucrose drink (equivalent to the AUC) (P, 0·01).
British
Journal
of
the test subjects reported nausea or other unpleasant effects after ingesting the test drinks.
Figs. 1 and 2 show the changes in SBP, DBP, MBP and HR after ingesting the various test drinks. Significant effects for time (SBP: P, 0·005; DBP: P, 0·005; MBP: P, 0·005; HR:
P, 0·005), drink (SBP: P, 0·05; DBP: P, 0·01; MBP:
P, 0·005) and drink £ time interaction (SBP: P, 0·05; DBP: P, 0·01; MBP: P, 0·01; HR: P, 0·05) were found for SBP, DBP, MBP and HR. Ingestion of fructose (60 or 30 g) led to sig-nificant elevation in SBP, DBP and MBP over time starting approximately 30 min after ingestion (peak fructose 60 g for SBP: 7·1 mmHg, P, 0·005; DBP: 5·6 mmHg, P, 0·005; MBP: 6·1 mmHg, P, 0·005; peak fructose 30 g for SBP: 5·4 mmHg,
P, 0·005; DBP: 4·0 mmHg, P, 0·005; MBP: 4·3 mmHg,
P, 0·005). Ingestion of glucose led to increased SBP (2·5 mmHg, P, 0·05) over time, whereas ingestion of sucrose showed no changes related to BP (Figs. 1 and 2). Comparison of the responses to the ingested test drinks (mean change from baseline levels) showed that the increases in DBP and MBP were significantly higher for fructose (60 or 30 g) than for either glucose or sucrose (Figs. 1 and 2). For SBP, there was a significant difference found between fructose and sucrose (Fig. 1(a)). The fructose 30 g drink decreased HR sig-nificantly within the first 15 min after ingestion followed by a
steady increase, at which a similar time course to that of the fructose 60 g drink was observed. The HR response over time for glucose and sucrose resulted, after a small initial drop, in a gradual increase for sucrose but not for glucose. A comparison between the test drinks showed no significant differences in changes from baseline levels (Fig. 2(b)).
Figs. 3 and 4 show the changes over time and the mean changes from baseline levels for CO, TPR, SV and IC. Signifi-cant effects for time (CO: P, 0·005; TPR: P, 0·01; SV: P, 0·005; IC: P, 0·005), drink (CO: P, 0·005; TPR: P, 0·005; SV: P, 0·05; IC: P, 0·05) and drink £ time interaction (CO: P, 0·01; TPR: P, 0·005; SV: P, 0·005; IC: P, 0·005) were found for CO, TPR, SV and IC. All sugars increased CO, but only glucose and sucrose showed significant changes over time (peak for glucose: 0·54 litres/min, P, 0·005; peak for sucrose: 0·51 litres/min, P, 0·005). Glucose and sucrose showed significantly higher CO compared with fructose (60 or 30 g) (Fig. 3(a)). Comparison of changes over time indicates that TPR is slightly, but not significantly, increased with the ingestion of fructose (60 and 30 g) but decreased significantly with the ingestion of glucose and sucrose (peak for glucose: 2 1·18 mmHg £ min per litre, P, 0·01; peak for sucrose: 2 1·45 mmHg £ min per litre, P, 0·005). TPR for fruc-tose (60 or 30 g) is significantly higher than that for glucose or
Fructose Fructose 30 Glucose Sucrose Fructose Fructose 30 Glucose Sucrose §§§|| || || §§§|| || || 0·8 (a) (b) 0·6 0·4 0·2 0·2 0·1 0·0 2·0 1·5 1·0 0·5 0·0 –0·5 –1·0 –1·5 –2·0 0·3 0·4 0·5 0·6 0·7 *** *** ****** ***††‡‡‡ ** ** ** *** ** *** * ***††‡‡ *** ** 0·0 ∆ CO (l/min) ∆
TPR (mmHg×min per litre) ∆ TPR (mmHg×min per litre)
∆ CO (l/min) –0·2 –0·4 –30 –15 0 15 30 45 60 Time (min) –2·5 –2·0 –1·5 –1·0 –0·5 0·0 0·5 1·0 1·5 –30 –15 0 15 30 45 60 Time (min)
Fig. 3. Time course for changes in cardiac output (CO) (a) and total peripheral resistance (TPR) (b) before and after ingestion of fructose ( ), fructose at 30 g (fructose 30; ), glucose ( ) and sucrose ( ). Time 0 indicates the resumption of the recordings after the 4 min drink period. Values are means, with their stan-dard errors represented by vertical bars. Mean value was significantly different from that at baseline over time: * P, 0·05, ** P, 0·01, *** P, 0·005. †† Mean value was significantly different from that of the fructose drink (equivalent to the AUC) (P, 0·01). Mean value was significantly different from that of the fructose 30 drink (equivalent to the AUC): ‡‡ P, 0·01, ‡‡‡ P, 0·005. §§§ Mean value was significantly different from that of the sucrose drink (equivalent to the AUC) (P, 0·005). kkk Mean value was significantly different from that of the glucose drink (equivalent to the AUC) (P, 0·005).
British
Journal
of
sucrose (Fig. 3(b)). In contrast to fructose, sucrose and glucose increased SV and IC significantly over time (SV peak for sucrose: 5·3 ml, P, 0·005; glucose: 7·0 ml, P, 0·005; IC peak for sucrose: 4·5 £ 1000 per s, P, 0·005; glucose: 5·7 £ 1000 per s, P, 0·005; Fig. 4(a) and (b)). Ingestion of glucose increased SV more than the ingestion of fructose (60 and 30 g), whereas the IC was found to be higher with the inges-tion of glucose and sucrose than with the ingesinges-tion of both fructose drinks (Fig. 4(a) and (b)).
Microvascular function
There were no significant differences observed for ACh- and
sodium nitroprusside-mediated microvascular endothelial
flux between fructose, glucose and sucrose. Although, com-pared with pre-drink values, a tendency for fructose at 30 g to increase ACh-mediated vasodilation was observed (80 (SE 19) v. 103 (SE 17) arbitrary units, P ¼ 0·08; Table 2), these differences did not reach statistical significance.
Discussion
To our knowledge, this is the first study using beat-to-beat cardiovascular measurements to evaluate haemodynamic
consequences after ingestion of sucrose and its building blocks glucose and fructose at isoenergetic amounts, and at an amount of fructose equivalent to that present in sucrose (i.e. 30 g fructose). The results of the present study demon-strate that sucrose ingestion does not mimic the BP-elevating effect of fructose, independently of whether sucrose is com-pared with fructose at isoenergetic amounts (60 g each) or with fructose at an amount equivalent to that present in sucrose (30 g fructose v. 60 g sucrose); the haemodynamic responses and BP-elevating effects of fructose being similar whether provided as 60 g or as 30 g, and higher than with 60 g of either sucrose or glucose. Furthermore, the present study indicates no differences in haemodynamic responses to sucrose and glucose ingestion, and no differences in micro-vascular endothelial function in response to the various sugars ingested (glucose, fructose and sucrose). Taken together, the present results indicate that the glucose component of sucrose attenuates the acute fructose-induced elevation of BP in young and healthy human subjects.
Studies for the BP response to orally ingested sucrose in healthy human subjects are scarce. We chose the sugar content as 60 g (in 500 ml water) for the present study on the basis that this amount is commonly available in soft drinks, thereby mimicking a daily-life scenario. SBP increased with ingestion
Fructose Fructose 30 Glucose Sucrose Fructose Fructose 30 Glucose Sucrose 10 8 6 4 2 0 0 1 2 3 4 5 6 7 10 (a) (b) 8 6 4 2 0 ∆ SV (ml) ∆ IC (1000/s) ∆ SV (ml) ∆ IC (1000/s) –2 –4 –6 –30 –15 0 15 30 45 60 Time (min) 8 6 4 2 0 –2 –4 –30 –15 0 15 30 45 *** *** *** *** *** *** ***†‡ **†‡ ***†‡ * * * * * * *** *** ** *** 60 Time (min)
Fig. 4. Time course for changes in stroke volume (SV) (a) and index of contractility (IC) (b) before and after ingestion of fructose ( ), fructose at 30 g (fructose 30; ), glucose ( ) and sucrose ( ). Time 0 indicates the resumption of the recordings after the 4 min drink period. Values are means, with their standard errors represented by vertical bars. Mean value was significantly different from that at baseline over time: * P, 0·05, ** P, 0·01, *** P, 0·005. † Mean value was significantly different from that of the fructose drink (equivalent to the AUC) (P, 0·05). ‡ Mean value was significantly different from that of the fructose 30 drink (equivalent to the AUC) (P, 0·05).
British
Journal
of
of all sugars in the present study, with fructose showing the highest response (5 – 6 v. 1-3 mmHg for the other sugars). Furthermore, whereas ingestion of sucrose and glucose caused only a marginal or no change in DBP, ingestion of fructose increased DBP substantially (3 – 5 mmHg between 30 and 60 min post-drink). These results are consistent with our previous findings(7)for an elevated DBP value up to 120 min after ingestion of fructose but not after ingestion of glucose. Our findings, however, differ from Rebello et al.(18) who reported SBP to be elevated with sucrose and glucose but not with fructose 1 h after ingestion, and, furthermore, with no effect on DBP. In this latter study, the response to fructose should be interpreted with caution because all of their subjects experienced watery diarrhoea after ingestion of fructose (1 g/kg), most of them within 40 and 60 min post-drink. Furthermore, unlike in the present study in which we per-formed continuous measurement of BP, Rebello et al.(18) used a discontinuous oscillometric method to measure BP values. Another study by Visvanathan et al.(6) in elderly healthy individuals (72 years old on average) found SBP and DBP to be decreased after ingesting 50 g of either sucrose or glucose, whereas fructose ingestion showed no such decrease. Similarly, BP has been reported to fall slightly after ingestion of 75 g glucose but not after ingesting the same amount of fructose in elderly normotensive subjects(19).
A likely explanation for the discrepancy between the blunted BP response after ingestion of sucrose (60 g) and its elevation after ingesting either isoenergetic (60 g) or equival-ent (30 g) amounts of fructose can be derived by the actions of insulin. The observation of an increase in SV and CO and a decrease in TPR with ingestion of sucrose and glucose but not with ingestion of fructose in the present study is likely due to the action of insulin because insulin is known to increase dose-dependently CO by rising SV and HR and to decrease systemic vascular resistance(20). In the present study, the rise of CO with ingestion of glucose and sucrose was secondary due to an increase in SV with minor changes in HR, whereas fructose did not affect CO and SV. In contrast, ingestion of glucose and sucrose substantially decreased TPR, whereas a small increase in TPR was found after ingestion of
fructose. Therefore, it is likely that the actions of insulin were at least partly responsible for the aforementioned findings. Moreover, the differences for TPR in response to the ingestion of sugars in the present study fully account for the BP results. It can be speculated that the observed positive inotropy with glucose and sucrose but not fructose consumption could partly explain the accompanying rise in SV in the pre-sent study. Using radionuclide ventriculography, Fisher et al.(21) observed an immediate increase in inotropy in response to intravenous injection of insulin. In vitro exper-iments on human atrial myocardium found positive inotropic effects in response to insulin(22). However, the failure of two studies to find changes in inotropy in healthy human subjects after intravenous administration of insulin(23,24) calls for cau-tion in attributing the observed inotropy with glucose or sucrose consumption to changes in insulin alone.
We conducted microvascular endothelial function testing to investigate whether changes in BP following ingestion of sugary drinks are linked to endothelial dysfunction. Here, we found a trend (P¼ 0·08) towards an augmentation of endo-thelial function after ingestion of 30 g fructose with a non-sig-nificant increase after ingestion of fructose and sucrose. Ingestion of glucose resulted in a non-significant attenuation in ACh-mediated vasodilation. Bidwell et al.(10)assessed endo-thelial function using forearm blood flow measurements com-bined with reactive hyperaemia after acute ingestion of either a glucose or isoenergetic glucose – fructose (45:55, w/w) beverage and found no significant alterations in endothelial function. In line with the present results, they observed, 60 min after ingestion, a small non-significant difference between the glucose – fructose and glucose beverages(10), but the former tended to be higher. Based on the results, a contri-bution of microvascular endothelial function to the increase in BP after ingestion of fructose seems unlikely.
There are limitations in the present study. First, we cannot rule out the possibility that differences in perceived sweetness between the test drinks could have influenced the present results. However, we believe that the addition of 10 ml lemon juice to each drink minimised these differences in sweetness perception. Second, the primary focus of the Table 2. Microvascular endothelial function measurements before (pre-drink*) and after
(post-drink*) the ingestion of fructose at 60 g, fructose at 30 g, glucose at 60 g and sucrose at 60 g (Mean values with their standard errors)
Fructose (60 g) Fructose (30 g) Glucose (60 g) Sucrose (60 g)
Mean SE Mean SE Mean SE Mean SE
DACh-mediated vasodilation Pre-drink (PU) 70 20 80 19 87 19 69 13 Post-drink (PU) 96 19 103 17 73 23 80 16 P 0·2 0·08 0·47 0·49 DSNP-mediated vasodilation Pre-drink (PU) 78 22 76 17 72 12 75 16 Post-drink (PU) 91 21 91 15 94 12 72 9 P 0·65 0·3 0·13 0·86
ACh, acetylcholine; PU, perfusion units; SNP, sodium nitroprusside.
* Pre- and post-drink conditions were compared using either a paired t test or a Wilcoxon signed-rank test. P, 0·05 was considered as statistically significant.
British
Journal
of
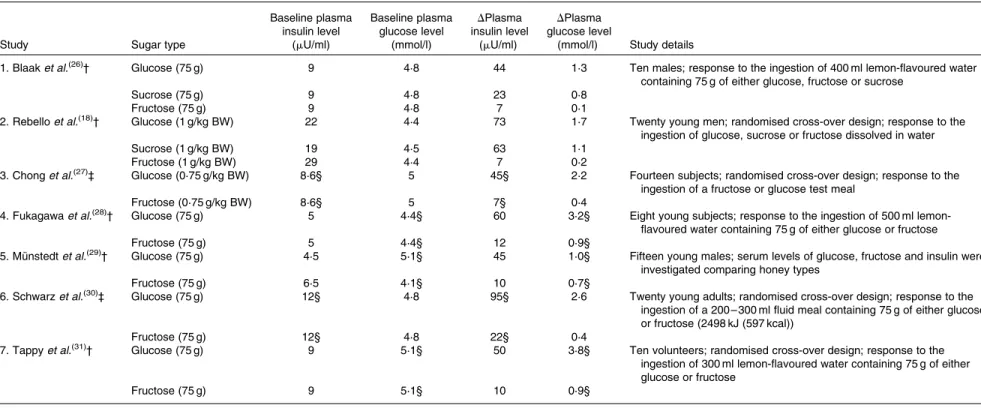
Table 3. Summary of the studies in which plasma insulin and glucose levels were reported before and at 60 min after ingestion of a sugary drink or a sugared fluid meal in healthy human subjects*
Study Sugar type
Baseline plasma insulin level (mU/ml) Baseline plasma glucose level (mmol/l) DPlasma insulin level (mU/ml) DPlasma glucose level
(mmol/l) Study details
1. Blaak et al.(26)† Glucose (75 g) 9 4·8 44 1·3 Ten males; response to the ingestion of 400 ml lemon-flavoured water
containing 75 g of either glucose, fructose or sucrose
Sucrose (75 g) 9 4·8 23 0·8
Fructose (75 g) 9 4·8 7 0·1
2. Rebello et al.(18)† Glucose (1 g/kg BW) 22 4·4 73 1·7 Twenty young men; randomised cross-over design; response to the
ingestion of glucose, sucrose or fructose dissolved in water
Sucrose (1 g/kg BW) 19 4·5 63 1·1
Fructose (1 g/kg BW) 29 4·4 7 0·2
3. Chong et al.(27)‡ Glucose (0·75 g/kg BW) 8·6§ 5 45§ 2·2 Fourteen subjects; randomised cross-over design; response to the
ingestion of a fructose or glucose test meal
Fructose (0·75 g/kg BW) 8·6§ 5 7§ 0·4
4. Fukagawa et al.(28)† Glucose (75 g) 5 4·4§ 60 3·2§ Eight young subjects; response to the ingestion of 500 ml
lemon-flavoured water containing 75 g of either glucose or fructose
Fructose (75 g) 5 4·4§ 12 0·9§
5. Mu¨nstedt et al.(29)† Glucose (75 g) 4·5 5·1§ 45 1·0§ Fifteen young males; serum levels of glucose, fructose and insulin were
investigated comparing honey types
Fructose (75 g) 6·5 4·1§ 10 0·7§
6. Schwarz et al.(30)‡ Glucose (75 g) 12§ 4·8 95§ 2·6 Twenty young adults; randomised cross-over design; response to the
ingestion of a 200 – 300 ml fluid meal containing 75 g of either glucose or fructose (2498 kJ (597 kcal))
Fructose (75 g) 12§ 4·8 22§ 0·4
7. Tappy et al.(31)† Glucose (75 g) 9 5·1§ 50 3·8§ Ten volunteers; randomised cross-over design; response to the
ingestion of 300 ml lemon-flavoured water containing 75 g of either glucose or fructose
Fructose (75 g) 9 5·1§ 10 0·9§
BW, body weight.
* Values for plasma insulin and glucose levels were either obtained from tables (Rebello et al.(18)and Mu¨nstedt et al.(29)) or estimated from figures (Blaak et al.(26), Chong et al.(27), Fukagawa et al.(28), Schwarz et al.(30)and Tappy
et al.(31)).
† Studies with sugary drinks. ‡ Studies with sugared fluid drinks.
§ Values were originally expressed as mU/ml (Blaak et al.(26), Rebello et al.(18), Fukagawa et al.(28), Mu¨nstedt et al.(29)and Tappy et al.(31)) or as pmol/l (Chong et al.(27)and Schwarz et al.(30)) for plasma insulin or as mmol/l
(Blaak et al.(26), Rebello et al.(18), Chong et al.(27)and Schwarz et al.(30)) and as mg/dl (Fukagawa et al.(28), Mu¨nstedt et al.(29)and Tappy et al.(31)) for plasma glucose. A conversion factor of 0·166 was used to convert pmol/l
to mU/ml and 0·0555 to convert mg/dl to mmol/l.
E. K. Grasser et al. 190
British Journal of Nutrition
.
https://doi.org/10.1017/S0007114514000622
https:/www.cambridge.org/core
. University of Basel Library
, on
30 May 2017 at 18:20:04
present study was on BP responses for which a power analysis indicated that a sample size of twelve subjects would be required to identify significant differences. However, the part of the present study assessing microvascular endothelial func-tions may not be sufficiently powered because of the large inherent variability in the measurements of microvascular functions. Consequently, our findings that there are no signifi-cant differences across the various drinks for these secondary outcome parameters should be taken with caution. Third, we did not measure insulin concentrations because we wanted to avoid taking blood samples that could influence subtle haemodynamic changes pertaining to venous cannulation(25). Furthermore, based on a literature search, we found compelling evidence that a sugary drink or a sugared fluid meal at compar-able amounts to those used in the present study raises plasma insulin and glucose levels substantially (Table 3) (18,26 – 31). Using a hyperinsulinaemic clamp approach in healthy human subjects, a recent study has found an improvement in skin and skeletal muscle microvasculature perfusion in response to reactive hyperaemia, suggesting that insulin influ-ences the microvasculature from the skin and skeletal muscle similarly(15). Therefore, in the present study, it seems plausible to refer the observed cardiovascular consequences after inges-tion of glucose and sucrose at least partly to insulin.
In conclusion, ingestion of a sugary drink containing 60 g sucrose seems unlikely to have an impact on BP in healthy young human subjects while isoenergetic amounts of fructose raised the BP substantially. Although sucrose comprises equivalent amounts of glucose and fructose, changes in TPR and CO are more related to glucose than to fructose. This is the first study to demonstrate that the BP-elevating effects of fructose are attenuated in the presence of glucose through a reduction in TPR.
Acknowledgements
The present study was funded in part by the Swiss National Science Foundation (project 3200B0-122554 to J.-P. M.).
The authors’ responsibilities were as follows: E. K. G. recruited the subjects, conducted the study, analysed and interpreted the data, and wrote the original draft of the manu-script; A. D. and J.-P. M. assisted in the interpretation of the data, provided critical intellectual feedback for the manuscript, and helped to write the manuscript. All authors planned the study.
The authors declare that there are no conflicts of interest.
References
1. Brown IJ, Stamler J, Van Horn L, et al. (2011)
Sugar-sweetened beverage, sugar intake of individuals, and their blood pressure: international study of macro/micronutrients and blood pressure. Hypertension 57, 695 – 701.
2. Chen L, Caballero B, Mitchell DC, et al. (2010) Reducing con-sumption of sugar-sweetened beverages is associated with reduced blood pressure: a prospective study among United States adults. Circulation 121, 2398 – 2406.
3. Jalal DI, Smits G, Johnson RJ, et al. (2010) Increased fructose associates with elevated blood pressure. J Am Soc Nephrol 21, 1543 – 1549.
4. Dhingra R, Sullivan L, Jacques PF, et al. (2007) Soft drink consumption and risk of developing cardiometabolic risk factors and the metabolic syndrome in middle-aged adults in the community. Circulation 116, 480 – 488.
5. Nguyen S, Choi HK, Lustig RH, et al. (2009) Sugar-sweetened beverages, serum uric acid, and blood pressure in adoles-cents. J Pediatr 154, 807 – 813.
6. Visvanathan R, Chen R, Garcia M, et al. (2005) The effects of drinks made from simple sugars on blood pressure in healthy older people. Br J Nutr 93, 575 – 579.
7. Brown CM, Dulloo AG, Yepuri G, et al. (2008) Fructose
ingestion acutely elevates blood pressure in healthy young humans. Am J Physiol Regul Integr 294, R730 – R737. 8. De Jongh RT, Serne´ EH, IJzerman RG, et al. (2004) Impaired
microvascular function in obesity: implications for obesity-associated microangiopathy, hypertension, and insulin resist-ance. Circulation 109, 2529 – 2535.
9. Serne´ EH, Stehouwer CDA, ter Maaten JC, et al. (1999)
Microvascular function relates to insulin sensitivity and blood pressure in normal subjects. Circulation 99, 896 – 902. 10. Bidwell AJ, Holmstrup ME, Doyle RP, et al. (2010) Assess-ment of endothelial function and blood metabolite status following acute ingestion of a fructose-containing beverage. Acta Physiol Scand 200, 35 – 43.
11. Brown CM, Barberini L, Dulloo AG, et al. (2005)
Cardio-vascular responses to water drinking: does osmolality play a role? Am J Physiol Regul Integr 289, R1687 – R1692.
12. Grasser EK, Goswami N & Hinghofer-Szalkay H (2009)
Presyncopal cardiac contractility and autonomic activity in young healthy males. Physiol Res 58, 817 – 826.
13. Kubicek WG, Patterson RP & Witsoe DA (1970) Impedance cardiography as a non-invasive method of monitoring car-diac function and other parameters of the cardiovascular system. Ann N Y Acad Sci 170, 724 – 732.
14. Fortin J, Habenbacher W, Heller A, et al. (2006) Non-invasive beat-to-beat cardiac output monitoring by an improved
method of transthoracic bioimpedance measurement.
Comp Biol Med 36, 1185 – 1203.
15. de Jongh RT, Clark ADH, Ijzerman RG, et al. (2004) Physio-logical hyperinsulinaemia increases intramuscular microvas-cular reactive hyperaemia and vasomotion in healthy volunteers. Diabetologia 47, 978 – 986.
16. Droog EJ, Henricson J, Nilsson GE, et al. (2004) A protocol for iontophoresis of acetylcholine and sodium nitroprusside that minimises nonspecific vasodilatory effects. Microvasc Res 67, 197 – 202.
17. Morris SJ & Shore AC (1996) Skin blood flow responses to the iontophoresis of acetylcholine and sodium nitroprusside in man: possible mechanisms. J Physiol 496.2, 531 – 542. 18. Rebello T, Hodges RE & Smith JL (1983) Short-term effects of
various sugars on antinatriuresis and blood pressure changes in normotensive young men. Am J Clin Nutr 38, 84 – 94.
19. Jansen RWMM, Penterman BJM, Van Lier HJJ, et al. (1987)
Blood pressure reduction after oral glucose loading and its relation to age, blood pressure and insulin. Am J Cardiol 13, 1087 – 1091.
20. Baron AD & Brechtel G (1993) Insulin differentially regulates systemic and skeletal muscle vascular resistance. Am J Phy-siol 265, E61 – E67.
21. Fisher BM, Gillen G, Dargie HJ, et al. (1987) The effects of insulin-induced hypoglycaemia on cardiovascular function in normal man: studies using radionuclide ventriculography. Diabetologia 30, 841 – 845.
British
Journal
of
22. von Lewinski D, Rainer PP, Gasser R, et al. (2010) Glucose-transporter-mediated positive inotropic effects in human myocardium of diabetic and nondiabetic patients. Metabolism 59, 1020 – 1028.
23. Airaksinen J, Lahtela JT, Ika¨heimo MJ, et al. (1985) Intrave-nous insulin has no effect on myocardial contractility or heart rate in healthy subjects. Diabetologia 28, 649 – 652. 24. Sasso FC, Carbonara O, Cozzolino D, et al. (2000) Effects of
insulin – glucose infusion on left ventricular function at rest and during dynamic exercise in healthy subjects and non-insulin dependent diabetic patients. J Am Coll Cardiol 36, 219 – 226.
25. Langham BT & Harrison DA (1993) The pressor response to venous cannulation: attenuation by prior infiltration with local anaesthetic. Br J Anaesth 70, 519 – 521.
26. Blaak EE & Saris WHM (1996) Postprandial thermogenesis and substrate utilization after ingestion of different dietary carbohydrates. Metabolism 10, 1235 – 1242.
27. Chong MFF, Fielding BA & Frayn KN (2007) Mechanisms for the acute effect of fructose on postprandial lipemia. Am J Clin Nutr 85, 1511 – 1520.
28. Fukagawa NK, Veirs H & Langeloh G (1995) Acute effects of fructose and glucose ingestion with and without caffeine in young and old humans. Metabolism 44, 630 – 638.
29. Mu¨nstedt K, Bo¨hme M, Hauenschild A, et al. (2011) Con-sumption of rapeseed honey leads to higher serum fructose levels compared with analogue glucose/fructose solutions. Eur J Clin Nutr 65, 77 – 80.
30. Schwarz JM, Schutz Y, Froidevaux F, et al. (1989) Thermo-genesis in men and women induced by fructose vs glucose added to a meal. Am J Clin Nutr 49, 667 – 674.
31. Tappy L, Randin JP, Felber JP, et al. (1986) Comparison
of thermogenic effect of fructose and glucose in
normal humans. Am J Physiol Endocrinol Metab 13, E718 – E724.