On the relationship between sweet taste and seasonal body
weight changes in a primate (Microcebus murinus)
G.Hellekant, C.M.Hladik1, V.Dennys1, B.Simmen, T.W.Roberts and D.Glaser2
University of Wisconsin, Department of Animal Health and Biomedical Sciences, and Wisconsin Regional Primate Center, Madison, WI 53706, USA, 'Laboratoire D'Ecologie Generate, 4 Avenue de Petit Chateau, 91800 Brunoy, France and 2Anthropological Institute, University of Zurich-Irchel,
Switzerland
Abstract. The relationship between obesity and taste, especially sweet taste, has been and is of interest.
From this point of view of a small primate, the lesser mouse lemur (Microcebus murinus), is of particular interest. It goes through a yearly cycle of physiological changes, one of which is an extreme variation in body weight of up to 100%. This occurs concomitantly with significant changes of the animal's liking for sucrose; measured by two-bottle preference tests, the threshold for sucrose changes from 2 8 - 4 5 in lean to 77-105 mM in obese animals. It is possible that a change in peripheral taste sensitivity might be the cause for these preference changes. To test this possibility we studied the ability of M. murinus to taste sucrose with electrophysiological and conditioned taste aversion techniques. The electrophysiological recordings were obtained from the chorda tympani proper nerve in two heavy and three lean animals. We did not record any difference between the two groups in their neural response to a series of sucrose concentrations. Condi-tioned taste aversion experiments with 200 mM sucrose as conditioning stimulus and 50 and 200 mM sucrose as test stimuli gave similar results. No difference was found between three heavy and four lean animals; both groups rejected the sucrose concentrations. The results support the notion that the seasonal variations in preference threshold to sucrose were unrelated to the ability of M. murinus to taste sucrose.
Introduction
The relationship between the sense of taste and food intake, especially with regard to obesity, has been the topic for many studies, but with conflicting results (Grinker et al., 1972; Rodin et al., 1976; Malcolm et al., 1980; Frijters and Rasmussen-Conrad, 1982). In this context a small Madagascan primate, the lesser mouse lemur (Microcebus
murinus), is of interest since it goes through extreme seasonal variations. Some animals
double their body weight concomitant with changes of the animal's diet from a more insectivorous to a more fructivorous diet.
The pattern of body weight changes can also be maintained in captivity by variation in length of light (Petter-Rousseaux, 1980). This allows the closer study of the seasonal changes in M.murinus. As a result, Simmen and Hladik (1988) observed in two-bottle preference (TBP) tests that the threshold for sucrose was between 28 and 45 mM when the animals weighed less, and 77-105 mM when they weighed more. The difference was significant (P < 0.02) and raised the question whether the threshold changes were caused by a change in peripheral taste sensitivity or were attributable to some other factor. A change in peripheral taste sensitivity is a possibility to be considered. Perret (1985) described a cyclic variation of the plasma testosterone level which precedes the change of body weight in M.murinus. Allara (1952) and Zalewski (1969a,b) found that the level of testosterone in the rat can influence the number and distribution of taste buds.
Recent observations in humans (Miller and Reedy, 1990) and rats (Miller, 1991) indicate that the number of taste buds affects the taste sensitivity. Data by Contreras and Frank (1979) indicate that the taste response in the chorda tympani proper (CT) nerve can be affected by changes of the internal environment. Thus, it is possible that the cycle of M.murinus may effect its peripheral taste sensitivity. This makes it pertinent to test its taste sensitivity to sucrose.
In the following we present results of electrophysiological recordings from the CT as well as behavioral experiments with the conditioned taste aversion (CTA) paradigm in M.murinus. Our results indicate that the ability of M.murinus to taste sucrose does not vary with the season.
Materials and methods
Animals
The animals were from a colony of M.murinus kept on an artificial cycle of 8 months of long days/short nights and 4 months of short days/long nights (Petter-Rousseaux,
1980) at the Laboratoire d'Ecologie Generale, Brunoy, France.
Electrophysiology
Recordings from the centrally cut CT nerves were obtained from two animals belonging to the heavy weight group, weighing 122 and 102 g, and three belonging to the light group, weighing 60, 77 and 81 g each.
Surgery
Anesthesia was initiated with 5 mg ketamine and 0.5 mg acepromazine i.m. Half an hour later 0.1 ml of pentobarbital sodium diluted to 13.5 mg/ml was injected i.m. The pentobarbital dose was repeated about every hour or when needed. Isotonic 5% glucose solution was administered s.c. in a dose of 1 ml/h of anesthesia as fluid replacement. Tracheostomy was performed and a polyethylene catheter was inserted between two cartilages of trachea to improve respiration during taste stimulation. At the end of the experiment the catheter was removed and the wound closed with 10-0 nylon suture. The heart rate was continuously monitored.
The right CT nerve was approached through an incision along the mandibular angle between the rostral lobes of the parotid gland and the mandibular bone. The tissue attached to the mandibular angle was then sectioned, followed by blunt dissection to the CT nerve along the caudo-medial side of the pterygoid muscle down to its origin at the pterygoid plate of the skull. The nerve enters the bulla tympani close to the lateral face of the medial pterygoid muscle. It is surrounded by a small amount of fatty tissue and can be freed peripherally until it joins the lingual proper nerve. In three animals the nerve was embedded in the muscle, while in the other two it was found lateral to the muscle. After the recording period, the wound was closed with 5-0 ethilon and the animals allowed to recover.
Recording apparatus
The overall nerve impulse activity was recorded between a silver wire in contact with the nerve and a silver plate connected to the wound. The nerve impulses were amplified
with a PAR 113 amplifier, monitored over a loudspeaker and an oscilloscope, and fed into a recorder (Gould ES 2000). They were also integrated using an absolute value circuit integrator. The type of stimulus used and the stimulus duration were recorded as a binary coded signal on the recorder. In addition an IBM PC-AT with a DAS-Keithley interface was used for storing and numerical processing of each response (Hellekant
etal, 1991).
Stimulation apparatus
The surface of the tongue was stimulated with a portable version of our 'Taste-O-Matic' system (Hellekant et al., 1980). It delivers 12 solutions at given intervals over a predeter-mined time and under conditions of constant flow and temperature. The interval between each stimulation was 36 s. Each stimulation lasted for 6 s.
Test substances and procedure
The tongue was stimulated with 10, 20, 30, 42, 70, 100 and 300 mM sucrose, 2.2 mM dulcin, 40 mM citric acid and 100 mM NaCl. We repeated the sequence of stimuli at least three times in each animal. Artificial saliva was used to rinse the tongue between stimulations (Hellekant et al., 1985). All compounds were made up in artificial saliva.
Conditioned taste aversion test
The CTA tests were performed in seven animals divided into two groups, two heavy and two lean, and one heavy and two lean respectively, in July 1988 and July 1989. Sucrose solution, 200 mM, was used as conditioning stimulus. It was offered in the animals' normal food device, which consisted of a plastic tray with six compartments around a central cup. Within 5 min after consumption of ~ 1 ml of the sucrose solu-tion, 1.5 ml/100 g body wt of 0.24 M LiCl was injected i.p. and the animals were left to recover. During the tests the animals were offered 50 and 200 mM sucrose and water for 20 min in the same devices and their consumption of each solution measured. The results were the same in both groups. However, since the circumstances with regard to the time for the experiment, presentation of solutions, etc. were not identical, the numerical data reported here are from the latter group.
Results
The chorda tympani nerve response to sucrose
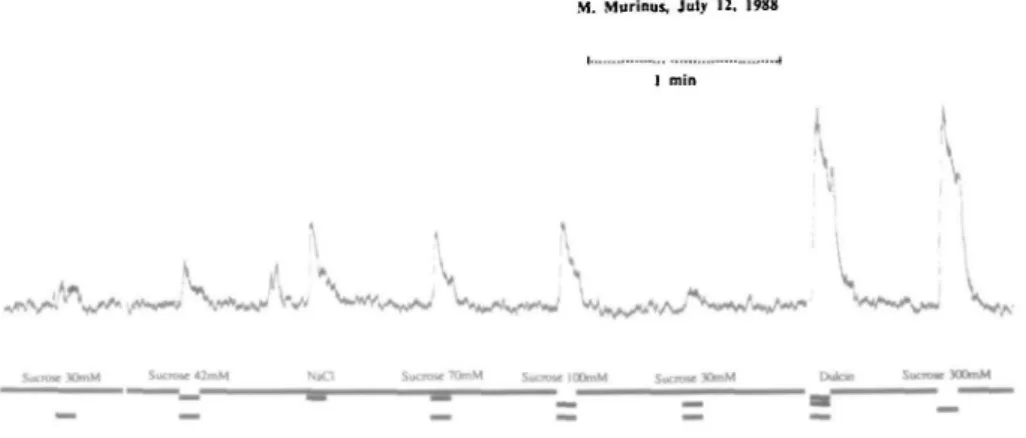
Figure 1 shows summated responses recorded from the CT nerve to a series of sucrose concentrations ranging from 30 to 300 mM. The recording was obtained from one of the animals in the heavy group, which had a threshold > 70 mM sucrose in the earlier two-bottle preference tests. Figure 1 demonstrates that 30 mM sucrose elicited a neural response which grew with increasing concentration. Ten millimolar sucrose did not elicit a response. The double peak, immediately before the responses to NaCl, was the result of mechanical stimulation of the tongue as a control of the recording.
The diagram in Figure 2 depicts the relationship between concentration of sucrose in log scale and maximum response elicited. The squares represent heavy animals and the circles light ones. The maximum response amplitudes, normalized to the response to NaCl, were used. Figure 2 shows that while 30 mM concentration elicited a response
M. Murinus, July 12, 1988
viv Vs
-, \
SUCTO* 30mM Sueiwe 42mM N*C1 S u c r e * TOmM Sucmc lOftnM Sucnne K k n M
Fig. 1. Summated CT nerve recordings during stimulation with, from the left: 30 and 42 mM sucrose; 100 mM NaCl; 70, 100 and 20 mM sucrose: Dulcin; and 300 mM sucrose. The nerve activity was recorded while the flow over the tongue was switched between artificial saliva and the stimuli as indicated.
Microceb Sucrose Concentration Plot (log scale)
I
i
too-1.2 1.4 1 6 1 6 2 0 2 2 2 4 2 6
Lot SOCTMC ComMraliai (MM)
Fik:M*croccb:SucrD*e.nnn2
Fig. 2. The relationship between concentration of sucrose and neural response has been plotted for two animals from each group. The response amplitudes for each solution have been calculated using the response to NaCl as the standard. The squares represent the heavy group and the circles the light one. It is apparent that there was no difference between the groups.
in one animal, 42 mM and stronger concentrations elicited a response in all animals. There was no significant difference in amplitude of the responses between the lean and heavy group. A statistical analysis using non-normalized data support this conclusion
(P > 0.88, two-way ANOVA).
not be included in Figure 2. However, the results of the summated recordings were similar to those in Figure 1; a response that grew with the concentration of sucrose.
The results of conditioned taste aversion tests
By observing the animals in both groups it was clear that, after conditioning, the animals avoided the sucrose solutions. Because we changed the approach in the first group during the measurements we did not report any numerical analysis from the data of the first group. In the second group the average intake of water was 1.37 ml/day/animal, 0.09 ml of 200 mM sucrose, and 0.04 ml of 50 mM sucrose. The Mest applied to the data from this group gave a P-value of < 0.002 for 200 mM sucrose and <0.05 for the 50 mM sucrose solution (number of measurements = 32, paired sample Mest applied to the difference between solution and water). Thus, the conclusion from the elec-trophysiological experiments, that the heavy animals had the same ability to taste sucrose as the lean ones, is supported by the results of the CTA tests.
Discussion
The electrophysiological recordings show that all animals were able to taste at least 42 mM sucrose. The CTA tests demonstrate that they used this ability to avoid 50 mM sucrose. Consequently, a change in ability to taste 77 — 105 mM sucrose is not the cause for the differences between the groups observed in the earlier TBP study (Simmen and Hladik, 1988). In the following we discuss factors that may influence this conclusion. It is unlikely that our results were related to obliteration of the yearly cycles of
M.murinus. In its natural habitat, its changes of body weight follow the yearly cycle
of food production, from an insectivorous to a fructivorous diet (Hladik et al., 1980), and is synchronized and maintained by variation of the length of daylight (Petter-Rousseaux, 1980). In captivity, the yearly cycle of food changes is not maintained. Instead, the animals are kept on a standard array of foods. Furthermore, the yearly light cycle is shortened to a total of 8 months: 4 months of 12 h and 4 months of 8 h artificial daylight. However, as documented by several studies (cf. Hladik et al., 1980; Petter-Rousseaux, 1980; Perret, 1985), this artificial cycle can mimic and maintain the natural cycle. During this study the large differences between the two groups in weight, as well as agility, demonstrated repeatedly that we were recording from animals in the two different phases. Consequently, we do not think that our results were related to an obliteration of these yearly cycles.
On the other hand, the cycle affected our behavioral and electrophysiological experiments. Microcebus murinus is a nocturnal species. The animals were most active during the last hour, before the onset of the daily light cycle. We found this particularly important in the heavy group, in which the general passivity of the animals forced us to perform the behavioural experiments during the last hour of the dark period, at around 01.00 h. In the electrophysiological study, their endocrinological status as well as the amount of fat tissue influenced the anesthesia, the surgery and the post-surgery recovery. It can be suggested that the number of animals used was too low to allow the conclu-sions drawn here. However, M.murinus is listed as endangered by the USDI (Nowak 1991) and, although we used animals bred at Laboratoire d'Ecologie Generale, the supply was very limited. There were several reasons for this, one being that, although the
surgical procedure used here allows survival of the animal and has been successfully applied in other primates for more than 12 years, any surgery is precarious. It was aggravated by the fact that in M.murinus, there was no information available on anesthesia, anatomy of the region where the CT can be expected to be found, or ability to withstand surgery. Finally, the size of the animals constituted an additional risk.
Microcebus murinus, together with M.rujus are the world's smallest primates (Nowak
1991). As a consequence, few animals were available. However, the electrophysiological data were consistent and corroborative with the behavioural results. The CT recordings in the heavy group showed a taste response to sucrose at concentrations found to be below or at behavioral threshold in the lean group. The inevitable conclusion is that the heavy animals did taste the lowest concentrations of sucrose used in the earlier TBP tests (Simmen and Hladik 1988). The possible input from other taste nerves does not affect this conclusion.
A matter of possible concern is that the response to sucrose in each animal was normalized with its response to NaCl. This was done to avoid the influence of factors related to the recording conditions; to be able to compare animals. If the response to NaCl also showed a cyclic variation, then no differences would be found between the groups with regard to their response to sucrose. This was not the case and, to our knowledge, the taste sensitivity to salt in M.murinus is not affected by the seasonal changes. Furthermore, the use of the response to acid as a standard did not change the results. It should also be noted that values from non-normalized nerve responses were used for the ANOVA analysis and that both groups tasted 42 mM sucrose, which support the finding that there was no significant difference between the groups.
Finally, it should be stated that this study does not show that there is no seasonal variation in the peripheral sense of taste in M.murinus. An answer to that question would require a more extensive study and it is doubtful that a final conclusion could be reached. It does show, however, that the difference between obese and lean animals found by Simmen and Hladik (1988) was not caused by an absence of taste to the sucrose concen-trations used.
Acknowledgement
The authors are indebted to Drs M.Perret and Petter-Rousseaux for the use of the animals and to Mr A.Tsang for statistical analysis.
References
Allara.E. (1952) Sull'influenza esercitata dagli ormoni sessauli sulla stuttura dell formazioni gustative di mus rattus albinus. Riv. Biol., 44, 209-229.
Contreras.R.J. and Frank.M.E. (1979) Sodium deprivation alters neural responses to gustatory stimuli. J.
Gen Physiol., 73, 569-594.
Frijters.J.E.R. and Rasmussen-Conrad,E.L. (1982) Sensory discrimination, intensity perception, and affec-tive judgment of sucrose-sweetness in overweight. /. Gen. Psychol., 103, 233-247.
Grinker.J.A., Hirsch.J. and Smith,D.V. (1972) Taste sensitivity and susceptibiltiy to external influence in obese and normal weight subjects. J. Perspea. Soc. Psychol., 22, 320-325.
Hellekant.G., Aronson.T. and Karlboum,U. (1980) Neural (electro-physiological) methods in chemorecep-tion research. J. Anim. Physiol. Anim. Nutr. Suppi, 11, 2 1 - 2 6 .
Hellekant.G., Hard af Segerstad.C, Roberts.T., van der Wel.H., Brouwer,J.N., Glaser.D., Hayes.R.J. and Eichberg,J.W. (1985) Effects of gymnemic acid on the chorda tympani proper nerve responses to sweet, sour, salty and bitter taste stimuli in chimpanzee. Ada Physiol. Scand., V2A, 339-408.
Hellekant.G., Walters,E. Culberson,C, DuBois.G., Nofre,C. and Tinti,J.M. (1991) Electrophysiological evaluation of sweeteners. In DuBois.G.E., Walters,E. and Orthoefer.F.T. (eds), Sweeteners: Discovery, Molecular Design, and Chemoreceprion, ACS Symposium series 450. American Chemistry Society, Washington, DC, pp. 2 9 0 - 3 0 1 .
Hladik.C.M., Charles-Dominique,P. and Petter,J.J. (1980) Feeding strategies of five nocturnal prosimians in the dry forest of the west coast of Madagascar. In Charles-Dominique,P., Cooper.H.M., Hladik,A., Hladik.C.M., Pages,E., Pariente.G.F., Petter-Rousseaux,A., PetterJ.J. and Schilling.A. (eds), Nocturnal Malagasy Primates. Ecology, Physiology, and Behavior. Academic Press, New York, pp. 4 1 - 7 3 . Malcolm.R., O'Neil.P.N., Hirsch.A.A., Currey.H.S. and Moskowitz,G. (1980) Taste hedonics and thresholds
in obesity. Int. J. Obes., 4, 203-212.
Miller,I.J. (1991) Sucrose intake behavior is related to taste bud distribution in Fischer-344 rats. AChemS 1991. Abstract. 19.
Miller,I. and Reedy,F.E. Jr. (1990) Variations in human taste bud density and taste intensity perception. Physiol. and Behav., 47, 1213-1219.
Nowak.R.M. (1991) Walker's Mammals of the World, 5th edn. pp. 4 1 2 - 4 1 3 .
Perret.M. (1985) Diurnal variations in plasma testosterone concentrations in the male lesser mouse lemur (Microcebus murinus). J. Reprod. Fen., 74, 205-213.
Petter-Rousseaux,A. (1980) Seasonal activity rhythms, reproduction, and body weight variations in five sympatnc nocturnal prosimians, in simulated light and climatic conditions. In Charles-Dominique,P., Cooper,H.M. and Hladik,A. (eds), Nocturnal Malagasy Primates. Ecology, Physiology, and Behavior. Academic Press, New York pp. 137-152.
Rodin.J., Moskowitz,H.R. and Bray,G. A. (1976) Relationship between obesity, weight loss and taste respon-siveness. Physiol. Behav., 17, 591-597.
Simmen.B., Hladik,C.M. (1988) Seasonal variation of taste threshold for sucrose in a prosimian species, Microcebus murinus. Folia Prim., 51, 152 — 157.
Zalewski.A.A. (1969a) Neurotrophic-hormonal interaction in the regulation of taste buds in the rat's vallate papula. /. Neurobiol., 1, 123-132.
Zalewski,A.A., (1969b). Combined effects of testosterone and motor, sensory, or gustatory nerve reinner-vation on the regeneration of taste buds. Exp. Neurol., 24, 285 — 297.