Landscape Composition Has Limited
Impact on Local Genetic Structure in
Mountain Clover, Trifolium montanum L.
T
homash
ahn, C
hrisJ. K
eTTle, J
abouryG
hazoul, e
rnesTi. h
enniG,
anda
ndrear. P
luess Department of Environmental Systems Science, From the Institute of Terrestrial Ecosystems, Ecosystem Management, ETH Zurich, 8092 Zurich, Switzerland.Address correspondence to Thomas Hahn at the address above, or e-mail: [email protected]. Data deposited at Dryad: http://dx.doi.org/10.5061/dryad.s0885
Abstract
Semi-dry grasslands in the European Alps have been increasingly fragmented over the last 150 years. Few studies have investigated the implications of landscape configuration for genetic structure and gene flow among remnant habitat patches. Conservation management of semi-dry grassland plants rarely accounts for possible effects of major landscape elements, such as forest patches, as barriers to gene flow and dispersal via seed and pollen, despite their potential importance for biodiversity conserva-tion. Using 1416 individuals from 61 sampling sites across 2 valleys in South-Eastern Switzerland and Amplified fragment length polymorphism (AFLP) fingerprints, we applied a spatial strip and a circle approach to determine the impact of different land-scape elements on genetic differentiation in the semi-dry grassland herb Trifolium montanum (mountain clover). Overall genetic differentiation among sampling sites was low (overall FST = 0.044). Forest area had no effect on gene flow at the landscape scale, but area of semi-dry grassland, the potential habitat of T. montanum, road area, and altitude influenced genetic differentiation among sampling sites. The observed pattern of genetic differentiation suggests that a future increase in forest area, due to land use abandonment, at least in the short term, are unlikely to directly impact patterns of genetic variation in T. montanum.
Key words: AFLP, fragmentation, gene flow, landscape genetics, semi-dry grasslands
For millennia, the mountainous regions of Central Europe have been used for grazing livestock and mowing. Vast areas of semi-dry grasslands below timber line have thus been created by man (Stöcklin et al. 2007). These ecosystems are prominent hot spots of species diversity in the European Alps (Wolkinger and Plank 1981). Due to land use intensification (Stoate et al. 2001) and land use abandonment (Gellrich et al. 2007), the overall area of semi-dry grasslands has declined by 90% during the last 60 years in Switzerland. This trend is continuing and will lead to further habitat fragmentation (Bätzing 2005). Until now, little is known, however, about the potential effect of the ongoing habitat frag-mentation of semi-dry grasslands on patterns of genetic vari-ation among the remnant fragments. In particular, the role of different landscape elements for genetic differentiation is still unclear for many species. Understanding the mechanisms shap-ing patterns of gene flow within characteristic plants of semi-dry grasslands is essential to improve management planning. This is especially the case, with respect to genetic impoverish-ment and inbreeding, which may limit a species ability to adapt.
Habitat fragmentation can reduce population size and increase spatial isolation, with potentially severe impact for
population genetic diversity and viability in the long term (Ledig 1992). Decreasing population size reduces effective population sizes, increases drift and might enhance inbreed-ing effects (Gilpin and Soule 1986) if gene flow is restricted. Spatial isolation of habitat patches has the potential to reduce seed flow among habitat remnants (Herrera and Garcia 2010; McConkey et al. 2012). In addition, species, which are ani-mal pollinated and self-incompatible, face a particular risk of genetic isolation due to reduced pollen flow among isolated habitat patches (Aguilar et al. 2006). Semi-dry grasslands and their constituent species may be especially sensitive to pro-cesses such as climate change and land use change leading to local extinction (Körner 2003; Stöcklin et al. 2007).
Gene flow at landscape scale can counteract genetic drift and maintain genetic diversity (Whitlock and McCauley 1999; Richards 2000). Propagule dispersal is often critical to maintain meta-population dynamics (Hanski 1998). Spatially isolated habitat fragments might be well connected via long-distance seed (Poschlod et al. 1998) or pollen disper-sal (Janzen 1971). Pollination patterns within the landscape might be complex and vary with respect to pollinator species Advance Access publication September 24, 2013
(Steffan-Dewenter et al. 2002; Ghazoul 2005), resource avail-ability (Beekman and Ratnieks 2000; Carvell et al. 2012; Leonhardt and Blüthgen 2012), and landscape structure (Jauker et al. 2009; Hennig and Ghazoul 2012).
Little is known so far about how landscape elements affect genetic structuring in semi-dry grassland herb species. Even though numerous studies have investigated gene flow pat-terns among forest fragments (Smouse and Sork 2004; Sork and Smouse 2006; Smulders et al. 2009), the effects of forests on gene flow among grassland patches are largely unknown. As forest areas are among the most abundant landscape ele-ments in Alpine regions, they might be highly relevant for gene flow patterns within grassland plants at landscape scale. Forests may potentially hinder the movement of pollinators associated with grasslands (Roland et al. 2000; Schmitt et al. 2000) or other habitat types (Keller et al. 2012). For potential seed dispersal vectors of grassland species like red deer, for-ests might be hindering gene flow (Pérez-Espona et al. 2008). On the opposite, larger areas of semi-dry grassland habitats between focal fragments might enhance gene flow, as shorter seed and pollen dispersal distances can connect populations or subpopulations. Likewise, higher local densities might lead to larger gene pools causing more gene flow and less genetic differentiation among sites. In trees, higher local densities can increase long-distance gene flow and decrease genetic differ-entiation (Ismail et al. 2012). Among the most relevant linear landscape elements are roads, which frequently affect func-tional connectivity in animals, some of which are potential seed or pollen dispersal vectors (Holderegger and Di Giulio 2010). For example, for bumblebees, roads might reduce for-aging distances (Bhattacharya et al. 2003).
In addition to landscape elements, particularly in Alpine landscapes, altitudinal distances among populations can affect genetic differentiation in semi-dry grassland plants. For example, differences in altitude might lead to reduced pollen movement across altitudes due to distinct flowering times (Hülber et al. 2010). Varying time in snowmelt can lead to substantially restricted gene flow even over small spatial scales (Hirao and Kudo 2008). Further, changing resource availabilities at different altitudes might cause changes in pol-linator communities (Arroyo et al. 1985), which could affect pollen transport among altitudes. The potential of the alti-tudinal gradient to impact the distribution of genetic varia-tion within and among plant populavaria-tions is probably highly complex and variable among species (Ohsawa and Ide 2008; Byars et al. 2009; Hahn et al. 2012).
Understanding how landscape elements influence the pat-terns of genetic diversity in plant species at landscape scale is of interest not only for understanding the evolutionary consequences of land use change but also for management of ecosystems, particularly in the context of rapid climate change (Smulders et al. 2009). In this study, we combined genetic fingerprinting and geographic information system techniques in a landscape genetics approach (Manel et al. 2003), inferring effects of landscape elements on genetic structuring in Trifolium montanum. We applied and compared 2 different spatial approaches to investigate landscape char-acteristics, which potentially affect historic gene flow in this
species. First, we focused on the area between sampling sites using a strip approach, which assumes a straight-line connection between populations via gene flow and allows exploring landscape characteristics between sampling sites (Emaresi et al. 2011). The appropriate test for multiple regression of distance matrices in the strip approach still remains a debated topic due to interdependences (Raufaste and Rousset 2001; Castellano and Balletto 2002; Legendre and Fortin 2010). Moreover, it models straight-line connec-tions of gene flow among sampling sites, which might not be realistic. Given the debate on strip approaches, we used additionally a second method focusing on the landscape ele-ments surrounding the sampling sites (circle approach). In contrary to the strip approach, the data in the circle approach are truly independent, and the analyses does not account for the direction of gene flow. Moreover, it is well established in landscape ecological studies (Steffan-Dewenter et al. 2002; Taki et al. 2007; Hennig and Ghazoul 2011; Ockinger et al. 2012), yet rarely used to explain genetic differentiation of populations in plants (but see Schmidt et al. 2009).
Specifically, we tested the following hypotheses: 1) Forest areas act as a barrier to gene flow, leading to increased genetic structure between sampling sites. 2) Area of semi-dry grass-land leads to increased gene flow and thus lower differentia-tion among sampling sites. 3) Higher local individual density causes increased gene flow and thus lower differentiation among sampling sites. In addition, we investigated the poten-tial influence of paths and roads, geographic distance, altitu-dinal distance among sampling sites, and absolute altitude of the sampling sites on genetic differentiation at landscape scale.
Materials and Methods
Study Species, Sampling Sites, and Sampling Design
Trifolium montanum (Fabaceae) is a perennial clover species, mainly found in semi-dry Mesobromion erecti grasslands below the timber line, but it also occurs at forest edges (Oberdorfer et al. 1994). The species relies on continuous, extensive man-agement (Delarze et al. 1999; Schleuning et al. 2009). Trifolium montanum flowers from May to July (Aeschimann et al. 2004), and hand pollination experiments indicated that the plant is predominantly outcrossing (Schleuning and Matthies 2009). The species is primarily pollinated by bumblebees and bees (Oberdorfer et al. 1994; Schleuning and Matthies 2009). Seed dispersal is mainly bariochorous, and thus restricted to short distances (Schleuning et al. 2009).
We sampled 61 sites within 2 valleys in South-Eastern Switzerland (Canton of Graubünden): 30 in “Val Lumnezia” (VL) and 31 in “Hinterrheintal” (HR; Figure 1, Supplementary Table S1). The valleys are separated by approximately 10 km distance. An analysis of potential sampling sites, based on the Swiss inventory of dry- and semi-dry grassland areas (BAFU 2006), suggested 80 and 149 potential sampling sites in VL and HR, respectively. Sampling sites were then chosen to reflect a wide variety of percentages of forest surround-ing individual sites (i.e., sites without adjacent forests up to sites, completely surrounded by forest). Sampling sites were
moreover selected relatively evenly along the altitudinal gradi-ent. The chosen sampling sites covered minimum convex pol-ygon areas of 63.2 and 67.9 km2 in VL and HR, respectively, estimated with Hawth’s Analysis Tools 3.27 in ArcGIS 9.3.1. Altitudinal range of sampling sites was from 890 to 2066 m a.s.l. in VL and from 682 to 1920 m a.s.l. in HR. Minimal and maximal distances between sites within valleys were 0.44 and 11.11 km in VL and 0.52 and 11.50 km in HR, respectively.
At each sampling site, leaf material was collected from 24 individuals, with distances between individuals of 0.5–40 m. The spatial sampling scheme was, whenever possible, regularly within a rectangular grid of 10 × 25 m, where 22 samples were taken. In addition, 2 samples were taken at dis-tances of approximately 20 m apart from the sampling grid. Leaf material was immediately dried in silica gel for subse-quent DNA extraction.
Centroid coordinates of sampling sites were recorded with a GPS (Garmin 60CSx), and the absolute altitude of the sampling sites was inferred from the high-resolution digital elevation model swissALTI3D (Swisstopo©, 0.5 m accuracy, <2000 m a.s.l.). To assess the density (individuals per m2) of T. montanum per site, we counted the number of T. montanum individuals in 10 randomly chosen 1-m2 plots within each sampling grid. The numbers of individuals and thus their density per m2 were averaged within sampling sites.
Characterization of Landscape Elements
To understand the general composition of landscape ele-ments in our study areas, we extracted the landscape eleele-ments forest, open agricultural land, the network of roads (includ-ing paths), and nonvegetated area from the digital landscape
model VECTOR25 (Swisstopo©, 3–8 m accuracy). The open agricultural land data include the habitat of our focal plant, which was determined via the spatial information of the Swiss inventory of dry- and semi-dry grassland areas (BAFU 2006). For the assessment of the influence of landscape elements on gene flow, we focused on the coverage of forest (Figure 2), semi-dry grassland, and roads because these elements were considered to be potentially relevant for gene flow via insect pollination and seed dispersal (animal or anthropogenic).
For the strip approach, polygons of forest and semi-dry grassland were first converted to raster data (10-m cell size). The widths of roads were enlarged by a factor of 10 and converted to raster data sets with cell sizes of 5 m, thus circumventing technical limitations of ArcGIS 9.3.1 with raster data of small cell size. Subsequently, we calculated the percentages of forest, roads, and semi-dry grassland area pairwise between all sampling sites per valley within straight-line strips (Emaresi et al. 2011; Keller et al. 2012) of 110, 210, 410, and 810 m widths. Calculations were car-ried out with Frictionnator 1.9.6.56, which requires irregular numbers for input strip widths (Hirzel A.H. & Fontanillas P. unpublished data; available at: http://www.unil.ch/bio-mapper/frictionnator/frictionnator.html). In addition, we calculated geographic and altitudinal distances between sampling sites.
For the circle approach, we calculated percentages of for-est, semi-dry grassland, and roads in circles around each sam-pling site with radii of 100, 200, 400, and 800 m. For each sampling site, we calculated the average geographic distance to all other sampling sites within the same valley.
AFLP Analyses
Out of 20 Amplified fragment length polymorphism (AFLP) primer combinations, which we tested, we chose 4 with the highest number of polymorphic loci and the highest repro-ducibility of AFLP fragments. The fluorescence-labeled (Applied Biosystems, Foster City, CA) EcoRI- and nonla-beled MseI-primers were AGG(FAM)/CTA, ACC(VIC)/
CTA, AAC(NED)/CAA, and ATG(PET)/CTG.
AFLP analyses were performed as described by Hahn et al. (2012), and fragment analyses were performed on an automated capillary sequencer (ABI Genetic Analyser 3730; Applied Biosystems). Only those individuals with loci derived of all AFLP primer combinations were included in the final analyses (16–24 per site with an average of 23.2 per site; Ntotal = 1416; Supplementary Table S1). AFLP frag-ments between 50 and 500 bp were binned in Genemapper 3.7 (ABI), and peak heights were exported for semiauto-matic genotyping with AFLPScore 1.4 (Whitlock et al.
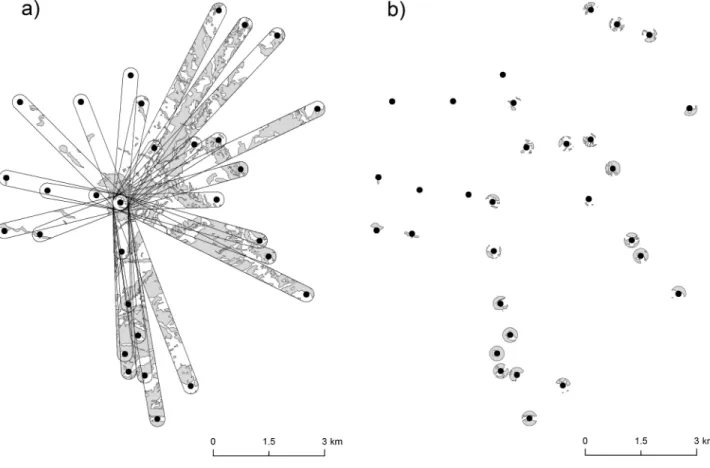
Figure 2. Example of the 2 methods used to model the effect of landscape elements on genetic differentiation in Trifolium montanum: (a) strip approach and (b) circle approach. (a) Shows the distribution of forest in all pairwise buffer strips (400 m width) to a focal site in VL and (b) shows the distribution of forest in circles (400 m diameter) around all sampled sites in VL.
2008). For reduction of genotyping errors, only loci with normalized average peak heights more than 300 relative fluorescence units were selected for genotyping, result-ing in AFLP data with mismatch error rate of 2.8%. In order to diminish bias in estimation of population genetic parameters, AFLP data sets were pruned from loci with high (>1 – [3/N]) allele frequency with N being the total number of sampled individuals (Lynch and Milligan 1994). Reproducibility of AFLP loci was estimated by repeating DNA extraction and complete AFLP analysis of 91 plant samples (6.4%), thus following the recommendations to replicate 5–10% of all samples (Meudt and Clarke 2007). We generated 3 AFLP data sets: 1) for estimating the effect of the valley on genetic differentiation, we pooled all indi-viduals, resulting in an AFLP data set containing 85 poly-morphic loci. For all further statistical analyses, the data set was split between valleys, resulting in 2) 1 data set for VL (695 individuals, 82 polymorphic loci), and 3) 1 data set for HR (721 individuals, 73 polymorphic loci).
Statistical Analyses
We first assessed the effect of the valley on overall genetic differentiation with the pooled AFLP data set. Equivalents of F-values (fAFLP) were estimated on individual basis with FAFLPcalc (Dasmahapatra et al. 2007). The overall fAFLP averages were used as prior information for Bayesian com-putation of allele frequencies and FST values based on allelic frequencies following Zhivotovsky (1999) in AFLP-SURV 1.0 (Vekemans 2002). Significance of overall FST was esti-mated with 95% confidence intervals based on 1000 distance matrices bootstrapped over individuals among populations. Significances of pairwise FST values were estimated via a non-parametric permutation approach with 10 000 permutations of individuals over populations in Arlequin 3.5.1.3 (Excoffier and Lischer 2010). Pairwise FST values between sampling sites were used as input matrix (Croucher et al. 2012) for a prin-ciple coordinates analysis (PCoA). Partitioning of genetic variation between valleys, between sampling sites within val-leys, and within sampling sites was carried out via analysis of molecular variance (Amova), with 999 permutations for significance testing. Both PCoA and Amova were carried out in GenAlEx 6.4 (Peakall and Smouse 2006).
Within each valley, overall FST and pairwise FST were cal-culated, following the same procedure as we did with the pooled data set. Moreover, the expected heterozygosity (He) was estimated to assess neutral genetic diversity within sam-pling sites, using AFLP-SURV 1.0.
Several different analytical methods have been used in the literature to explore the permeability of landscapes to gene flow (Holderegger et al. 2010). Some modeling approaches require detailed parameterization of permeability of differ-ent landscape elemdiffer-ents, for example, the least-cost approach implemented in the software Circuitscape (McRae and Beier 2007). Because this information is highly difficult to gain a piori for plant species due to the manifold seed and pol-len dispersers, we adopt 2 alternative approaches: the strip and circle approach (Figure 2). In both, the strip and circle
approach, we tested a priori for collinearity of explanatory variables with Spearman rank correlation (rho) and variance inflation factors (VIF). If rho > 0.7 and/or VIF > 10, cor-rective measures would be needed for the subsequent analy-ses (Dormann et al. 2012). Similar to most other landscape genetic studies (Storfer et al. 2010; Emaresi et al. 2011; Keller et al. 2012), we used pairwise FST values as an indicator of genetic differentiation and historical gene flow between sites. For the circle approach, these values were averaged per site.
For the strip approach, we carried out multiple regression analyses on distance matrices between the response FST-matrix and the explanatory matrices using the function MRM in the R-package “ecodist” (Goslee and Urban 2007; R Development Core Team 2013). This approach is an extension of a classic partial Mantel test. Permutation tests (1 000 000) were per-formed to estimate the significance of regression coefficients and R2 values (Lichstein 2007). For both data sets of the 2 valleys, we ran 1 model per strip width (110, 210, 410, and 810 m). We started with complete models including 5 explana-tory matrices, that is, percentages of forests, semi-dry grass-lands, and roads as well as geographic and altitudinal distances among sampling sites. Incorporating geographic distances into the analysis allows accounting for potential effects of spatial autocorrelation (SAC). To determine the models with the best fit, we sequentially excluded variables with the highest P value until only variables with P < 0.1 remained.
For the circle approach, we fitted 2 different multiple linear regression models for each valley, using a general-ized least square approach, as implemented in the “nlme” package in R (Pinheiro et al. 2012). SAC was investigated considering semivariograms of the model without a spatial error term. To underline the absence of spatial patterns in the semivariogram, we applied a simulation approach. In 1 of the 2 models per valley, we accounted for potential SAC by inclusion of an exponential spatial correlation structure based on the Euclidean distances between the sampling site coordinates (Pinheiro and Bates 2000). The second model did not include a spatial correlation structure. We then com-pared the models with and without SAC term, using simu-lations to judge if the correlation structure is appropriate (adapted from Faraway 2006). We generated data under the null hypothesis, fitted the model with and without a spatial error term, and calculated the log-likelihood ratio (LRT). This procedure was repeated 999 times, and the proportion of values exceeding the observed LRT was used to estimate the P value. The best model according to the LRT simula-tion was chosen, and model selecsimula-tion via stepwise backward selection was applied to achieve the most parsimonious model. The initial model consisted of all explanatory vari-ables, that is, percentage of forest, semi-dry grassland, and roads as well as average geographic distance among sam-pling sites, average individual density and absolute altitude of the sampling sites.
For both approaches and all models, homoscedastic-ity and distribution of residuals were checked via Tukey– Anscombe plots and quantile-quantile plot. Variables were logit-transformed if model assumptions were not met, which was the case for the circle approach in HR and VL.
Results
Plant Density, Landscape Composition, and Relation of Landscape Elements in the 2 Valleys Under Study
In the valleys VL and HR, plant density of T. montanum per m2 ranged from 3 to 29 and from 3 to 42, respectively (VL: average = 11.4; standard error = 1.5; HR: average = 12.3; standard error = 1.7; Supplementary Table S1). In valley VL, forest covered 41.5% of the total area, 52.0% was open agricultural land (from which 5.7% was semi-dry grassland area), 0.8% was road area, 4.0% was nonvegetated area, and 1.7% was uncategorized (e.g., villages). In HR, 47.8% of the landscape area was covered by forest, 42.9% was open agri-cultural land (7.6% of this was semi-dry grassland area), 4.2% was nonvegetated, and 5.1% was uncategorized area.
In the strip analyses in VL, the strongest correlation among explanatory variables was –0.42 both between semi-dry grassland and geographic distance (110-m strip width), and between forest and road areas (810-m strip width). Highest VIF was 1.33 for semi-dry grassland area (810-m strip widths). For the strip analysis in HR, the strongest correlation was –0.53 between forest and road areas (810-m strip width) and highest VIF was 1.28 for roads (810-m strip width).
For the circle approach in VL, strongest correlation was –0.58 between altitude and road area (800 m radius), whereas maximal VIF was 2.51 for absolute altitude of sampling site. In valley HR, the strongest correlation was –0.54 between absolute altitude of sampling site and road area (400 m radius), whereas maximal VIF was 1.96 for road areas (800 m radius).
For both approaches, the correlation coefficients and VIF estimates were always below the thresholds indicated previ-ously, and thus, no corrective measures were needed. Patterns of Genetic Variation
Across all sampled sites, the hierarchical Amova indicated that 1.4% of the genetic variation was explained by differ-ences between valleys, 5.4% was among sampling sites within valleys, and 93.1% was within sampling sites (P < 0.001 for all partitions). Analogous, overall FST was 0.044. PCoA axes 1 and 2 explained 28.9% and 20.0%, respectively, of the genetic variation. Along the second PCoA axis, although very roughly only, sampling sites were separated between the 2 valleys (Figure 3). A Wilcoxon test indicated different aver-age PCoA scores along the second PCoA axis for valley VL versus HR (P = 0.001).
At the valley level, He was 0.26 in VL and HR. Overall, FST was 0.042 and 0.038 for sampling sites in VL and HR, respectively (P < 0.001). Pairwise FST values ranged in VL from 0 (7 cases) to 0.119 and in HR from 0 (13 cases) to 0.112 (Supplementary Table S2). In VL 7.0% and in HR 16.6% of all pairwise FST values were not significantly differentiated. Patterns of Genetic Differentiation in Relation to Landscape Elements
The strip approach revealed that forests, roads, and geo-graphic distance did not affect FST values in both our study valleys at any of the 4 different strip widths (Table 1). In valley
VL, only the amount of semi-dry grassland area, within strip widths of 110 and 210 m, remained in the final model show-ing a negative effect on genetic differentiation (β = –0.146, R2 = 0.021; P = 0.038 and β = –0.156, R2 = 0.024; P = 0.022, respectively; Table 1). In contrast to VL, in valley HR, only altitudinal distance among sampling sites remained in all models showing a positive effect on genetic differentiation (β = 0.134, R2 = 0.018; P = 0.038; Table 1).
In the circle approach, there was better model fit with-out SAC versus with SAC at 2 radii in valley VL (800 m radius: Akaike information criterion (AIC) = 12.8 vs. 14.8, P = 0.021; 400 m radius: AIC = 9.6 vs. 10.8, P = 0.020), whereas the models indicated no differences in the 100 and 200 m radii at VL as well as all radii at HR. These results indi-cate that SAC does not affect patterns of gene flow in our study area, and thus, the presented results are based on mod-els without SAC. The best fitting modmod-els showed that forest, individual density, and average geographic distance had no effect on average FST values in both study valleys (Table 1). In VL only at a circle radius of 100 m, semi-dry grassland area had a slightly negative effect on FST values (β = –0.578; adjusted R2 = 0.169; P = 0.055), and there was a trend to a positive effect of road area on FST values (β = 8.530; adjusted R2 = 0.169; P = 0.065). In valley HR, only absolute altitude of sampling site had a negative effect on FST values (β = –1.5 x 10–05; adjusted R2 = 0.180; P = 0.013).
Discussion
Genetic diversity was relatively high within all sampling sites of T. montanum with most variation within rather than among sampling sites or regions. Genetic structuring was low within both studied valley systems. This suggests that historic gene flow between the sampling sites of the species was prob-ably extensive. Both the strip and the circle approach indi-cated that forests have no effect on genetic differentiation in T. montanum. Genetic differentiation was (slightly) negatively affected by area of semi-dry grassland in valley VL, which was restricted to strips of 110 and 210 m width and to circles of 100 m radius. Moreover, areas of roads tended to increase genetic differentiation in VL. In valley HR, genetic differen-tiation increased with larger altitudinal distances among sam-pling sites, and samsam-pling sites at higher altitude showed lower genetic differentiation.
Evidence for Low Genetic Structuring in T. montanum at Landscape Scale
The observed low genetic structuring of the sampling sites, as indicated by the low FST values, is in line with results of an earlier study on genetic differentiation in T. montanum, which was conducted at a larger geographic scale (Hahn et al. 2012). This study found an overall FST value of 0.12 among 20 sampled populations with an isolation-by-distance relation-ship up to a maximal distance of 197.7 km among popula-tions. The overall He value for T. montanum was 0.24, similar to the findings in this study. Hahn et al. (2012) also found low genetic differentiation, isolation-by-distance patterns,
and intermediate genetic diversity in the semi-dry grassland species Briza media (FST = 0.099, He = 0.26) and Ranunculus bulbosus (FST = 0.071, He = 0.17). Likewise, Anthyllis vulneraria, a predominantly selfing semi-dry grassland clover species, showed similar levels of genetic diversity (He = 0.28) and low differentiation (ΦST = 0.056) in a study region of 15 km2 (Honnay et al. 2006). The low genetic structuring in T. monta-num and other semi-dry grassland plant species at landscape scales suggests extensive historic gene flow among sites, by dispersal of seed and/or pollen.
The molecular approach used does not enable us to make inferences on the relative contribution of seed and pollen dispersal to gene flow in T. montanum. Despite its seeds hav-ing no obvious adaptation to dispersal, there is considerable evidence from the literature that endozoochory is important in other Trifolium species. Sheep and cattle have both been reported as potential vectors of seed dispersal in Trifolium campestre (Eichberg et al. 2007) and Trifolium repens seeds (Gardener et al. 1993), respectively. Rotational sheep grazing has been suggested as 1 management approach leading to increased landscape connectivity in plants (Rico et al. 2012). Scats of foxes also contained viable seeds of Trifolium sp. (D’Hondt et al. 2012). In Trifolium micranthum, anthropogenic long-distance seed dispersal, likely via exchange of seeds with
composted lawn material over more than 30 km, led to estab-lishment of new populations (D’Hondt et al. 2012). In the Alps, hay transportation from higher altitude meadows to the valley bottom using high-line cables could also increase gene flow among sites of T. montanum.
The main pollinators of T. montanum are known to be able to cover relatively large areas: Estimates of pollinator move-ment using radiotelemetry in Bombus terrestris showed maximal flight distances of 2.5 km (Hagen et al. 2011). In Apis mellif-era, waggle dance decoding suggested average flight distances of 5.5 km (Beekman and Ratnieks 2000). A recent study of pollen dispersal in T. montanum demonstrated that pollen flow appeared to be extensive across an area of 300 × 1000 m and across an altitudinal gradient of 600 m a.s.l. (Matter et al. 2013). This illustrates that seed or pollen dispersal potential over large distances is likely to limit genetic differentiation in T. montanum.
Do Landscape Elements Influence Genetic Differentiation in T. montanum?
Effects of Forests, Roads, and Semi-Dry Grasslands
Our expectation was that forest would act as a barrier to both pollen and seed dispersal in T. montanum. We assumed
Figure 3. PCoA of pairwise FST values among all sampling sites of Trifolium montanum in VL (black dots) and HR (white
that pollinators would avoid moving through or above forest areas. However, the proportion of forested area had no effect on patterns of genetic differentiation in T. montanum. Two other studies suggest that forests might not be barriers for bumblebees and bees, the major pollinators of T. montanum. A mark-recapture study of Bombus terrestris suggested that bumblebees forage above the forest canopy and exploit nec-tar sources in forest gaps (Kreyer et al. 2004). In the wild bee species Chelostoma florisomne, forest areas of up to 480 m width were no foraging barrier (Zurbuchen et al. 2010). In valley VL, greater area of semi-dry grassland among or adjacent to sites were associated with lower levels of genetic differentia-tion. One explanation for this is that gene flow could follow a stepping stone pattern and is higher if more habitat area is present among sampling sites. A stepping stone pollination pattern along a snowmelt gradient was observed in snowbed plants (Hirao and Kudo 2004, 2008). In our study, semi-dry grassland negatively affected FST only at strip widths of 110 and 210 m (Table 1) and at a 100-m circle radius, demon-strating the relatively small spatial scale over which this factor seems to be significant.
In a landscape genetics study in Eryngium alpinum, popula-tions in an Alpine valley showed unexpectedly high genetic homogeneity (global FST = 0.013), despite of habitat frag-mentation (Gaudeul and Till-Bottraud 2008), which the authors explained with long-distance pollen/seed dispersal or too recent fragmentation to cause genetic structure. A simi-lar reason might have caused a low overall FST value (global
FST = 0.033) in the globeflower Trollius europaeus, which was found among highly fragmented populations on a relatively small sampling scale (ca. 30 × 30 km; Klank et al. 2012). The Catananche lutea (Asteraceae) showed, despite of relatively high differentiation on landscape scale (global FST = 0.5), no correlation between genetic diversity, patch size, distance, and fitness (Gemeinholzer et al. 2012). In congruence with our results, these studies suggest that habitat fragmentation might, on landscape scale, affect genetic differentiation to a lower extent than previously thought.
We initially assumed that paths and roads might enhance seed flow by livestock or vehicles (Taylor et al. 2012). Thus, higher density of paths and roads were expected to increase dispersal of seeds among sites. The road network showed only in 1 model and 1 valley a slight effect on genetic dif-ferentiation in T. montanum in this study, which even indi-cated decreased gene flow. Paths and roads may reduce free-ranging animal movement (Trombulak and Frissell 2000). Fenced roads, for example, can hinder movement of roe deer Capreolus capreolus (Hepenstrick et al. 2012) and thus might potentially limit plant seed dispersal. Higher road area caused decreased genetic diversity of Geum urbanum popula-tions (Baessler et al. 2010), likely due to decreased gene flow. Effects of Individual Density, Altitude, and Geographic Distance Higher plant density can lead to higher reproduction success (Bernhardt et al. 2008) and increased flower visitation rates (Grindeland et al. 2005) within populations and might as well Table 1 Results of the best fitting models of the multiple matrix regression (strip approach) and multiple regression (circle approach) analysis of Trifolium montanum in the 2 valleys (VL and HR). The tested factors are percentage of forest, road, and semi-dry grassland
area as well as geographic distance, altitudinal distance, average geographic distance to all other sites under study, and individual density.
P values are given in brackets
Valley Strip
width (m) R2 Intercept Forest Road Semi-dry grassland Geographic distance Altitudinal distancea
VL 110 0.0244 252.04 (0.012) — — −0.156 (0.022) — — 210 0.0210 249.95 (0.019) — — −0.146 (0.038) — — 410 — — — — — — — 810 — — — — — — — HR 110 0.0179 201.77 (0.987) — — — — 0.134 (0.0143) 210 0.0179 201.77 (0.987) — — — — 0.134 (0.0143) 410 0.0179 201.77 (0.987) — — — — 0.134 (0.0143) 810 0.0179 201.77 (0.987) — — — — 0.134 (0.0143) Circle
radius (m) R2 Intercept Forest Road
Semi-dry grassland Average geographic distance Altitudea Individual density VL 100 0.169 −2.97 (< 0.001) — 8.529 (0.0652) −0.578 (0.0553) — — — 200 — — — — — — — — 400 — — — — — — — — 800 — — — — — — — — HR 100 0.170 −2.7508 (<0.001) — — — — −0.0003 (0.0151) — 200 0.170 −2.7508 (<0.001) — — — — −0.0003 (0.0151) — 400 0.170 −2.7508 (<0.001) — — — — −0.0003 (0.0151) — 800 0.170 −2.7508 (<0.001) — — — — −0.0003 (0.0151) —
cause increased pollen-mediated gene flow among popula-tions. In this study, individual plant density did, however, not affect genetic differentiation. Although extensive gene flow is the most likely explanation for the low FST values, we can-not exclude alternative causes. For example, plant density and area covered by T. montanum were generally relatively high at the study sites, which likely led to high effective population sizes and thus might reduce differentiation through reduc-tion of drift effects.
In addition, recent founder events might have caused low levels of FST. However, the latter seems rather implausible given the relatively high levels of diversity observed, as well as the long history of semi-dry grasslands in Switzerland. These grasslands spread across the Swiss Alps due to agricultural land use, including livestock husbandry, since approximately 5000 y.b.p. (Bätzing 2005). Therefore, an accumulation of propagule inflow over time, fostered by the long persistence of the habitat type, might well explain the low FST values.
Genetic differentiation in T. montanum increased with larger altitudinal distances between sampling sites in valley HR. Extensive contemporary pollen flow along an elevation gradient of 600 m altitudinal difference (1200–1800 m a.s.l.) was observed in another study of T. montanum (Matter et al. 2013). The effect of the altitudinal distance in HR might, therefore, not primarily be explained by a shift of flowering phenology and/or composition of the pollinator community. Moreover, the effect of absolute altitude of sampling site in HR disappeared in the circle approach when the 3 sampling sites with the highest genetic differentiation were excluded from the models (details not shown). These 3 sites are situated in the flat valley bottom, where fragmentation of semi-dry grassland patches is high. This finding suggests that the sites at the valley bottom are genetically isolated, possibly due to a relative high percentage of settlements and intensive agricul-tural land. Yet, it is important to note that there was no overall effect of geographic distance on genetic differentiation in any of our models, which suggests that gene flow is generally not spatially restricted at the investigated landscape scale.
Comparison of the Strip and the Circle Approach
In this study, both of the applied approaches showed simi-lar results, suggesting that the choice of the spatial approach did not lead to fundamentally different results and analysis interpretations. Still, the approaches offer some differences in terms of specific, potentially ecological relevant factors, which can be tested: for example, the altitudinal difference among sampling sites in the strip approach and the individual density at the sampling sites in the circle approach. Thus, the 2 approaches provide useful composite analytical tools. Implications for Conservation of Semi-Dry Grasslands at Landscape Scale
Our statistical models indicate only low effects of altitude and total area of semi-dry grassland on genetic structuring in T. montanum at the landscape scale. Contrary to our expecta-tions, there were no effects of the most prominent landscape
element forest and only a slight effect of paths and roads on genetic differentiation of T. montanum in our study system.
The Mesobromion plant community includes a high number of rare species (e.g., species from the genus Orchis and Ophris) often with low population sizes and individual densities. These species may not respond in the same way as our study species. However, our results imply that, at least in the short term, an increase in the area of forests or coverage of paths and road is unlikely to have major implications for genetic structure in plant species with similar ecology and distribu-tions to T. montanum. Studying the effect of landscape ele-ments on genetic differentiation in a wider range of species will provide additional important insights for conservation management of these systems of which our study provides a useful baseline.
Supplementary Material
Supplementary material can be found at http://www.jhered. oxfordjournals.org/.
Funding
Swiss National Science Foundation (31003–116277 to J.G. and A.R.P.); the Swiss Federal Institute of Technology Zurich (ETH) Competence Centre Environment and Sustainability (project BioChange).
Acknowledgments
AFLP readings were done in the Genetic Diversity Centre of ETH Zurich. We are thankful for statistical advice by D. Keller (WSL, Birmensdorf). We also thank Prof. R. Holderegger (WSL, Birmensdorf), the editor, Prof. K. Olsen, and the anonymous referees for helping to improve the manuscript.
References
Aeschimann D, Lauber K, Michel A. 2004. Flora alpina ein Atlas sämtlicher 4500 Gefässpflanzen der Alpen. Bern (Switzerland): Haupt.
Aguilar R, Ashworth L, Galetto L, Aizen MA. 2006. Plant reproductive sus-ceptibility to habitat fragmentation: review and synthesis through a meta-analysis. Ecol Lett. 9:968–980.
Arroyo MTK, Armesto JJ, Primack RB. 1985. Community studies in pol-lination ecology in the high temperate Andes of central Chile II. Effect of temperature on visitation rates and pollination possibilities. Plant Syst Evol. 149:187–203.
Baessler C, Klotz S, Durka W. 2010. Temporal changes and spatial determi-nants of plant species diversity and genetic variation. In: Müller F, Baessler C, Schubert H, Klotz S, editors. Long-term ecological research. Dordrecht (The Netherlands): Springer. p. 279–297.
BAFU. 2006. TWW - Bundesinventar der Trockenwiesen und -weiden von nationaler Bedeutung/GIS-Vector-Data of dry meadows and pastures of national importance. Bern (Switzerland): Federal Office for the Environment (FOEN). Available from: http://www.bafu.admin.ch/schutzgebiete-inven-tare/07849/10061/index.html?lang=de&download=NHzLpZeg7t,lnp6I 0NTU042l2Z6ln1acy4Zn4Z2qZpnO2Yuq2Z6gpJCGd3t5hGym162epYb g2c_JjKbNoKSn6A--l
Bätzing W. 2005. Die Alpen. Geschichte und Zukunft einer europäischen Kulturlandschaft. München (Germany): Beck.
Beekman M, Ratnieks FLW. 2000. Long-range foraging by the honey-bee,
Apis mellifera L. Funct Ecol. 14:490–496.
Bernhardt CE, Mitchell RJ, Michaels HJ. 2008. Effects of population size and density on pollinator visitation, pollinator behavior, and pollen tube abundance in Lupinus perennis. Int J Plant Sci. 169:944–953.
Bhattacharya M, Primack RB, Gerwein J. 2003. Are roads and railroads bar-riers to bumblebee movement in a temperate suburban conservation area? Biol Conserv. 109:37–45.
Byars SG, Parsons Y, Hoffmann AA. 2009. Effect of altitude on the genetic structure of an Alpine grass, Poa hiemata. Ann Bot. 103:885–899.
Carvell C, Jordan WC, Bourke AFG, Pickles R, Redhead JW, Heard MS. 2012. Molecular and spatial analyses reveal links between colony-specific foraging distance and landscape-level resource availability in two bumblebee species. Oikos. 121:734–742.
Castellano S, Balletto E. 2002. Is the partial Mantel test inadequate? Evolution. 56:1871–1873.
Croucher PJ, Oxford GS, Lam A, Mody N, Gillespie RG. 2012. Colonization history and population genetics of the color-polymorphic Hawaiian happy-face spider Theridion grallator (Araneae, Theridiidae). Evolution. 66:2815–2833.
D’Hondt B, Breyne P, Landuyt W, Hoffmann M. 2012. Genetic analysis reveals human-mediated long-distance dispersal among war cemeteries in
Trifolium micranthum. Plant Ecol. 213:1241–1250.
Dasmahapatra KK, Lacy RC, Amos W. 2007. Estimating levels of inbreed-ing usinbreed-ing AFLP markers. Heredity. 100:286–295.
Delarze R, Gonseth Y, Galland P. 1999. Lebensräume der Schweiz Ökologie, Gefährdung, Kennarten. Thun (Switzerland): Ott.
Dormann CF, Elith J, Bacher S, Buchmann C, Carl G, Carré G, Marquéz JRG, Gruber B, Lafourcade B, Leitão PJ, et al. 2012. Collinearity: a review of methods to deal with it and a simulation study evaluating their performance. Ecography. 36:027–046.
Eichberg C, Storm C, Schwabe A. 2007. Endozoochorous dispersal, seedling emergence and fruiting success in disturbed and undisturbed successional stages of sheep-grazed inland sand ecosystems. Flora. 202:3–26.
Emaresi G, Pellet J, Dubey S, Hirzel A, Fumagalli L. 2011. Landscape genetics of the Alpine newt (Mesotriton alpestris) inferred from a strip-based
approach. Conserv Genet. 12:41–50.
Excoffier L, Lischer HE. 2010. Arlequin suite ver 3.5: a new series of pro-grams to perform population genetics analyses under Linux and Windows. Mol Ecol Resour. 10:564–567.
Faraway JJ. 2006. Extending the linear model with R generalized linear, mixed effects and nonparametric regression models. Texts in statistical sci-ence. Boca Raton (FL): Chapman & Hall/CRC.
Gardener CJ, McIvor JG, Jansen A. 1993. Passage of legume and grass seeds through the digestive tract of cattle and their survival in faeces. J Appl Ecol. 30:63–74.
Gaudeul M, Till-Bottraud I. 2008. Genetic structure of the endangered per-ennial plant Eryngium alpinum (Apiaceae) in an alpine valley. Biol J Linn Soc.
93:667–677.
Gellrich M, Baur P, Koch B, Zimmermann NE. 2007. Agricultural land abandonment and natural forest re-growth in the Swiss mountains: a spa-tially explicit economic analysis. Agric Ecosyst Environ. 118:93–108. Gemeinholzer B, May F, Ristow M, Batsch C, Lauterbach D. 2012. Strong genetic differentiation on a fragmentation gradient among populations of the hetero-carpic annual Catananche lutea L. (Asteraceae). Plant Syst Evol. 298:1585–1596.
Ghazoul J. 2005. Pollen and seed dispersal among dispersed plants. Biol Rev Camb Philos Soc. 80:413–443.
Gilpin ME, Soule ME. 1986. Minimum viable populations processes of spe-cies extinction. In: Soule ME, editor. Conservation biology: the science of scarcity and diversity. Sunderland (MA): Sinauer Associates. p. 19–34.
Goslee SC, Urban DL. 2007. The ecodist package for dissimilarity-based analysis of ecological data. J Stat Softw. 22:1–19.
Grindeland JM, Sletvold N, Ims RA. 2005. Effects of floral display size and plant density on pollinator visitation rate in a natural population of Digitalis purpurea. Funct Ecol. 19:383–390.
Hagen M, Wikelski M, Kissling WD. 2011. Space use of bumblebees (Bombus
spp.) revealed by radio-tracking. PLoS One. 6:e19997.
Hahn T, Kettle CJ, Ghazoul J, Frei ER, Matter P, Pluess AR. 2012. Patterns of genetic variation across altitude in three plant species of semi-dry grass-lands. PLoS One. 7:e41608.
Hanski I. 1998. Metapopulation dynamics. Nature. 396:41–49.
Hennig EI, Ghazoul J. 2011. Plant–pollinator interactions within the urban environment. Perspect Plant Ecol. 13:137–150.
Hennig EI, Ghazoul J. 2012. Pollinating animals in the urban environment. Urban Ecosyst. 15:149–166.
Hepenstrick D, Thiel D, Holderegger R, Gugerli F. 2012. Genetic disconti-nuities in roe deer (Capreolus capreolus) coincide with fenced transportation
infrastructure. Basic Appl Ecol. 13:631–638.
Herrera JM, Garcia D. 2010. Effects of forest fragmentation on seed dis-persal and seedling establishment in ornithochorous trees. Conserv Biol. 24:1089–1098.
Hirao AS, Kudo G. 2004. Landscape genetics of alpine-snowbed plants: com-parisons along geographic and snowmelt gradients. Heredity. 93:290–298. Hirao AS, Kudo G. 2008. The effect of segregation of flowering time on fine-scale spatial genetic structure in an alpine-snowbed herb Primula cuneifo-lia. Heredity. 100:424–430.
Holderegger R, Buehler D, Gugerli F, Manel S. 2010. Landscape genetics of plants. Trends Plant Sci. 15:675–683.
Holderegger R, Di Giulio M. 2010. The genetic effects of roads: a review of empirical evidence. Basic Appl Ecol. 11:522–531.
Honnay O, Coart E, Butaye J, Adriaens D, Van Glabeke S, Roldán-Ruiz I. 2006. Low impact of present and historical landscape configuration on the genet-ics of fragmented Anthyllis vulneraria populations. Biol Conserv. 127:411–419.
Hülber K, Winkler M, Grabherr G. 2010. Intraseasonal climate and habitat-specific variability controls the flowering phenology of high alpine plant spe-cies. Funct Ecol. 24:245–252.
Ismail SA, Ghazoul J, Ravikanth G, Shaanker RU, Kushalappa CG, Kettle CJ. 2012. Does long-distance pollen dispersal preclude inbreeding in tropi-cal trees? Fragmentation genetics of Dysoxylum malabaricum in an agro-forest
landscape. Mol Ecol. 21:5484–5496.
Janzen DH. 1971. Euglossine bees as long-distance pollinators of tropical plants. Science. 171:203–205.
Jauker F, Diekötter T, Schwarzbach F, Wolters V. 2009. Pollinator dispersal in an agricultural matrix: opposing responses of wild bees and hoverflies to landscape structure and distance from main habitat. Landscape Ecol. 24:547–555.
Keller D, Van Strien MJ, Holderegger R. 2012. Do landscape barriers affect functional connectivity of populations of an endangered damselfly? Freshwater Biol. 57:1373–1384.
Klank C, Ghazoul J, Pluess AR. 2012. Genetic variation and plant perfor-mance in fragmented populations of globeflowers (Trollius europaeus) within
agricultural landscapes. Conserv Genet. 13:873–884.
Körner C. 2003. Alpine plant life. 2nd ed. Heidelberg (Germany): Springer.
Kreyer D, Oed A, Walther-Hellwig K, Frankl R. 2004. Are forests potential landscape barriers for foraging bumblebees? Landscape scale experiments with Bombus terrestris agg. and Bombus pascuorum (Hymenoptera, Apidae). Biol
Conserv. 116:111–118.
Ledig FT. 1992. Human impacts on genetic diversity in forest ecosystems. Oikos. 63:87–108.
Legendre P, Fortin MJ. 2010. Comparison of the Mantel test and alternative approaches for detecting complex multivariate relationships in the spatial analysis of genetic data. Mol Ecol Resour. 10:831–844.
Leonhardt S, Blüthgen N. 2012. The same, but different: pollen foraging in honeybee and bumblebee colonies. Apidologie. 43:449–464.
Lichstein JW. 2007. Multiple regression on distance matrices: a multivariate spatial analysis tool. Plant Ecol. 188:117–131.
Lynch M, Milligan BG. 1994. Analysis of population genetic structure with RAPD markers. Mol Ecol. 3:91–99.
Manel S, Schwartz MK, Luikart G, Taberlet P. 2003. Landscape genetics: combining landscape ecology and population genetics. Trends Ecol Evol. 18:189–197.
Matter P, Kettle CJ, Ghazoul J, Pluess AR. 2013. Extensive contemporary pollen-mediated gene flow in two herb species, Ranunculus bulbosus and Trifolium montanum, along an altitudinal gradient in a meadow landscape. Ann
Bot. 111:611–621.
McConkey KR, Prasad S, Corlett RT, Campos-Arceiz A, Brodie JF, Rogers H, Santamaria L. 2012. Seed dispersal in changing landscapes. Biol Conserv. 146:1–13.
McRae BH, Beier P. 2007. Circuit theory predicts gene flow in plant and animal populations. Proc Natl Acad Sci U S A. 104:19885–19890. Meudt HM, Clarke AC. 2007. Almost forgotten or latest practice? AFLP applications, analyses and advances. Trends Plant Sci. 12:106–117. Oberdorfer E, Müller T, Korneck D. 1994. Pflanzensoziologische Exkursionsflora. Uni-Taschenbücher. Stuttgart (Germany): Ulmer. Ockinger E, Bergman KO, Franzen M, Kadlec T, Krauss J, Kuussaari M, Poyry J, Smith HG, Steffan-Dewenter I, Bommarco R. 2012. The landscape matrix modifies the effect of habitat fragmentation in grassland butterflies. Landscape Ecol. 27:121–131.
Ohsawa T, Ide Y. 2008. Global patterns of genetic variation in plant species along vertical and horizontal gradients on mountains. Global Ecol Biogeogr. 17:152–163.
Peakall R, Smouse PE. 2006. GENALEX 6: genetic analysis in excel. Population genetic software for teaching and research. Mol Ecol Notes. 6:288–295. Pérez-Espona S, Pérez-Barbería FJ, McLeod JE, Jiggins CD, Gordon IJ, Pemberton JM. 2008. Landscape features affect gene flow of Scottish Highland red deer (Cervus elaphus). Mol Ecol. 17:981–996.
Pinheiro JC, Bates D. 2000. Mixed-effects models in S and S-PLUS. Statistics and computing. New York: Springer.
Pinheiro J, Bates D, DebRoy S, Sarkar D, the R Development Core Team. 2013. nlme: linear and nonlinear mixed effects models. R package version 3.1–111. Available from: http://cran.r-project.org/web/packages/nlme/cita-tion.html
Poschlod P, Kiefer S, Tränkle U, Fischer S, Bonn S. 1998. Plant species rich-ness in calcareous grasslands as affected by dispersability in space and time. Appl Veg Sci. 1:75–91.
R Development Core Team. 2013. R: a language and environment for statistical computing. Vienna (Austria): R Foundation for Statistical Computing.
Raufaste N, Rousset F. 2001. Are partial mantel tests adequate? Evolution. 55:1703–1705.
Richards CM. 2000. Inbreeding depression and genetic rescue in a plant metapopulation. Am Nat. 155:383–394.
Rico Y, Boehmer H, Wagner H. 2012. Determinants of actual functional connectivity for calcareous grassland communities linked by rotational sheep grazing. Landscape Ecol. 27:199–209.
Roland J, Keyghobadi N, Fownes S. 2000. Alpine Parnassius butterfly
disper-sal: effects of landscape and population size. Ecology. 81:1642–1653. Schleuning M, Matthies D. 2009. Habitat change and plant demography: assessing the extinction risk of a formerly common grassland perennial. Conserv Biol. 23:174–183.
Schleuning M, Niggemann M, Becker U, Matthies D. 2009. Negative effects of habitat degradation and fragmentation on the declining grassland plant
Trifolium montanum. Basic Appl Ecol. 10:61–69.
Schmidt T, Arens P, Smulders MJM, Billeter R, Liira J, Augenstein I, Durka W. 2009. Effects of landscape structure on genetic diversity of Geum urbanum
L. populations in agricultural landscapes. Flora. 204:549–559.
Schmitt T, Varga Z, Seitz A. 2000. Forests as dispersal barriers for Erebia medusa (Nymphalidae, Lepidoptera). Basic Appl Ecol. 1:53–59.
Smouse PE, Sork VL. 2004. Measuring pollen flow in forest trees: an exposi-tion of alternative approaches. Forest Ecol Manag. 197:21–38.
Smulders M, Cobben M, Arens P, Verboom J. 2009. Landscape genetics of fragmented forests: anticipating climate change by facilitating migration. iForest. 2:128–132.
Sork V, Smouse P. 2006. Genetic analysis of landscape connectivity in tree populations. Landscape Ecol. 21:821–836.
Steffan-Dewenter I, Munzenberg U, Burger C, Thies C, Tscharntke T. 2002. Scale-dependent effects of landscape context on three pollinator guilds. Ecology. 83:1421–1432.
Stoate C, Boatman ND, Borralho RJ, Carvalho CR, de Snoo GR, Eden P. 2001. Ecological impacts of arable intensification in Europe. J Environ Manage. 63:337–365.
Stöcklin J, Bossard A, Klaus, Rudmann-Maurer K, Fischer M. 2007. Landnutzung und biologische Vielfalt in den Alpen. Zürich (Switzerland): Fakten, Perspektiven, Empfehlungen.
Storfer A, Murphy MA, Spear SF, Holderegger R, Waits LP. 2010. Landscape genetics: where are we now? Mol Ecol. 19:3496–3514.
Taki H, Kevan P, Ascher J. 2007. Landscape effects of forest loss in a pol-lination system. Landscape Ecol. 22:1575–1587.
Taylor K, Brummer T, Taper ML, Wing A, Rew LJ. 2012. Human-mediated long-distance dispersal: an empirical evaluation of seed dispersal by vehicles. Divers Distrib. 18:942–951.
Trombulak SC, Frissell CA. 2000. Review of ecological effects of roads on terrestrial and aquatic communities. Conserv Biol. 14:18–30.
Vekemans X. 2002. AFLP-SURV version 1.0. Bruxelles (Belgium): Distributed by the author.
Whitlock MC, McCauley DE. 1999. Indirect measures of gene flow and migration: FST not equal to 1/(4Nm + 1). Heredity. 82:117–125.
Whitlock R, Hipperson H, Mannarelli M, Butlin RK, Burke T. 2008. An objective, rapid and reproducible method for scoring AFLP peak-height data that minimizes genotyping error. Mol Ecol Resour. 8:725–735.
Wolkinger F, Plank S. 1981. Dry grasslands of Europe. Nature and environ-ment series. Strasbourg (France): Council of Europe.
Zhivotovsky LA. 1999. Estimating population structure in diploids with multilocus dominant DNA markers. Mol Ecol. 8:907–913.
Zurbuchen A, Bachofen C, Müller A, Hein S, Dorn S. 2010. Are landscape structures insurmountable barriers for foraging bees? A mark-recapture study with two solitary pollen specialist species. Apidologie. 41:497–508.
Received January 15, 2013; First decision February 7, 2013; Accepted August 6, 2013