HAL Id: hal-02807354
https://hal.inrae.fr/hal-02807354
Submitted on 6 Jun 2020
HAL is a multi-disciplinary open access archive for the deposit and dissemination of sci-entific research documents, whether they are pub-lished or not. The documents may come from teaching and research institutions in France or abroad, or from public or private research centers.
L’archive ouverte pluridisciplinaire HAL, est destinée au dépôt et à la diffusion de documents scientifiques de niveau recherche, publiés ou non, émanant des établissements d’enseignement et de recherche français ou étrangers, des laboratoires publics ou privés.
Genome-wide association and haplotype-based
association mapping of mastitis in Lacaune sheep
Bingjie Li
To cite this version:
Bingjie Li. Genome-wide association and haplotype-based association mapping of mastitis in Lacaune sheep. Life Sciences [q-bio]. 2013. �hal-02807354�
European Master in Animal Breeding and Genetics (EM-ABG)
Genome-wide Association and Haplotype-based Association
Mapping of Mastitis in Lacaune Sheep
Student: BINGJIE LI Supervisor: RACHEL RUPP
JUNE 2013
- 2 -
Content
SUMMARY (SCIENTIFIC PURPOSE) ... 3
SUMMARY (PUBLIC PURPOSE) ... 4
INTRODUCTION ... 5
MATERIAL AND METHODS ... 9
-ANIMALS ... -9
-PHENOTYPES ... -9
-GENOTYPES AND QUALITY CONTROL ... -11
-STATISTICAL ANALYSIS ... -12
Genomewide association study (GWAS) ... 12
Haplotypebased Association Study ... 13
RESULTS ... 15
-VALIDATION OF TEST-STATISTICS:QQ-PLOT ... -15
-QTL MAPPING AND POTENTIAL QTL REGIONS ... -16
Mammary abscess traits: Abscess(casecontrol) and Abscess(category) ... 18
Somatic Cell Count traits: Infect status and LSCS ... 20
DISCUSSION ... 22
-COMPLEXITY OF GENETIC DETERMINISM OF MASTITIS AND FINE-PHENOTYPING OF MASTITIS-RELATED TRAITS... -22
-GWAS AND HAPLOTYPE-BASED ASSOCIATION ... -24
-HAPLOTYPE RECONSTRUCTION ... -25
CONCLUSION ... 28
ACKNOWLEDGEMENT ... 29
-- 3 --
Summary (scientific purpose)
The aim of this study was to perform a Genome-Wide Association Study (GWAS) and a Haplotype-based Association Mapping to identify potential Quantitative Trail Loci (QTLs) underlying four mastitis-related trails on Lacaune sheep genotyped by Illumina Ovine 50K SNP chip. The studied four traits include two Somatic Cell Count (SCC)-based traits, and two traits based on mammary abscess indicating chronic mastitis infection. 393 genotyped animals from two lines of Lacaune sheep previously selected for high and low milk SCC were included in this study, within which 334 ewes were phenotyped based on clinical examinations of udders. The statistical analysis included Genome-wide Association Study (GWAS) assuming independent markers and Haplotype-based association using phasing haplotype clusters. Mixed models were used in both associations taking account of population structure by including polygenic effect in the model. The result indicated five interesting regions respectively positioned on OAR3, 5, 8, 16, 20 which were respectively associated with different mastitis-related traits. Among the five regions, OAR16 was believed to have a big possibility of existence of a QTL around 30Mb since this region were detected associated with three mastitis-related traits. Region 49.1-49.5Mb on OAR20 was also very interesting for general presence of mastitis of mastitis since it was detected both in SCC-based trait and mammary abscess trait. Regions on OAR5 and OAR8 were found to be specifically related to mammary abscess, which may infer a specific immune pathway of forming mammary abscess in response to chronic clinical mastitis. In conclusion, this study introduced mammary abscess as a new phenotype for mastitis and detected two candidate QTLs highly associated with this phenotype. Due to the genetic complexity of mastitis, introducing new mastitis-related traits and fine-phenotyping available mastitis traits are important solutions to clarifying the genetic determinisms of mastitis infection.
Keywords: mastitis; mammary abscess; somatic cell count; genome-wide association;
- 4 -
Summary (public purpose)
Mastitis refers to the inflammation of the udder mainly due to intra-mammary infection by pathogenic organisms. It is one of the most costly diseases in small ruminant production due to its direct impact on milk production. The most popular phenotype nowadays for recording mastitis in small ruminants is milk Somatic Cell Count (SCC) which reflects the number of neutrophils within the mammary gland in response to intra-mammary infection. Studies have been carried out to find the Quantitative Trail Loci (QTLs) affecting SCC, but very few validated results were obtained due to the genetic complexity of SCC itself. More mastitis-related traits are highly needed to include into mastitis studies in order to clarify a complete picture of genetic basis of mastitis. This study introduced mammary abscess, one of the key symptoms in chronic mastitis in small ruminants, as a new haplotype to measure mastitis. Two association methods, Genome-wide Association Study (GWAS) and haplotype-based Association Mapping, were used in this study for QTL mapping of four mastitis-traits (two SCC-based traits and two mammary abscess traits) in Lacaune sheep. The result showed five candidate QTLs positioned on OAR3, 5, 8, 16, 20 that were highly related to presence of mastitis. Specifically, the candidate QTL on OAR16 (30Mb) was very interesting in containing big genes underlying mastitis since it was detected in three different mastitis-related traits, while OAR5 and OAR8 were thought to be more specifically related to mammary abscess in chronic mastitis. The findings of QTL regions for mammary abscess infer a power of using mammary abscess as a new phenotype in analyzing mastitis. Due to the complexity of genetic determinisms of mastitis, the introduction of abscess and other mastitis-related phenotypes can be very useful in better explaining mastitis. By combining QTL mapping results from different mastitis traits, more accurate QTL locations or causative mutations can be confirmed and can be further studied on their immune mechanisms in mastitis susceptibility or resistance in dairy sheep. In addition, validated QTLs can be applied into Marker Assisted Selection (MAS) for selecting animals with stronger resistance to mastitis.
- 5 -
Genome-wide Association and Haplotype-based Association
Mapping of Mastitis in Lacaune Sheep
Introduction
Mastitis refers to the inflammation of the mammary gland due to intra-mammary infection (IMI) with pathogenic organisms (Heringstad et al. 2000). It is considered as one of the most costly diseases in dairy animals (Davies et al. 2009; S J Wells et al. 1998; Bergonier et al. 2003), leading to a direct impact on milk production through increased culling rate, altered milk composition (Leitner et al. 2004), decreased milk quality (Coulon et al. 2002; Ma et al. 2000; Hogarth et al. 2004) and increased cost of veterinary treatment (Wells et al. 1998).
Staphylococci are the most prevalent pathogens of mastitis in dairy ruminants (Heringstad et al. 2000; Bergonier et al. 2003). In dairy cows, Staphylococcus aureus, Streptococcus agalactiae, Coliforms, Streptococci and Enterococci are major pathogens causing clinical mastitis, while Coagulase-negative Staphylococci and Corynebacterium bovis are minor pathogens causing subclinical mastitis (Heringstad et al. 2000; Harmon 1994). In small dairy ruminants, subclinical infection is much more frequent than clinical cases, which means Coagulase-Negative Staphylococci cannot be treated as minor pathogens any more (Bergonier et al. 2003). Coagulase-Negative Staphylococci are the most frequent pathogens in small dairy ruminants causing subclinical infection, while Staphylococcus aureus are considered to be most associated with clinical cases in small ruminants (Bergonier et al. 2003).
- 6 -
than 5% (Bergonier et al. 2003), compared with 20% to 40% in dairy cattle (Heringstad et al. 2000). In clinical mastitis, infected animals suffer from obvious inflammation and pain of the udder, declined milk yield and dramatic change in milk composition, in some cases, increased rectal temperature, lethargy, or anorexia (Harmon 1994; Heringstad et al. 2000). In subclinical mastitis, milk samples collected during early and mid-lactation contain coagulase-negative staphylococci, which may persist in many of the challenged glands and continue to influence the physiological conditions of the gland, leading to a chronic infection for long periods (Burriel 1997). In small ruminants, mastitis is generally a chronic and contagious infection (Bergonier et al. 2003). Acute clinical mastitis is very rare in small ruminants, but it generally causes severe clinical symptoms and leads to culling of the infected animals. By comparison, chronic mastitis is more common in small ruminants, causing pathological changes in mammary gland due to long-term infection. One of the key symptoms in chronic mastitis is mammary abscess, referring to a collection of pus (full of neutrophils) accumulated in a cavity formed by the tissue as a result of an infection process (Marogna et al. 2010). Mammary abscess can be detected through clinical examination of mammary glands, indicating direct immune response to chronic mastitis.
Accumulating studies imply that animals’ response to intramammary infection (IMI) is under genetic control (Rupp & Boichard 2003; Rupp 2007; Ogorevc et al. 2009). Measurement of intra-mammary infection can be performed directly by occurrence of clinical mastitis (CM) using milk bacteriological examination, or by indirect measures using phenotypes that are genetically correlated with intra-mammary infection (Heringstad et al. 2000). In Scandinavian countries, clinical mastitis (CM) has been routinely recorded since 1980s, and mastitis has been included in breeding programs since 1990s based on a direct selection for mastitis resistance using CM records (Heringstad et al. 2000). However, due to the lack of regular records of CM in most other countries and a generally low heritability of CM (h2= 0.02-0.03) (Heringstad et al. 2000), Somatic Cell Count (SCC) has been developed these years as an indirect measurement of mastitis (Bergonier et al. 2003; Rupp et al. 2009). Milk SCC reflects
- 7 -
the number of neutrophils that migrate from blood to mammary gland, which increases dramatically in response to intramammary infection (Rupp et al. 2009). In practice, the measures of SCC are commonly log-transformed into SCS in order to achieve data normality (Ali & Shook 1980). Genetic parameters have been established for SCS with a heritability ranging from 0.08 to 0.19 for lactation mean SCS (LSCS) in dairy cows (Heringstad et al. 2000), while in dairy sheep the heritability is estimated from 0.12- 0.15 (El-Saied et al. 1999; Barillet et al. 2001; Rupp et al. 2003). Specifically for Churra and Lacaune sheep, most studies based on larger data sets reported consistent heritability between 0.11 and 0.15 for the lactation mean SCS (LSCS) (Barillet et al. 2001; El-Saied et al. 1999; Rupp et al. 2003; Rupp et al. 2002). SCC is estimated to be in high correlation with clinical mastitis (CM) with a genetic correlation from 0.53 to 0.70 (Heringstad et al. 2000; Heringstad et al. 2006; Ødegård et al. 2004; Koivula et al. 2005; Carlén et al. 2004). This infers a shared genetic basis between SCC and clinical mastitis, but also highlights that SCC is not the same trait as clinical mastitis since their genetic correlation is still far from 1. Therefore, what SCC can detect should be partly related to clinical mastitis, and partly related to other mechanisms unrelated to mastitis. Recent studies have announced several potential QTL regions underlying SCC. In dairy cattle, QTLs associated with SCC/SCS are positioned on all chromosomes except on BTAX, according to the available reported QTLs in Animal QTL database (QTLdb; http://www.animalgenome.org/QTLdb). In dairy sheep, the number of published QTL is very limited and restricted to SCC phenotype: 7 QTLs associated with SCC/ SCS are published in Animal QTL database, separately distributed on OAR2, 6, 10, 14, 17, 20, and 22 (QTLdb; http://www.animalgenome.org/QTLdb). There are also a few unpublished QTLs available. Rupp et al. (2011; unpublished paper, 2013) reported several candidate QTLs for SCC based on a grand daughter design from commercial flocks of Lacaune sheep. These candidate QTLs are positioned on OAR3, 8, 10, 11, 14, 16, 20, which provides good candidate QTL resources for further studies on Lacaune sheep.
- 8 -
resistance to mastitis. Recent study has proven the effectiveness of SCC-based selection on reduction of mastitis in dairy small ruminants. Rupp et al. (2009) reported a favorable response to SCS-based selection in resistance to natural IMI by using Lacaune dairy ewes which had been divergently selected for milk SCS. They found significant difference in resistance to mastitis between ewes from high SCC line (SCC+) and low SCC line (SCC-), where all clinical cases of mastitis came from ewes in high SCC line. Additionally, the frequency of chronic clinical mastitis, as detected by the presence of mammary abscess, was detected much higher in the high SCC line than in low SCS line (Rupp et al. 2009). This result meanwhile infers a potential effectiveness of using “mammary abscess” as a new phenotype to measure and analyze mastitis.
So far, the knowledge of major genes underlying SCC is still unknown. SCC has been used as a black box in selection whose nature might not fully explain the complexity of mastitis (Rupp et al. 2009). The robustness of using SCC to represent mastitis may be not as high as expected since the genetic correlation between SCC and CM is still far from 1. In addition, SCS was reported not the same trait in animals with and without clinical mastitis, indicating a heterogeneous character of SCC and its complexity in explaining mastitis (Heringstad et al. 2006). Therefore, it is highly recommended to include more mastitis-related phenotypes to give a complete picture of the genetic basis of mastitis. Phenotypes in higher correlations with mastitis may provide easier and more robust way in explaining the genetic determinisms of mastitis. However, other than SCC, no other phenotype is now available to measure mastitis on a large scale in small ruminants. One recommendation of the potential phenotypes is mammary abscess, a typical symptom in chronic infection of mastitis. Although it has not been popularly used now in mastitis study, it offers valuable phenotypic material to explore the unknown genetic basis of mastitis. In addition to including new mastitis-related phenotypes, fine-phenotyping of available mastitis-related traits can be also a way to increase the accuracy of QTL detection by providing more detailed and comprehensive information of the phenotype. A good example can be developing more SCC-based traits. These SCC-based traits can be from SCC records from different lactation periods,
- 9 -
or from different methods in analyzing SCC phenotypes.
The aim of this study was to perform both a genome-wide association study (GWAS) and a haplotype-based association mapping to identify potential QTLs underlying four mastitis-related traits by using Illumina Ovine 50K SNP chip on Lacaune sheep from an experimental farm. The studied four traits include two SCC-based traits, and two traits based on mammary abscess. In the end, candidate QTLs from all traits were compared and contrasted to detect if they share some interesting regions.
Material and Methods
Animals
All animals used in this study were from the farm of La Fage, an experimental farm of INRA (UE 321, Roquefort, France). Two lines of Lacaune sheep selected for high and low milk SCC were included in this study, designated as “Low SCC Line (SCC-)” and “High SCC Line (SCC+)”. Animals in high SCC line were found in significantly higher susceptibility to mastitis, while animals in low SCC line showed relatively resistance to mastitis (Rupp et al. 2009). In total, 393 sheep in this population were genotyped, including 59 sires and 334 daughters (152 SCC+ and 182 SCC-). The 334 ewes were performed with mammary clinical examination by the experienced technicians on farm following the previous training by veterinarian.
Phenotypes
Four mastitis-related traits were included in this study. Table 1 describes the definition and data type of each trait: The first two traits are based on mammary abscess and the other two traits are based on SCC. They are treated as four different traits but in high phenotypic correlations with each other: the phenotypic correlation between two mammary abscess traits is 0.96, between two SCC-based traits is 0.92, and between
- 10 -
mammary abscess traits and SCC-based traits is 0.50-0.60.
Table 1. Definitions of the four mastitis-related traits.
Trait name Definition of the trait Data type
Abscess (case-control)
The occurrence of mammary abscess of an individual during the first lactation.
Case/control (0: no abscess,
1: abscess)
Abscess (category)
The number of mammary abscesses found in the first lactation. (Animals with five or more than five mammary abscesses were all recorded by 5)
Categorical (0,1,2,3,4,5)
Infection Status
Infection status of individuals are determined by SCC in first lactation: Animals with SCC values higher than 300,000cells/mL were regarded as infected.
(method described in Bergonier et al. (2003) )
Case/control (0: healthy, 1: infected)
LSCS Lactation Mean SCS during first lactation. Continuous
The phenotype data recorded from clinical examinations were filtered before being used in the data analysis: (1) For trait Abscess(case-control), animals with at least three clinical examinations were included in the dataset. Animals were recorded as “1” (case) when examinations detected at least twice the presence of abscess, while animals were recorded as “0” (control) when they were examined healthy (without any abscess) at least three times by examinations. (2) For trait Abscess(category), animals with at least three clinical examinations were included. The number of mammary abscess was used in phenotyping this trait. (3) For trait infection status, the prediction of the infection status of an individual was determined by the SCC values from the repeated SCC measures over lactation (6 measures over a lactation). Animals in any measure with SCC value higher than 300,000cells/mL were regarded as “infected” animals. The infection status from the second lactation (L2) was introduced to check the result from the first lactation (L1): animals were recorded as “1” (infected) when they were detected “infected” in L1 and “not healthy” in L2; Animals were recorded as “0” (healthy) when they were recorded as “healthy” in L1 and “not infected” in L2; Animals with other phenotypes were recorded as “doubtful” and not included in the
- 11 -
data analysis. (3) For trait LSCS, all animals with lactation mean SCC in first lactation (LSCS during L1) were included in the dataset. After data filtering, the number of animals included in the analysis is described in Table 2, as well as the number of cases and controls and controls, and the animals’ distribution in SCC+/SCC- lines (Table 2).
Table 2. The number of individuals and the number of cases/controls in each trait. Within brackets give the distributions of individuals within two SCC lines in the population.
Trait No. of animals
(SCC-/SCC+) No. of cases (SCC-/SCC+) No. of controls (SCC-/SCC+) Abscess(case-control) 137 (74/63) 20 (2/18) 117 (72/45) Abscess(category) 1 158 (80/78) 41 (8/33) 117 (72/45) Infection Status 172 (109/63) 40 (8/32) 132 (101/31) LSCS 2 281 (152/129) --- ---
1: Abscess(category) is not a case-control trait. Here the “No. of cases” indicates the numbers of animals with none-zero numbers of abscesses, and “No. of controls” indicates the number of animals with no abscess.
2: LSCS contains continuous data indicating the mean value of SCC in L1, which is not a case-control trait.
Genotypes and Quality Control
Genotyping was performed using the Illumina Ovine SNP50 BeadChip on the Labogena platform according to the manufacturer’s standard procedures (Illumina, San Diego, CA, USA). In quality control, samples were included in the analysis if call rates (percentage of SNP genotyped for an individual) > 95%. Genotypes were included if the SNP marker passed a quality threshold of call frequency > 97%, minor allele frequency (MAF) > 0.01, Mendelian error < 0.025, and markers’ distribution followed Hardy-Weinberg equilibrium. After quality control, 43,445 SNPs (80% of the total SNPs) passed the quality filtering from a total 54,241 markers. Markers were distributed on all 26 chromosomes, and the average distance between two SNPs was 0.0629 Mb. In total, 334 ewes genotyped in this divergent population were included in the analysis of mastitis-related traits.
- 12 -
Statistical Analysis
Statistical analysis was performed separately for the 4 traits for both GWAS and haplotype-based association.
Genome-wide association study (GWAS)
A GWAS was performed based on a linear mixed model including the additive SNP effect as a fixed effect, and the polygenic effect as a random effect.
y = + Xb + Zu + e
Where y is the vector of observations; is the overall mean; b is the vector of fixed SNP effect (allele effect of SNP); X is the incidence matrix of b corresponding SNP effects to individuals. The random polygenic effect u was included to account for the family structure in the data. u was assumed following u ~N (0, Aða2) where A is the
relationship matrix based on pedigree information. Z is the incidence matrix of u, accounting for pedigree relationship structure among individuals. e is the random residual effect following e ~N (0, Iðe2 ) where I is the identity matrix.
Restricted maximum likelihood (REML) was applied to solve the model by using ASReml (Gilmour et al. 2009). SNP effects of all 43,445 SNPs were calculated, and T-test was performed to calculate the -log10(p-value) of each SNP effect. In significance
test, Bonferroni correction (significance threshold = -log10(α/Nbsnp)) was applied to
α=5% for both genome-wise and chromosome-wise thresholds in order to correct the bias from multiple testing.
In addition, a Quantile-Quantile plot (QQ plot) was performed to check the distributions of test-statistics, in order to detecte the “goodness of fitting” of this model. Our dataset includes several sire families in the population, which may produce population stratification leading to unexpected false positives in the association result.
- 13 -
A polygenic effect was therefore included in the mixed model to correct for the population structure. QQ plot was used here to detect the fitting of the model, especially for the goodness of fitting the population structure into the model.
Haplotype-based Association Study
Haplotype reconstruction and clustering was based on the method from Druet & Georges (2010) using PHASEBOOK Software. PHASEBOOK is a package of four haplotyping programs: LinkPHASE, HiddenPHASE, DualPHASE and DAGPHASE (Druet & Georges 2010). Haplotype reconstruction and clustering were performed following the procedures below:
1. Genotype data from 334 individuals was partially phased by LinkPHASE based on familial information (Mendelian segregation rules and linkage information). 2. The unphased missing alleles from Step 1 were randomly sampled by DAGPHASE.
The sampling output was used by BEAGLE program to create a directed acyclic graph (DAG) which indicates a summary of localized haplotype clusters (Browning & Browning 2007).
3. A Hidden Markov Model (HMM) (Scheet & Stephens 2006) was used in DAGPHASE to sample missing alleles in base haplotypes from the previous DAG. The sampling result was output into BEAGLE to generate an improved DAG. This process was performed iteratively between DAGPHASE and BEAGLE to generate improved DAG, until the last DAG was constructed and output as the most-likely haplotype clusters.
Specifically for the third step, sampling parameters are required to set by users for running BEAGLE. There was controversy in setting the value of parameter “scale” according to the previous studies (Browning 2006; Browning & Browning 2007; Druet & Georges 2010). Parameter “scale” was reported to be related to “the number of
- 14 -
samplings per individual” in BEAGLE sampling (Browning & Browning 2007). In this study, two values of “scale” (scale=4.0 and scale=2.0) were tried according to previous studies, in order to detect a better setting of “scale” and the influence of parameter setting on haplotype reconstruction in a small data set like this study.
This phasing algorithm involved iteratively sampling haplotypes and assigning reconstructed haplotypes to a limited number of “localized haplotype clusters” called “hidden clusters”. In this case, the “hidden cluster” value of a marker represents the haplotype cluster this marker belongs to, and markers originating from the same haplotype were denoted by the same hidden cluster value. Therefore, for the total 43,445 SNPs, each SNP may have several hidden clusters indicating several haplotypes existing at this marker. For association analysis, it was these hidden clusters seen as the haplotype type at each marker that directly fit the mixed model for REML calculation.
The mixed model used for this haplotype-based association was identical to that in GWAS except that a haplotype effect (or hidden cluster effect) was fitted instead of a SNP effect in the model.
y = + Wβ + Zu + e
Where y is the vector of observations; is the overall mean; β is the vector of haplotype effect (hidden cluster effect); W is the incidence matrix of β corresponding haplotype effects to individuals. The random polygenic effect u was included to account for the family structure as it was in GWAS. Z is the incidence matrix of u, accounting for pedigree relationship structure among individuals. e is the random residual effect following e ~N (0, Iðe2 ) where I is the identity matrix.
Restricted maximum likelihood (REML) was applied to solve the model using ASReml (Gilmour et al. 2009). The haplotype effects of all haplotyopes at all markers were calculated. An F-test was performed for significance test, with Bonferroni correction
- 15 -
-log10 (Expected P) -log10 (Expected P) -log10 (Expected P) -log10 (Expected P)
-lo g 10 (O bs er ved P ) -lo g 10 (O bs er ved P ) -lo g 10 (O bs er ved P ) -lo g 10 (O bs er ved P ) -lo g 10 (O bs er ved P ) -lo g 10 (O bs er ved P ) -lo g 10 (O bs er ved P ) -lo g 10 (O bs er ved P )
-log10 (Expected P) -log10 (Expected P) -log10 (Expected P) -log10 (Expected P)
applied to α=5% to correct the bias from multiple testing. As previously described in GWAS, QQ plot was performed to check the “goodness of fitting” of the model.
Results
Validation of test-statistics: QQ-plot
Figure 1 gives the QQ plots for four mastitis-related traits obtained in both GWAS and Haplotype-based association. The four plots from haplotype-based association were all based on haplotype reconstruction with phasing parameter “scale” =4.0. The QQ plot of phasing with scale=2.0 showed severe false positives in markers’ distribution (Figure 6 in discussion), whose mapping result was discarded in this study in order to maintain the accuracy of association. Therfore, “scale”=4.0 was regarded as a better setting of parameter in this study, and the followed results from haplotype-based association were all based on scale=4.0.
Figure 1. QQ plots of –log10P resulting from GWAS (first line) and Haplotype-based Association (second
line) for traits: Abscess(case-control), Abscess(category), Infect status, LSCS, from left to right within each line. The red diagonal line is the standard y=x, representing Observed p-values = Expected p-values following null hypothesis. Dots on this line or very close to it represent SNPs that follow null hypothesis with no significant association with the trait. Dots obviously deviated from this line correspond to SNPs that disobey null hypothesis and were significant SNPs.
- 16 -
According to Figure 1, all plots gave reasonable distributions of p-values of markers, with major SNPs following null hypothesis and only a few deviated SNPs indicating significant SNPs. This result indicated a good correction of population stratification in our model-based association.
However, false positives may still exist in our analysis: In both GWAS and Haplotype-based association, plots of abscess traits (Abscess(case-control), Abscess(category)) show slight over-estimation of p-values of a few markers, which may lead to presence of false positives in the test-statistics. This infers a certain degree of fitting problem of our model, which may come from the definition of the model itself, or due to the limited number of animals and cases in abscess traits.
QTL mapping and potential QTL regions
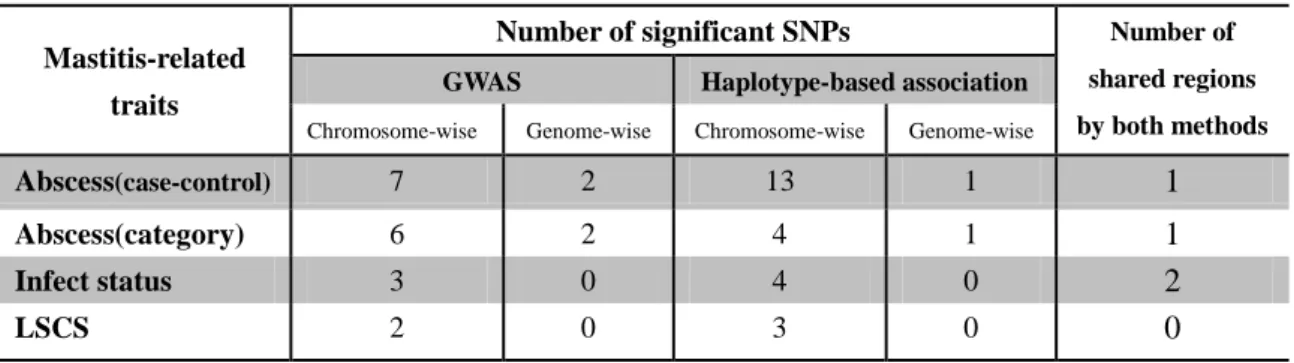
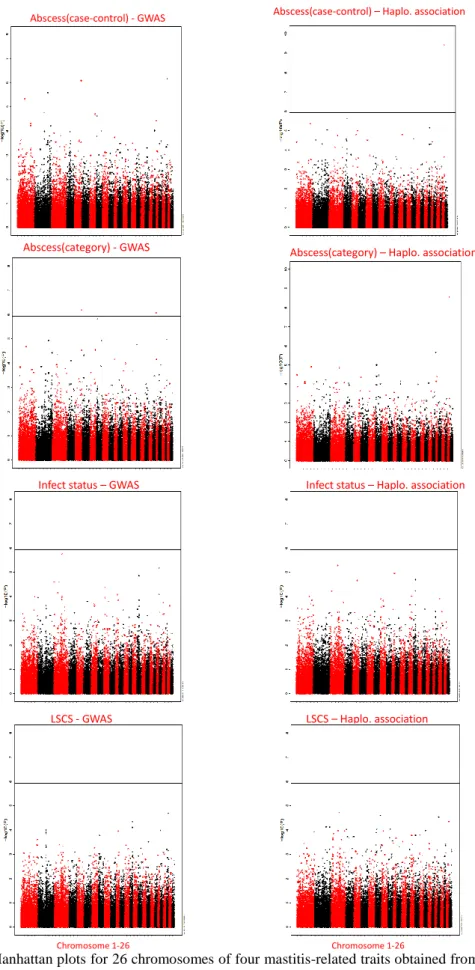
The result of QTL mapping was summarized in Table 3. In GWAS, 14 chromosome-wise significant SNPs over 11 chromosomes were detected, within which 3 are genome-wise significant SNPs separately distributed on OAR5, OAR21, OAR24. In haplotype-based association, 24 chromosome-wise significant SNPs over 13 chromosomes were detected, with 1 genome-wise significant SNP on OAR25. Among all these regions, 4 regions were found significant in both association methods (Table 3). These 4 regions shared by both methods were thought to be candidate QTLs for their respective traits. The details of these 4 interesting regions were described below trait by trait. Manhattan plots of all traits for both association methods are shown in Figure 2.
Table 3. Summary of significant SNPs detected in GWAS and Haplotype-based association.
Mastitis-related traits
Number of significant SNPs Number of
shared regions by both methods
GWAS Haplotype-based association
Chromosome-wise Genome-wise Chromosome-wise Genome-wise
Abscess(case-control) 7 2 13 1 1
Abscess(category) 6 2 4 1 1
Infect status 3 0 4 0 2
- 17 -
Abscess(category) - GWAS Abscess(category) – Haplo. association Infect status - GWAS
Chromosome 1- 26 Infect status – Haplo. association
LSCS - GWAS LSCS – Haplo. association
Abscess(case-control) - GWAS Abscess(case-control) – Haplo. association
Infect status – GWAS
Chromosome 1-26 Chromosome 1-26
Figure 2. Manhattan plots for 26 chromosomes of four mastitis-related traits obtained from GWAS and Haplotype-based association. The horizontal line in each plot describes the genome-wise significance threshold –log10(p-value)=5.94 after Bonferroni correction.
- 18 -
Mammary abscess traits: Abscess(case-control) and Abscess(category)
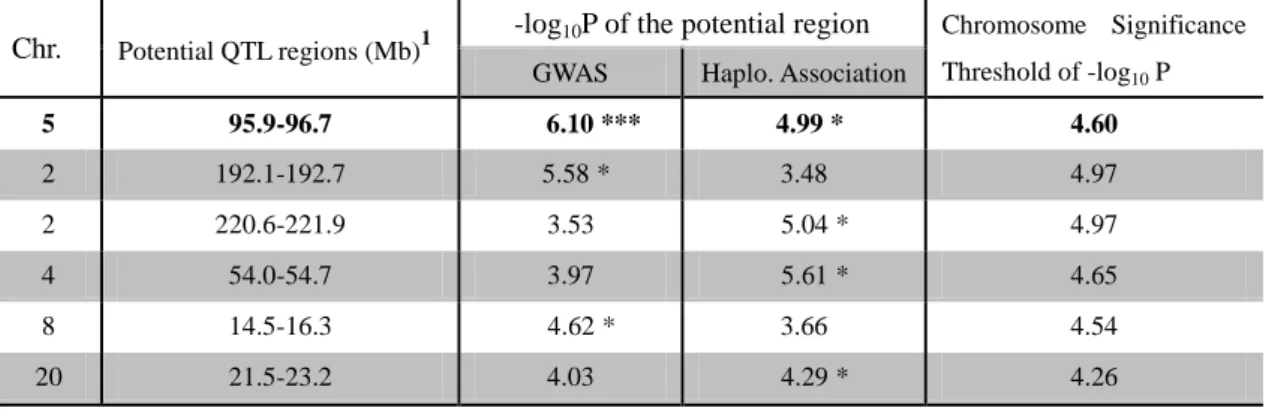
For Abscess(case-control), region 95.9-96.7 Mb on OAR5 was detected in both methods significantly associated with mammary abscess in Lacaune sheep (Table 4). In addition, there are also 5 regions on OAR2, 4, 8, 20 which showed significance in one method and moderate p-values in the other method. Since Bonferroni correction is generally a serious method in significance testing, these 5 regions may also be interesting in affecting mammary abscess but need further validation.
Table 4. Potential QTL regions in Abscess(case-control) from GWAS and Haplotype-based association. The line in bold shows the region significant in both association methods.
Chr. Potential QTL regions (Mb)1
-log10P of the potential region Chromosome Significance
Threshold of -log10 P
GWAS Haplo. Association
5 95.9-96.7 6.10 *** 4.99 * 4.60 2 192.1-192.7 5.58 * 3.48 4.97 2 220.6-221.9 3.53 5.04 * 4.97 4 54.0-54.7 3.97 5.61 * 4.65 8 14.5-16.3 4.62 * 3.66 4.54 20 21.5-23.2 4.03 4.29 * 4.26
***: genome-wise significance *: chromosome-wise significance
1: The intervals of the QTLs were defined based on the QTL regions found in two association methods.
For trait Abscess(category), region 14.5-16.6 Mb on OAR8 was detected in both methods significantly associated with mammary abscess (Table 5). Other 2 regions on OAR5 and OAR8 are also interesting for abscess since they were detected significant in GWAS and showed moderate p-values in Haplotype association.
Table 5. Potential QTL regions in Abscess(category) from GWAS and Haplotype association. The line in bold shows the region significant in two association methods.
***: genome-wise significance *: chromosome-wise significance
1: The intervals of the QTLs were defined based on the QTL regions found in two association methods.
Chr. Potential QTL regions (Mb)1
-log10 P Chromosome Significance
Threshold of -log10 P
GWAS Haplo. Association
8 14.5-16.6 5.81 * 5.00 * 4.54
5 96.1-96.7 6.18 *** 3.63 4.60
- 19 -
Abscess(case-control):OAR5 - GWAS
Abscess(category): OAR8 - GWAS Abscess(category): OAR8 – Haplo. association
Abscess(category): OAR5 – Haplo. association
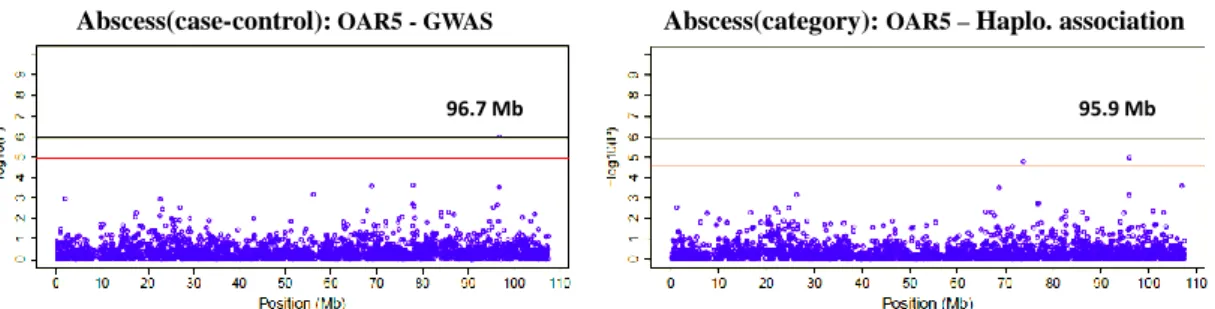
By horizontally comparing the results from Abscess(case-control) and Abscess(category) (Table 4 & Table 5), it is interesting to find that the two regions, 95.9-96.7 Mb on OAR5 and 14.5-16.6 Mb on OAR8, were shared by both these two abscess traits as significant regions for QTLs. This may infer a general relationship between these two regions and mammary abscess in Lacaune sheep. Figure 3 and Figure 4 show the Manhattan plots of these two candidate regions on their chromosomes, respectively.
Figure 3. Manhattan plots on OAR5 for Trait Abscess(case-control): Region 95.9-96.7Mb showed significant association with Abscess(case-control) in both GWAS and Haplotype association. The black line indicates the genome-wise significance threshold, and the red line indicates the chromosome-wise significance threshold.
Figure 4. Manhattan plots on OAR8 for Trait Abscess(category): Region 14.5-16.6 Mb showed potential association with Abscess(category) in both GWAS and Haplotype-based association. The black line indicates the genome-wise significance threshold, and the red line indicates the chromosome-wise significance threshold.
Apart from the shared regions by the two association methods, haplotype-based association detected two other regions that had been validated by previous QTL detection projects on LSCS trait in Lacaune sheep (Rupp et al., 2011; unpublished paper, 2013). These two regions were detected associated with two mammary abscess traits (from haplotype-based association) and LSCS trait, which infer themselves as
16.6 Mb 14.5-14.6 Mb
- 20 -
general QTLs underlying mastitis infection. Table 6 gives the information of these two QTLs detected in this study and in previous study.
Table 6. Validated QTLs detected from haplotype-based association in this study.
*: chromosome-wise significance.
a: GWAS analysis from 1000 Lacaune AI sires for LSCS trait, SheepSNPQTL Project (ANR; final report) (Rupp et al. 2012).
Somatic Cell Count traits: Infect status and LSCS
For trait Infect status, two regions on OAR3 and OAR16 were detected significantly associated with mastitis infection from both association methods (Table 7). The two candidate regions were shown in Figure 5. Specifically, the candidate region on OAR16 was very close to the region detected previously in mammary abscess on OAR16 which is also inside the validated QTL region reported by (Rupp et al. 2012). This region, around 30Mb on OAR6, has been detected three times significantly associated with different mastitis-related traits (mammary abscess, infection status, LSCS), inferring a big possibility of existence of QTL highly associated with mastitis around 30Mb on OAR16. Figure 5 shows the Manhattan plots of these two candidate regions.
Table 7. Potential QTL regions in Infect status from both GWAS and Haplotype association mapping. Chr. Potential QTL regions (Mb) -log10 P Chromosome Significance
Threshold of -log10 P
GWAS Haplo. Association
3 117.2-117.5 5.76 * 5.28 * 4.92
16 27.3-29.7 a 4.86 * 4.70 * 4.41
*: chromosome-wise significance
a: The region lies very close to the validated QTL found in GWAS analysis from 1000 Lacaune AI sires for LSCS trait, SheepSNPQTL Project (ANR; final report) (Rupp et al. 2012).
Chr.
Haplotype-based association in this study Previous study a
Trait Potential QTL regions (Mb) Trait Potential QTL regions (Mb)
16 Abscess(case-control)
Abscess(category) 31.1-31.8 * LSCS 29-36
20 Abscess(case-control)
- 21 -
Infect status: OAR3 - GWAS Infect status: OAR3 – Haplo. association
Infect status: OAR16 - GWAS Infect status: OAR16 – Haplo. association
Figure 5. Manhattan plots on OAR3 and OAR16 for Trait Infect status: Region 117.2-117.5Mb on OAR3, 27.3-29.7Mb on OAR16 showed significant association with infection status in both GWAS and Haplotype-based association. The black line indicates the genome-wise significance threshold, and the red line indicates the chromosome-wise significance threshold.
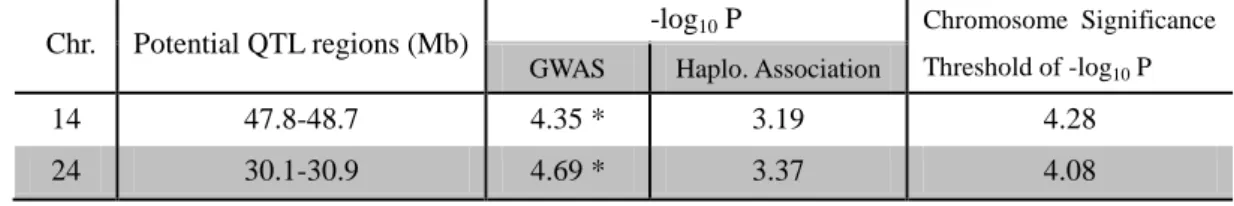
For trait LSCS, no significant region was detected shared by the two association methods. There are 2 SNPs respectively on OAR14 and OAR24 that were found significant in GWAS and showed moderate p-values in haplotype association, which may be interesting but needs to be further checked by other studies (Table 8).
Table 8. Potential QTL regions in LSCS from both GWAS and Haplotype association mapping. Chr. Potential QTL regions (Mb) -log10 P Chromosome Significance
Threshold of -log10 P
GWAS Haplo. Association
14 47.8-48.7 4.35 * 3.19 4.28
24 30.1-30.9 4.69 * 3.37 4.08
*: chromosome-wise significance
117.5 Mb 117.2 Mb
- 22 -
Discussion
Complexity of genetic determinism of mastitis and fine-phenotyping of
mastitis-related traits
In summary, five interesting regions were detected in this study to be significantly associated with mastitis-related traits (Table 9).
Table 9. A summary of interesting regions detected in this study as candidate QTLs for mastitis.
a: GWAS analysis from 1000 Lacaune AI sires for LSCS trait, SheepSNPQTL Project (ANR; final report) (Rupp et al. 2012).
Among these five regions, the region on OAR16 (around 30Mb) is shared by three mastitis-related traits detected from this study and previous study both on Lacaune sheep. This result indicated a big possibility of existence of a candidate QTL around 30Mb on OAR16 highly related to general mastitis infection. In addition, the region on OAR20 is also very interesting since it has been detected both related to SCC-based trait and mammary abscess trait, which also infers a general association with the mastitis. Moreover, sheep MHC Class I and Class II genes are reported partly located around 25Mb - 27Mb on OAR20 (Sheep Genome Browser;
http://www.livestockgenomics.csiro.au/cgi-bin/gbrowse/oarv3.1/). Since loci on the same chromosome are generally in different extents of linkage, further study can be carried out to explore the genetic linkage between MHC loci and the regions detected in
Chr. This study Previous study
a
Trait Potential QTL regions (Mb) Trait Potential QTL regions (Mb)
3 Infection status 117.2-117.5 --- --- 5 Mammary abscess 95.9-96.7 --- --- 8 Mammary abscess 14.5-16.6 --- --- 16 Mammary abscess Infection status 31.1-31.8 27.3-29.7 LSCS 29-36 20 Mammary abscess 49.1-49.5 LSCS 49.1-50.6
- 23 -
this study on OAR20 (49.1 – 49.5Mb). In addition, two regions on OAR5 and OAR8 were detected specifically related to mammary abscess. This may infer a specific immune pathway of forming mammary abscess in response to chronic mastitis.
However, due to the limited number of cases in abscess traits in our dataset (20 cases in Ascess (case-control) and 41 cases in abscess (category)), the power of QTL mapping may be not high enough to detect medium and small QTLs for abscess in this study. More animals and cases are needed in order to detect more QTLs for abscess and at the same time check the obained two regions on OAR5 and OAR8.
Mastitis is a complex disease with variable pathogens, diverse clinical symptoms, and dynamic immune interactions. This infers its complexity in clarifying genetic basis of mastitis, especially with small population size and non-dense markers. From this study 5 chromosomes (OAR3, 5, 8, 16, 20) were detected containing very interesting QTLs associated with mastitis. According to previous QTL studies on sheep mastitis, putative QTLs of SCC were also built on OAR2, 6, 10, 14, 17, 22 (Árnyasi et al. 2009; Jonas et al. 2011; Raadsma et al. 2009), which means that at least 10 chromosomes could be included underlying genetic basis of sheep mastitis. The fact is that different mastitis-related traits explain different parts of genetic basis of mastitis since mastitis is a complex disease with diverse symptoms and dynamic immune interactions. The choice of phenotypes has obvious influence on the result of QTL mapping, and it is very difficult to give a whole picture of genetic basis of mastitis simply by one phenotype.
As the key symptom of chronic mastitis, mammary abscess provides valuable phenotypic material in exploring genetic determinism of mastitis, as an important supplement of QTL detection from SCC traits. Two candidate QTLs on OAR5 and OAR8 were built in this study. More studies based on different methods and from different sheep breeds should be carried out to validate these two regions and to find more QTLs underlying mammary abscess. In addition, genetic parameters of mammary abscess should be studied to detect its heritability and genetic correlation with mastitis.
- 24 -
Fine-phenotyping of SCC traits offers another way in better phenotyping mastitis. In this study, no SNPs were found shared by LSCS and Infect status although they are both based on SCC. The reason is probably due to their big difference in selecting SCC data in defining trait: Infect status defines infection status of mastitis by case-control trait derived from extreme values of SCC observations, while LSCS defines trait using continuous data by averaging all SCC observations obtained over the first lactation. This result infers a big influence on explaining genetic determinism of mastitis when using different methods in phenotyping SCC data. Generally, traits based on SCC are defined by SCC observations during different lactation periods, e.g., test-day SCC, average SCC during 1st lactation or during first two lactations. Infect status is another way of using SCC data, by setting a specific SCC value as the threshold of defining infection status of individuals (Bergonier et al. 2003). The variety of SCC-based traits can be seen as fine-phenotyping of SCC phenotype, which opens a way to explore the best method in defining SCC in association with mastitis. Different SCC-based traits may give different complexity and accuracy in profiling genetic basis of mastitis.
GWAS and Haplotype-based Association
For QTL detection, genome-wide association mapping has been popularly used in animal genetics. Genome wide association study (GWAS) is considered to be more powerful than linkage analysis (LA) for good prediction of localization and detection of effects of common alleles with small effects, but is less powerful when traits have a complex genetic determination, including epistasis (Grindflek et al. 2011). GWAS uses linkage disequilibrium between markers and causative QTLs to detect the potential association between markers and phenotypes. Significant markers indicate the existence of QTLs that are in high LD with these markers. GWAS assumes the independence of markers, ignoring the genetic linkage between all SNPs, which may cause false positives because markers are truly linked with each other and their linkage disequilibria are very variable (Grindflek et al. 2011). In comparison, haplotype-based
- 25 -
association uses phased haplotype clusters in association, which takes account of the linkage between markers and may reduce some false positives in mapping. Therefore, in this study genotyping data was analyzed simultaneously with GWAS and the haplotype-based association.
According to the results from the two association methods, a few significant regions were found shared by both associations. It is very difficult to say which method gave better results without further validation. But when comparing the results from both associations with known putative QTLs found by previous studies, haplotype-based association tended to successfully detect more putative QTLs. This may infer a stronger power and robustness of haplotype-based association in QTL detection, but it doesn’t mean this method is powerful enough to give a whole picture of the associated QTLs. Since haplotype-based association is based on clustered haplotypes, the robustness of haplotype-based association is also highly affected by the accuracy of haplotyping reconstruction. By contrast, GWAS ignores marker linkage and generally detects more common alleles with small effects, but may contain some false positives. Therefore, it is recommended that GWAS and haplotype-based association are used simultaneously in genome-wide association as a confirmation and supplement between each other.
Haplotype reconstruction
Generally, haplotypes can be reconstructed from unphased genotypes by using either familial information (Mendelian segregation and linkage) and/or population information (LD) (Windig & Meuwissen 2004; Scheet & Stephens 2006; Kong et al. 2008). From previous studies, phasing has been mainly relied on familiar information from pedigree (Windig & Meuwissen 2004), which phasing leaves nonnegligible proportion of unphased genotypes, especially for the less connected individuals (Druet & Georges 2010). After phasing, IBD probabilities are calculated for each pair of base haplotypes on the identity-by-state (IBS) status of neighborhood markers using a
- 26 -
window of a specific number of flanking markers. Haplotype clusters are further grouped based on these IBD probabilities (Meuwissen & Goddard 2001). Using this “standard” method for haplotype reconstruction, the accuracy of haplotyping is limited due to the partially unphased genotypes, and it can be very time-consuming because of the calculation of IBD probabilities, especially with high-dense SNP chips (Druet & Georges 2010).
In this study, a more efficient approach based on Hidden Markov Model (HMM) (Scheet & Stephens 2006) was used for haplotyope reconstruction (Druet & Georges 2010). In this approach, phasing is firstly done by using familial information, as it is in the standard method, to generate partially phased genotypes due to the missing alleles. Afterwards, missing alleles are imputed, phased and clustered into haplotypes together with other phased data, which process is performed iteratively based on the Hidden Markov Model to continuously improve the estimation of haplotype clusters. Being based on the Hidden Markov Model, this method assigns reconstructed haplotypes to a limited number of hidden clusters which can be directly used for QTL mapping in a mixed model/REML setting (Druet & Georges 2010). This approach can be performed easily by using a software set of PHASEBOOK, with the basic reconstruction process including: (1) Phasing based on familial information by LinkPHASE; (2) DAGPHASE and BEAGLE were run to randomly attribute missing alleles and create a directed acrylic graph (DAG) indicating a summary of localized haplotype clusters; (3) DAGPHASE and BEAGLE were run iteratively based on HMM to sample missing alleles in base haplotypes and construct improved DAG.
One important feature of this method is that it allows accurate imputation of missing genotypes, which increases the effective coverage of phasing data and improves the accuracy of haplotyping (Druet & Georges 2010). The other important advantage of this method is its substantial improvement in computation efficiency than the available standard method using IBD probabilities (Druet & Georges 2010).
- 27 - -lo g 10 (O bs er ved P ) -lo g 10 (O bs er ved P ) -lo g 10 (O bs er ved P ) -lo g 10 (O bs er ved P )
-log10 (Expected P) -log10 (Expected P) -log10 (Expected P) -log10 (Expected P)
-lo g 10 (O b ser ved P ) -lo g 10 (O b ser ved P ) -lo g 10 (O b ser ved P ) -lo g 10 (O b ser ved P )
In haplotyping reconstruction, one more attention should be paid to the parameter setting in using BEAGLE (Browning & Browning 2007). BEAGLE is a phasing program used together with DAGPHASE to iteratively sample phased haplotypes and construct improved DAG. There are three parameters needed to be set by users before running BEAGLE: “iteration”, “scale” and “shift”. The parameters of “iteration” and “shift” were set to 10 and 0.0 respectively, according to the instruction from Browning & Browning(2007). For parameter “scale”, it is said to be positively related to “the number of samples per individual performed in BEAGLE sampling”, i.e., larger value of scale indicates more samplings per individual (Browning & Browning 2007). Previous studies showed controversy on setting the parameter of scale: 1.0 (Browning 2006), 2.0 (Druet & Georges 2010), and 4.0 (Browning & Browning 2007). In order to maintain a high accuracy of phasing, scale=2.0 and scale=4.0 were tried in this study since generally more samplings per individual brings higher accuracy. Figure 6 gives the QQ plots generated from QTL mapping (for trait Infect status) based on scale=2.0 and scale=4.0, respectively.
Figure 6. QQ plots of QTL mapping based on phasing with scale=2.0 (first line) and scale=4.0 (second line) for traits: Abscess(case-control), Abscess(category), Infect status, LSCS, from left to right within each line.
It is clear that more false positives appear from phasing with scale=2, which proves a significant influence of parameter setting when using this method for haplotyping
- 28 -
reconstruction. In conclusion, in small dataset like this study, “scale” should be set to at least 4 in order to ensure the accuracy of phasing. Larger “scale” value may increase phasing accuracy to some extent, but also increase computation time. A good balance should be taken considering the size of dataset as well as the possible extent of increase in accuracy.
Conclusion
This study introduced the concept of fine-phenotyping of mastitis by including two mammary abscess traits and two SCC-based traits. Association methods include both Genome-wide association mapping using independent markers, and Genome-wide Haplotype-based association mapping using phased haplotype clusters. The result indicated five interesting regions respectively positioned on OAR3, 5, 8, 16, 20 which were respectively associated with different mastitis-related traits. Among the five regions, OAR16 was believed to have a big possibility of existence of a QTL around 30Mb since this region were detected associated with three mastitis-related traits. Region 49.1-49.5Mb on OAR20 was also very interesting for general presence of mastitis of mastitis since it was detected both in SCC-based trait and mammary abscess trait. Regions on OAR5 and OAR8 were found to be specifically related to mammary abscess, which may infer a specific immune pathway of forming mammary abscess in response to chronic clinical mastitis.
The widely-distributed QTLs and the variable genetic basis between mastitis-related traits infer the genetic complexity of mastitis. The general solutions to this problem can be introducing more mastitis-related phenotypes, fine-phenotyping of available mastitis-related traits, fine-mapping of candidate regions by denser markers, and QTL validation from multidisciplinary mapping approaches. This study introduced mammary abscess as a new phenotype for mastitis and detected two candidate QTLs
- 29 -
highly associated with this phenotype. Due to the complexity of genetic determinisms of mastitis, the introduction of abscess and other mastitis-related phenotypes can be very useful in better explaining mastitis. Moreover, by combining QTL mapping results from different mastitis traits, more accurate QTL locations or causative mutations can be confirmed and can be further studied on their immune mechanisms in mastitis susceptibility or resistance in dairy sheep. In addition, validated QTLs related to mastitis infection can be applied into Marker Assisted Selection (MAS) for selecting animals with stronger resistance to mastitis.
Acknowledgement
This master thesis was under the supervision of Rachel RUPP who gave me many help and great guidance during my study in INRA(Toulouse). I also received very kind help from Anne RACARD for the method of haplotype-based association. Here I give my sincere thanks to them for their precious help. I also thank the director and personnel of SAGA to welcoming me in the lab and all EMABG teachers helping to manage all the things for my thesis.
- 30 -
References
Ali, A.K.A. & Shook, G.E. (1980) An Optimum Transformation for Somatic Cell Concentration in Milk1. Journal of dairy science, 63(3), pp.487–490.
Árnyasi, M., Komlósi, I., Lien, S., Czeglédi, L., Nagy, S., Jávor, A. (2009) Searching for DNA markers for milk production and composition on chromosome 6 in sheep.
Journal of Animal Breeding and Genetics, 126(2), pp.142–147.
Barillet, F., Rupp, R., Mignon-Grasteau, S., Astruc, J. M., Jacquin, M. (2001) Genetic analysis for mastitis resistance and milk somatic cell score in French Lacaune dairy sheep. Genetics, selection, evolution : GSE, 33(4), pp.397–415.
Bergonier, D., Crémoux, Renée de., Rupp, R., Lagriffoul, Gilles., Berthelot, Xavier. (2003) Mastitis of dairy small ruminants. Vet. Res., 34(5), pp.689–716.
Browning, S.R., 2006. Multilocus Association Mapping Using Variable-Length Markov Chains. American journal of human genetics, 78(6), pp.903–913. Browning, S.R. & Browning, B.L., 2007. Rapid and Accurate Haplotype Phasing and
Missing-Data Inference for Whole-Genome Association Studies By Use of Localized Haplotype Clustering. American journal of human genetics, 81(5), pp.1084–1097.
Burriel, A.R., 1997. Dynamics of intramammary infection in the sheep caused by coagulase-negative staphylococci and its influence on udder tissue and milk composition. Vet Rec, 140, pp.419–423.
Carlén, E., Strandberg, E. & Roth, a, 2004. Genetic parameters for clinical mastitis, somatic cell score, and production in the first three lactations of Swedish holstein cows. Journal of dairy science, 87(9), pp.3062–70. A
Coulon, Jean-B., Gasqui, Patrick., Barnouin, J., Ollier, A., Pradel, P., Pomiès,D. (2002) Effect of mastitis and related-germ on milk yield and composition during
naturally-occurring udder infections in dairy cows. Anim. Res., 51(05), pp.383–393.
Davies, G., Genini, S., Bishop, S. C., Giuffra, E. (2009) An assessment of opportunities to dissect host genetic variation in resistance to infectious diseases in livestock.
animal, 3(03), pp.415–436.
Druet, T. & Georges, M., 2010. A hidden markov model combining linkage and linkage disequilibrium information for haplotype reconstruction and quantitative trait locus fine mapping. Genetics, 184(3), pp.789–98.
- 31 -
El-Saied, U. M., Carriedo, J. A., De La Fuente, L. F., San Primitivo, F. (1999) Genetic Parameters of Lactation Cell Counts and Milk and Protein Yields in Dairy Ewes.
Journal of Dairy Science, 82(3), pp.639–644.
Gilmour, A.R., Gogel, B.J., Cullis, B.R., and Thompson, R., 2009. ASReml User Guide Release 3.0. Available at: www.vsni.co.uk.
Grindflek, E., Lien, S., Hamland, H., Hansen, M., Kent, M., van Son, M., Meuwissen, T. (2011) Large scale genome-wide association and LDLA mapping study
identifies QTLs for boar taint and related sex steroids. BMC Genomics, 12(1), p.362.
Harmon, R.J., 1994. Physiology of Mastitis and Factors Affecting Somatic Cell Counts.
Journal of Dairy Science, 77(7), pp.2103–2112.
Heringstad, B., Gianola, D., Chang, Y. M., Ødegård, J., Klemetsdal, G. (2006) Genetic Associations Between Clinical Mastitis and Somatic Cell Score in Early
First-Lactation Cows. Journal of Dairy Science, 89(6), pp.2236–2244.
Heringstad, B., Klemetsdal, G. & Ruane, J., 2000. Selection for mastitis resistance in dairy cattle: a review with focus on the situation in the Nordic countries. Livestock
Production Science, 64(2-3), pp.95–106.
Hogarth, C. J., Fitzpatrick, J. L., Nolan, A. M., Young, F. J., Pitt, A., Eckersall, P. D. (2004) Differential protein composition of bovine whey: A comparison of whey from healthy animals and from those with clinical mastitis. PROTEOMICS, 4(7), pp.2094–2100.
Jonas, E., Thomson, P., Hall, E., McGill, D., Lam, M., Raadsma, H. (2011) Mapping quantitative trait loci (QTL) in sheep. IV. Analysis of lactation persistency and extended lactation traits in sheep. Genetics Selection Evolution, 43(1), p.22. Koivula, M., Mäntysaari, E. A., Negussie, E., Serenius, T. (2005) Genetic and
Phenotypic Relationships Among Milk Yield and Somatic Cell Count Before and After Clinical Mastitis. Journal of Dairy Science, 88(2), pp.827–833.
Kong, A., Masson, G., Frigge, M. L., Gylfason, A., Zusmanovich, P., Thorleifsson,G., Olason, P. I., Ingason, A., Steinberg, S., Rafnar, T., Sulem, P., Mouy, M., Jonsson, F.,Thorsteinsdottir, U., Gudbjartsson, D. F., Stefansson, H.,Stefansson, K. (2008)
Detection of sharing by descent, long-range phasing and haplotype imputation. Nat
Genet, 40(9), pp.1068–1075.
Leitner, G., Chaffer, M., Shamay, A., Shapiro, F., Merin, U., Ezra, E., Saran, A., Silanikove, N. (2004) Changes in Milk Composition as Affected by Subclinical Mastitis in Sheep. Journal of Dairy Science, 87(1), pp.46–52.
- 32 -
Ma, Y., Ryan, C., Barbano, D M., Galton, D M., Rudan, M a., Boor, K J. (2000) Effects of somatic cell count on quality and shelf-life of pasteurized fluid milk. Journal of
dairy science, 83(2), pp.264–74.
Marogna, G., Rolesu, S., Lollai, S., Tola, S., Leori, G. (2010) Clinical findings in sheep farms affected by recurrent bacterial mastitis. Small Ruminant Research, 88(2-3), pp.119–125.
Meuwissen, T.H. & Goddard, M.E., 2001. Prediction of identity by descent probabilities from marker-haplotypes. Genetics, selection, evolution : GSE, 33(6), pp.605–34.
Ødegård, J., Heringstad, B & Klemetsdal, G, 2004. Short communication: bivariate genetic analysis of clinical mastitis and somatic cell count in Norwegian dairy cattle. Journal of dairy science, 87(10), pp.3515–7.
Ogorevc, J., Kunej, T., Razpet, A., Dovc, P., (2009) Database of cattle candidate genes and genetic markers for milk production and mastitis. Animal genetics, 40(6), pp.832–51.
Raadsma, H., Jonas, E., McGill, D., Hobbs, M., Lam, M., Thomson, P. (2009) Mapping quantitative trait loci (QTL) in sheep. II. Meta-assembly and identification of novel QTL for milk production traits in sheep. Genetics Selection Evolution, 41(1), p.45.
Rupp, R., Lagriffoul, G., Astruc, J. M., Barillet, F. (2003) Genetic Parameters for Milk Somatic Cell Scores and Relationships with Production Traits in French Lacaune Dairy Sheep. Journal of Dairy Science, 86(4), pp.1476–1481.
Rupp, R., Bergonier, D., Dion, S., Hygonenq, M C.,Aurel, M R.,Robert-Granié, C., Foucras, G. (2009) Response to somatic cell count-based selection for mastitis resistance in a divergent selection experiment in sheep. Journal of Dairy Science, 92(3), pp.1203–1219.
Rupp, R.,Boichard, D.,Barbat, A.,Astruc, J M.,Lagriffoul, G.,Barillet, F. (2002)
Selection for mastitis resistance in French dairy sheep. 2002. Session 9.
Proceedings of the 7th World Congress on Genetics Applied to Livestock
Production, Montpellier, France, August, ed., Montpellier: Institut National de la Recherche Agronomique (INRA) LA - English.
Rupp, Rachel, 2012. Détection de QTL pour des caractères de résistance aux
mammites et de production laitière dans un dispositif petite fille de race ovine laitière Lacaune,
- 33 -
Rupp Rachel, B.D., 2007. Genetics of udder health in dairy ruminants. In EAAP
meeting, Dublin, 26-29 August 2007- Session 34. Dublin.
Rupp, Rachel & Boichard, Didier, 2003. Genetics of resistance to mastitis in dairy cattle. Veterinary research, 34(5), pp.671–688.
Rupp, R., Sallé,G.,Barillet, F., Larroque, H., Moreno-Romieux, C., 2011. Genome wide association study of somatic cell counts in a grand-daughter design of French Lacaune AI rams. In EAAP - 62nd Annual Meeting, Stavanger.
Scheet, P. & Stephens, M., 2006. A Fast and Flexible Statistical Model for Large-Scale Population Genotype Data: Applications to Inferring Missing Genotypes and Haplotypic Phase. The American Journal of Human Genetics, 78(4), pp.629–644. Wells, S J, Ott, S L & Hillberg Seitzinger, A., 1998. Key Health Issues for Dairy
Cattle—New and Old. Journal of Dairy Science, 81(11), pp.3029–3035. Available at: http://www.sciencedirect.com/science/article/pii/S0022030298758679.
Wells, S.J., Ott, S.L. & Hillberg Seitzinger, a., 1998. Key Health Issues for Dairy Cattle—New and Old. Journal of Dairy Science, 81(11), pp.3029–3035.
Windig, J.J. & Meuwissen, T H E, 2004. Rapid haplotype reconstruction in pedigrees with dense marker maps. Journal of Animal Breeding and Genetics, 121(1), pp.26–39.