An Artificial Neural Network Model for Predicting the CO2 Reactivity of Carbon Anodes
Used in the Primary Aluminum Production
Dipankar Bhattacharyay1, Duygu Kocaefe1* , Yasar Kocaefe1, Brigitte Morais2 1 UQAC/AAI Research Chair on Carbon and REGAL Aluminum Research Center
Department of Applied Sciences, University of Quebec at Chicoutimi, Chicoutimi, Québec, Canada1 2Aluminerie Alouette Inc, Sept-Îles, Québec, Canada2
*Corresponding author: email: [email protected], phone: 1 418 545 5011 ext 5215, fax: 1 418 545 5012
Abstract
Carbon anode is one of the key components for the electrolytic production of aluminum. It is mainly composed of calcined petroleum coke, coal tar pitch, and recycled carbon materials. The impurities in the raw materials, which are mainly by-products of different industries, influence significantly the quality of anodes. Usually, no well-known mathematical relationship exists between the various physical and chemical properties of raw materials and the final anode properties. In such situations, the artificial neural network (ANN) methods can serve as a useful tool to predict anode properties. In this study, published data have been used to show the proficiency of different artificial neural networks using the Matlab software. The average error between the predicted and experimental values is around 6%. The artificial neural network was also used to identify the effect of impurities such as, vanadium, iron, sodium, and sulfur on the CO2 reactivity of anodes. ANN also showed the effect of pitch percentage and coke porosity on
the CO2 reactivity of anodes. The effect of CO2 and air reactivities of coke on the CO2 reactivity
of anode was also studied. The predictions were found to be in good agreement with the results of other studies in the literature.
I. INTRODUCTION
Carbon, required for the reduction of alumina by electrolysis in the Hall-Héroult process, is provided by anodes. The minimum theoretical carbon consumption is 0.334 kg C/kg Al. However, the actual carbon consumption is much higher due to cell current efficiency and oxidation losses. Carbon anodes are an essential part of the cost of primary aluminum production [1]. The minimization of excess consumption of anodes by means of improving their quality is a key industrial goal.
Anodes are produced from a mixture of coke, recyclables (e.g., butts, rejected green and baked anodes), and pitch as the binder. Coke used in anodes is usually petroleum coke which is a by-product of oil refineries. It is of limited interest to the producers as it constitutes only about 2% of their overall production [2]. Mechanical and physical properties of coke are influenced by the quality of crude oil, processes within the refineries, and calcination conditions of the coke. Increased demand for calcined coke by aluminum smelters has created a difficult situation with respect to quality and availability, leading to the use of lower quality coke in aluminum smelters and potential challenges in the production. Understanding the consequences of varying calcined coke quality is crucial in order to possibly compensate and adjust the process parameters in the subsequent use of coke for the cost-effective production of aluminum.
One of the costliest steps during the fabrication of anode is the baking process which involves the supply of a significant amount of energy and requires a long cycle time. With variation in the composition, physical and chemical properties of raw materials, and processing conditions, the quality of anodes can vary. As there is usually no well-defined mathematical relationship between the input variables and the anode properties, it is hard to predict the changes in anode properties using analytical tools.
In the absence of a definite mathematical relationship, the artificial neural network (ANN) methods can be useful in predicting anode properties. Neural networks take a different approach to problem solving than that of conventional analytical approaches. Analytical methods use an algorithmic approach, i.e., they follow a set of instructions in order to solve a problem. Unless the specific steps are known, the solution is not possible. This restricts the problem solving capability of the conventional analytical approaches to cases that one already understands and
knows how to solve. However, the neural networks can deal with problems for which the solution is not exactly known. ANN processes information in a similar way the human brain does. The network is composed of a large number of highly interconnected processing elements, called neurons, working in parallel to solve a specific problem. Neural networks learn by example.
The requirements for the implementation of an artificial neural network are a large set of experimental data, choice of the most suitable ANN model, training and learning algorithms. Industries usually maintain their past records of anode composition, input parameters, and final properties. Such data can be used for the training of an ANN model [3].
Though ANN finds extensive application in multiple fields of research and quality control, few researchers have so far used ANN in fields related to primary aluminum production [1, 4-7]. Only a few articles [1, 8, 9] have reported the application of ANN in predicting carbon anode properties. Thus, the scope of ANN in predicting anode properties needs to be explored. This could help industry increase productivity and decrease cost.
Berezin et al. [1] applied the artificial neural network to maintain anode quality at OKSA aluminum plant in Russia. With changes in the quality and quantity of raw materials, the ANN model could predict and adjust variations in the production process. They utilized past data recorded by the plant. The advantage of using data from the industry is that one can get a vast set of data covering various aspects of production and raw materials, which help better train the ANN model. They used the perceptron model for the prediction of optimal control parameters. Bhattacharyay et al. [8] compared ANN with the linear multivariable and regression analyses to predict density, electrical resistivity and Young’s modulus of baked anodes. It was found that ANN predicts the output for the test data set better than the other two methods of data analysis. Bhattacharyay et al. [9] studied the effect of different green anode fabrication parameters on baked anode density. The results showed that ANN could predict the effect of different parameters on baked anode density correctly for all the cases whereas partial least square regression failed to predict the correct trends in some cases.
As it can be seen from the brief literature review given above, the application of ANN to the prediction of anode quality, defined by its properties, is quite limited. The present work aims to demonstrate the usefulness and the strength of ANN in this field.
A. Artificial Neural Network Modelling
Analytical mathematical tools are often used to predict the values of dependent parameters if there is an existing mathematical relationship between the dependent and the independent parameters. Artificial neural network is an important tool in predicting the values of dependent parameters where no mathematical model is available [10] or even though some mathematical relationship is available, it is hard to find parameters required by the model [3, 11].
There are different standard neural network models. It seems that many researchers prefer multi-layered feed-forward network [5, 10, 12, 13-16]. Other neural network models have also been explored by many researchers [1, 6, 7, 13, 14, 17, 18]. In multilayered feed-forward models, usually the sigmoid transfer function is used [5, 10, 14].
For the training of the model, the back-propagation training algorithm is the most popular one [3, 5, 10, 12, 11-19]. Among various training algorithms, the Levenberg–Marquardt algorithm is preferred by many researchers [3, 12, 16, 20]; however, other training algorithms are used as well [11, 15].
Whatever may be the approach, most researchers found that the predicted values by ANN are consistent with the experimental values [1, 3, 6, 10-13, 15]. Milewski et al. [3] reported that ANN model can also adapt to changes in input conditions.
Vega [19] found that the back-propagation algorithm is a better pattern identifier. The researchers also analyzed various sources of problems that one may face while handling an ANN model. They found that most of the problems were associated with the poor selection of the learning rule and the ANN architecture, the sizes of the training and validation data sets, overtraining, noise on the pattern identification ability, etc.
Unlike regression methods, there is no formal rule available for developing ANN models, and it requires a certain level of expertise. Thus, the development of a suitable ANN model is often
time consuming [8]. However, the ANN models can make more accurate predictions and give the right trends where the other methods fail.
II. METHODOLOGY
A. Data for the analysis
In this work, data from a published thesis [2] have been used for model training and data analysis in the ANN model developed. Chmelar [2] used four different types of coke and one type of pitch, and mixed them in different proportions. Out of the four types of coke, three were from a single source (SSA, SSB, and SSC) and the fourth was a blend of different types of coke. The single source cokes had homogeneous physical and chemical properties over the whole size range whereas the blend was heterogeneous. The amount of -63µm coke particles (particles less than 63µm in size) present in the coke size distribution used for the anode recipe was varied; and to study its effect, a number of anode properties were measured. Different physical and chemical properties of the coke and the pitch are also given in the thesis. The properties of the four types of coke and the pitch used are shown in Table 1. Different compositions of the anode samples are given in Table 2. A number of anode properties corresponding to different compositions (percentages of pitch, coke, and -63µm coke particles) are also reported in this thesis.
The independent input variables are: percentage of pitch, -63µm coke particles, moisture, ash, and the quantities of S, V, Si, Fe, Ca, Ni, Na, Zn present in coke or pitch in ppm as well as the density, specific electrical resistivity, air and CO2 reactivities, grain stability, HGI (Hardgrove
Grindability Index), and porosity of coke. Some properties of pitch (e.g. pitch density, toluene solubility, and softening point) were not considered as they did not vary with the amount of pitch. Since only one type of pitch was used, all the above mentioned pitch properties were the same for all the cases. The coke weight percentage was not considered as an independent input parameter because this was calculated as 100 minus the pitch weight percentage in the study. Concerning anode properties, only CO2 reactivity was considered in the present work because
the effect of input parameters on this property was readily available in the thesis [2]. Values of the CO2 reactivity of the baked anodes are shown in Table 3.
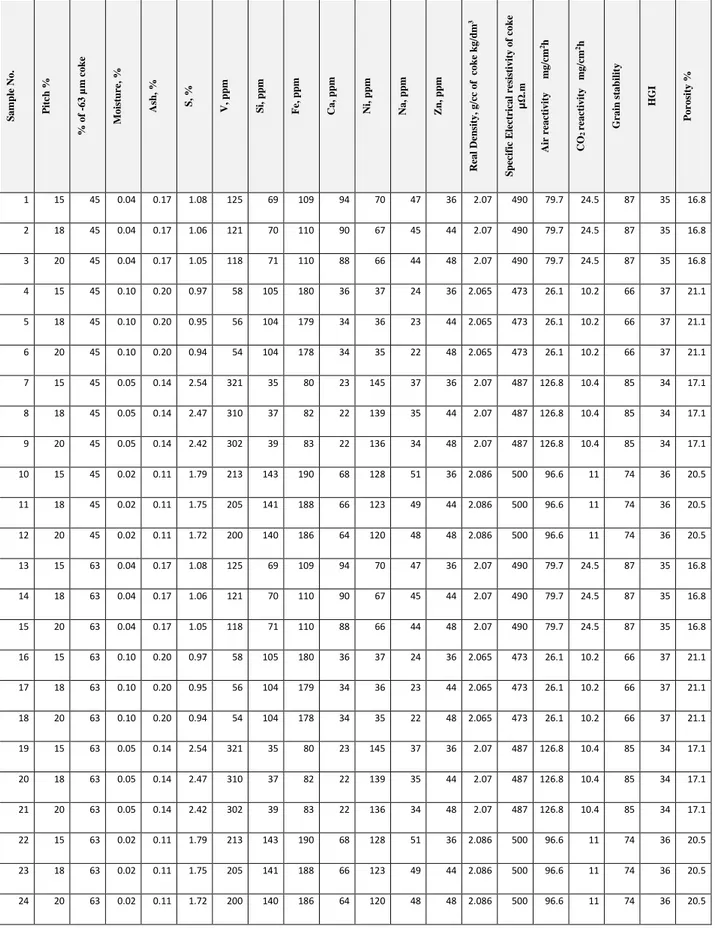
Combining the data of Tables 1 and 2, 19 independent variables and 36 samples were obtained (see Table 4). The impurities can be present in both coke and pitch. Thus, the impurity content in an anode, which contains both coke and pitch, is determined as the weighted average of the impurity present in the two raw materials. If the weight percentage of pitch in the anode is x, then the weight percentage of coke will be 100-x. If the weight percentages or ppm of an impurity in coke and pitch are C and P, respectively, then the weight percentage or ppm of the impurity in the anode will be (xC+(100-x)P)/100. All such additive parameters were calculated similarly using the values from Tables 1 and 2 and presented in Table 4. The properties of coke (such as real density, reactivity, HGI, porosity, etc.) were taken directly from Table 1. The values of the independent variables, which were used as input parameters, for all the samples are presented in Table 4.
B. Development of neural network model
A neural network is a nonlinear system capable of resolving paradigms that linear computing cannot. Essentially, it is a model that accepts input data, identifies some patterns in the data, manipulates them based on the errors in the prediction, and finally predicts the output.
Usually, it contains one input layer, one or more hidden layers, and one output layer. There may be different connections possible between the layers. The role of the hidden layers is to modify a set of input data to a new set of output data to facilitate the pattern recognition. The parameters are changed during the operation based on different algorithms. This process is known as ‘training’ of a neural network. Initially, some weights are assigned to the input parameters. During training, the error information (between the experimental and predicted output values) is fed back to the system which makes all adjustments to their weight parameters in a systematic fashion. This process is known as ‘learning’. The process is repeated until the desired output is acceptable.
In a neural network design, it is necessary to choose a network topology, an initialization technique, transfer functions, a learning rule, a training algorithm and criteria for stopping the training phase. It is quite difficult to determine the size and the parameters of the network as there is no existing rule or formula to do it. The best design can only be obtained by trial and error.
There are different tools available for the modeling of the neural network. In this work, the neural network tool of MATLAB 7.2 was used.
In the current work, the focus was on two aspects of the artificial neural network modelling, namely, the development of a suitable artificial neural network model and the application of the model to study the effect of independent input parameters on a particular property of the anode. The model was developed with the objective of predicting the carbon dioxide reactivity of the anodes. First, the effect of the variation of different parameters of the artificial neural network model was studied; and then the effects of a number of parameters on the carbon dioxide reactivity were analyzed. These parameters were considered because, in literature, there are references available on the impact of these parameters on the carbon dioxide reactivity. This also made the comparison of the output of the neural network model developed with those of the published information possible.
Three artificial neural network models, available in MATLAB 7.2, were used, and their results were compared with the correlation coefficients between experimental and predicted values. Two ANN models were used: the cascade forward propagation (newcf); feed-forward back-propagation (newff) and fitting network (newfit). The newfit is a special case of newff which tries to approximate a linear polynomial type of fit [21]. These two ANN models are variations of the feed-forward back-propagation model. Figure 1 shows the two neural network models. The neural network models were developed in light of the work of Berezin [1]. Though different models were tried, all of them consisted of one input layer, two hidden layers, and one output layer. All of the 19 independent input parameters were fed into the input layer. The input layer was connected to the first hidden layer. The hidden layer was associated with one sigmoidal transfer function (logsig). The first hidden layer was connected to another hidden layer which in turn was connected to the output layer. The second hidden layer had a linear transfer function (purelin). The role of the transfer function was to modify the input to a layer so that patterns in the input data can be easily identified.
The logsig transfer function is available in MATLAB. The function can be expressed as: logsig(n) = 1 / (1 + exp(-n)) (1)
The purelin transfer function is also available in MATLAB. It is defined as: purelin(n) = n (2)
As the magnitudes of various parameters were of different orders, all the data for each parameter were normalized with reference to the corresponding mean value. This improves the accuracy of the results substantially by avoiding the problem of dealing with numbers of significantly different magnitudes in calculations.
Initially, each input parameter is associated to some factors, known as weights and biases. The objective of training a neural network is to find the optimum values of the weights and biases so that the input parameters can be manipulated by those weights and biases to get the desired output value.
There are many algorithms available in MATLAB for training. In this study, three of them (namely, Levenberg-Marquardt (trainlm), BFGS quasi Newton (trainbfg), and gradient descent with momentum back-propagation (traingdm)) were used. Trainlm is a network training function that updates weight and bias values according to Levenberg-Marquardt optimization. It is often considered as the fastest back-propagation algorithm. Trainbfg is an update of the quasi Newton secant method as proposed by Broyden, Fletcher, Goldfarb, and Shanno (BFGS). The algorithm is efficient for smaller networks. Traingdm can train any network according to gradient descent with momentum algorithm and calculates the derivatives of performance with respect to the weight and bias variables.
The learning algorithm dictates how the weights change during training. Gradient descent weight and bias learning algorithm (learngd) was used as the learning algorithm for all the ANN models. It calculates the weight change for a given neuron based on the learning rate and gradient descent. The number of epochs was always taken as 1000. The number of epochs represents the maximum number of repetitions of the training process.
There are three different methods available in MATLAB to evaluate errors during the training process. They are mean-squared error with regularization performance function (msereg), mean average error (mae), and mean-squared error (mse). All three error functions were tried during the study.
The weights and biases were initialized using a pseudo-random function (available in neural network toolbox) before each of the training and learning steps. This initialization has a significant impact on the network model, especially for a small number of data. The value of the pseudo-random function can be controlled by selecting the seed value for the random number generator. In this study, the value of the seed was varied from 0 to 10.
Out of 36 data sets, four data sets were used only to understand the effectiveness of prediction of the model; therefore, they were not used in the training or the validation of the model. The remaining 32 data sets were divided into three groups: validation data sets (6), test data sets (3), and training data sets (23). The 32 data sets which were randomly selected were also used to check the accuracy of the model prediction.
During the training process, the training, the validation, and the testing data sets were used for the following purposes. The training data sets are used to adjust the weights on the neural network. Over-training may be detrimental for the prediction capability of the neural network. The validation data sets are used to minimize over-fitting. This is to verify that any increase in accuracy over the training data sets actually increases the accuracy over a data set that has not been shown to the network before or at least the network has not been trained on. If the accuracy over the training data sets increase, but the accuracy over the validation data sets remain the same or decreases, this indicates over-fitting of the neural network; therefore, training should be stopped. The testing data sets are used only to test the final solution in order to assess the actual predictive power of the network and to take necessary action to improve the predictive ability. Partitioning of these training, validation and testing data sets are usually done randomly according to some predetermined proportion or to help the network identify different patterns in the data sets. In this article, this partitioning was also done on a random basis [22].
After training, all the 32 experimental independent variables were used again as input to compare the output of the ANN with the experimental values. In the absence of a large number of data sets for training, this step was followed just to check the efficiency of the prediction. As a larger number of experimental results were not available, only four data sets (not used during training) were used for validation separately.
The validation was done by calculating the regression coefficient for the output of the model against the experimental results. This was done in two steps. First, the regression coefficient was calculated for the 32 data sets used for training. Then, the regression coefficient for the four data sets (which were not used in training) was calculated. The models for which the regression coefficients for both cases were close to one were considered suitable.
To study the effect of one single independent parameter on the output (the dependent parameter), the neural network model was applied to a set of input data where only that independent parameter has been changed keeping all other ones constant.
III. RESULTS AND DISCUSSION
For the three network models, namely, newff, newcf, and newfit, the different training algorithms (trainlm, trainbfg and traingdm) were applied, and the errors were estimated using three different error functions (msereg, mae, and mse). The seed for the random number was varied from 0 to 10.
For the 32 data sets (used for training) and the four data sets (used for validation, but not for training), the coefficient of determination for linear regression was calculated corresponding to each model. It was observed that the variation of the seed value for the random number influenced the output to a great extent. The variation did not follow a specific trend. As an example, Figure 2 shows how the coefficient of determination (R2) varied with the variation in the seed value of the random number for the cases of newff, newcf, and newfit with trainbfg as the training algorithm and msereg as the error function.
The variation may be attributed to the randomness of the initialization conditions. Increase in the value of the seed of a random number does not ensure that the random number produced will follow the same trend. Table 5 shows various combinations for which the R2 values for both cases (32 and 4 data sets) are greater than 0.9. The table also shows predicted results for the four test data sets.
The table shows that, for a seed value 0, newcf network with trainlm training algorithm gave reasonably good predictions. It can also be noted that in this case, the output is independent of
the error functions. For the four data sets, which were used only for validation, the average error was about 6%.
The error of 6% can be explained in light of the explanation of Vega et al. [19]. According to this reported study, a poor selection of the learning rule and the ANN architecture, the sizes of the training and validation data sets, noise on the pattern identification ability, etc. can influence errors in predictions. For the current case, it may be due to the small number of data available for training.
The model was applied to study the impact of different parameters on the CO2 reactivity of
anodes. Out of the 19 parameters, 8 parameters were chosen because the effects of these parameters on the CO2 reactivity of anodes have been studied by a number of researchers. This
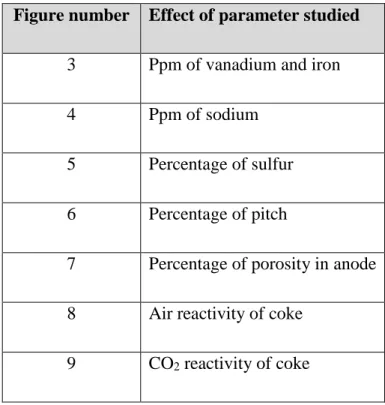
allows the comparison of the trends predicted by the ANN model with the published results. Table 6 gives the list of parameters studied and the corresponding figures which show the effect of these parameters on the CO2 reactivity of anodes. The data set of sample 2 (randomly
selected) was used in all cases. To study the effect of a parameter, only that parameter was varied and the CO2 reactivity of the anode was predicted using the ANN model.
In this study, the CO2 reactivity was presented in terms of the weight loss of the sample due to
the reaction. A higher reactivity value shows more reaction with CO2; thus, the lower the value
is, the better the quality of the anode is.
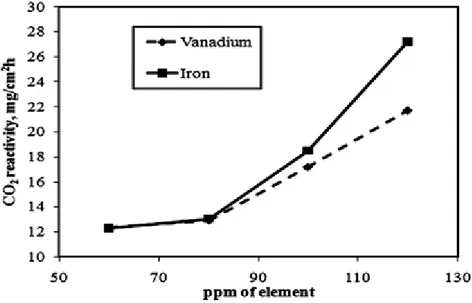
Figure 3 shows that both vanadium and iron could catalyze the CO2 reactivity of anode. This
observation is supported by different researchers [23-26]. They have also observed that these metals increase the rate of reaction with CO2. Vanadium and iron are transition metals and have
vacant d orbitals. This is the reason why their presence can catalyze the CO2 reactivity of anodes.
From the neural network study, it can also be observed that when the concentrations are small, both elements have a similar effect on the CO2 reactivity; however, with an increase in
concentration, iron shows more influence on the CO2 reactivity.
Figure 4 shows the impact of the sodium concentration on the CO2 reactivity of anodes. Butts are
the major source of sodium in anodes [27]. As can be seen in Figure 4, the presence of sodium in the anodes increases the CO2 reactivity. Similarly, Liu et al.[28], Perruchoud et al.[27] observed
that the contamination of anodes by sodium increases their CO2 reactivity. Thus, the prediction
of the ANN model is in agreement with the published works.
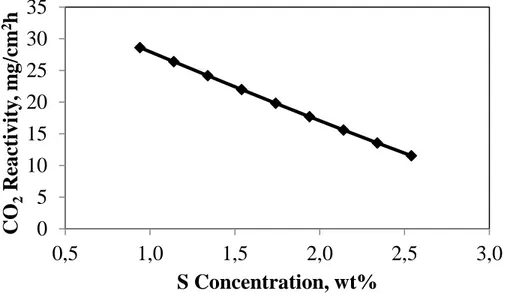
Figure 5 gives the anode CO2 reactivity as a function of sulfur concentration in anodes. The
figure shows that the presence of sulfur reduces the CO2 reactivity of anodes. Other researchers
[28, 29] have also observed that increasing the anode sulfur content helps reduce the CO2
reactivity. Sulfur can form covalent bonds with transition metals and reduce the catalytic activity of the metal impurities. Thus, the ANN model predicted the trend observed by other researchers. Pietrzyk et al. [30] observed that the carbonized coal tar pitch is more reactive than the calcined petroleum coke. Chevarin et al. [31] reported similarly that when pitch is baked in the presence of coke particles, the carbonized pitch becomes the more reactive material within the anode. Thus, an increase in pitch content in anodes may cause an increase in their reactivity. Figure 6 gives the effect of pitch content on the CO2 reactivity of anodes as predicted by the ANN model.
This figure shows that the CO2 reactivity of anodes increases with increasing pitch content,
which is in agreement with the results from the literature.
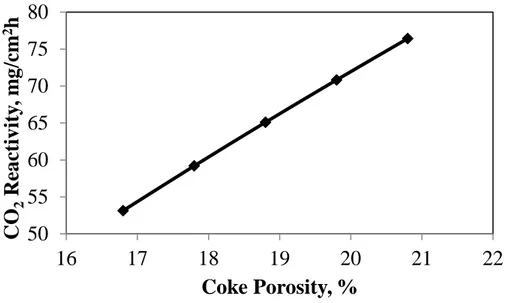
Fang et al. [32] found that the coke porosity has a significant effect on anode reactivity. The higher the coke porosity is, the higher the reactivity of the anode is. Figure 7 presents the effect of the coke porosity on the anode CO2 reactivity. This figure shows that if the porosity of coke
increases, the CO2 reactivity increases significantly. For a fixed amount of pitch, if the porosity
of coke increases, then the porosity of anode will increase. A higher anode porosity will help CO2 diffuse into the anode and react with the anode matrix more easily, and this in turn will
result in higher CO2 reactivity. Thus, ANN was able to predict a trend similar to that reported by
other researchers.
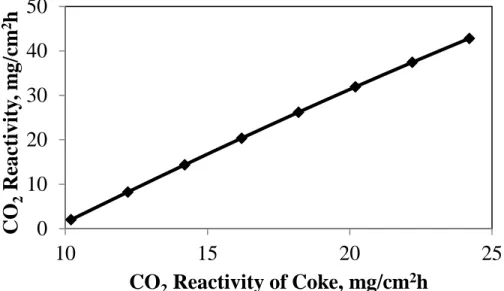
Coke reactivity decreases with increasing calcination level due to increase in the size of the crystallites. This results in a decrease in the more reactive carbon atoms on the edge compared to that in crystal base plane [33]. Coste et al. [34] studied the effect of coke reactivity on anode reactivity. They found that an increase in coke reactivity causes an increase in anode reactivity. Figures 8 and 9 present the impact of the air and CO2 reactivities of coke on the CO2 reactivity of
increasing air and CO2 reactivities of coke. Again, the results are in agreement with those
observed by other researchers.
Similar studies where it is desired to change one parameter at a time are hard to carry out experimentally in a laboratory. For example, if the coke raw material is changed, this affects many parameters (the concentrations of vanadium, iron, sulfur, sodium, etc.) at once. Hence, by changing the quantity or the type of raw material, it is hard to study the effect of a single parameter. In addition, if salts of the elements are used as additives in an effort to change the concentration of a single element, this may not represent the actual structure of the element present in the raw material. Thus, the result may not represent the actual case. However, the artificial neural network allows the variation of only one parameter while keeping all other parameters constant. This has given the artificial neural networks an edge over the conventional analytical methods.
In this work, only 36 experimental results were available to develop and validate the model. The ANN model predictions could have been improved if there were more data. The model could still predict the trends which are in accordance with the published literature. To build a good ANN model, it is essential to have different patterns of datasets. It is quite possible that the 36 datasets used in this study contained a number of patterns which helped develop a model that could predict the effects of different parameters on the CO2 reactivity of anodes.
An artificial neural network model can be considered as a complementary technique to the laboratory analysis to infer the effect of individual parameters on a system to understand the system better. Artificial neural network can be used to study the effects of various parameters on different properties of anodes, and consequently, the impact on anode quality. This technique can also be used to adjust the parameters of the anode manufacturing process to produce anodes with desired properties.
IV. CONCLUSIONS
Proper choice of ANN model and learning/training algorithms can help predict anode properties well. In this work, only the chemical and physical properties of the raw materials available in literature were used to predict an anode property, CO2 reactivity. If experimental or plant data on
operating conditions are incorporated into the ANN models as input parameters, predictive tools could be developed which can determinethe final anode properties in advance. This would help the industry maintain the anode quality in spite of variations in compositions of raw materials and processing conditions.
ACKNOWLEDGEMENTS
The technical and financial support of Aluminerie Alouette Inc. as well as the financial support of the National Science and Engineering Research Council of Canada (NSERC), Développement économique Sept-Îles, the University of Québec at Chicoutimi (UQAC), and the Foundation of the University of Québec at Chicoutimi (FUQAC) are greatly appreciated.
REFERENCES
1. Berezin AI, Polaykov PV, Rodnov OO, Klykov VA, Krylov VL (2002) Improvement of green anodes quality on the basis of the neural network model of the carbon plant workshop. Light Metals 605-608.
2. Chmelar J (2006) Size reduction and specification of granular petrol coke with respect to chemical and physical properties. Dissertation, Norwegian University of Science and Technology.
3. Milewski J, Świrski, K (2009) Modelling the SOFC behaviours by artificial neural network. International Journal of Hydrogen Energy 34(13): 5546-5553.
4. Biedler P, Banta L, Dai C, Love R, Tommey C, Berkow J (2002) Development of a state observer for an aluminum reduction cell. Light Metals 1091-1098.
5. Meghlaoui A, Bui RT, Thibault J, Tikasz L, Santerre R (1998) Predictive control of aluminum electrolytic cells using neural networks. Metallurgical and Materials Transactions B. 29(5): 1007-1019 .
6. Li J, Zhou H, Guo T (2010) Research on fault diagnosis method based on modified elman neural network. 2nd International Conference on Information Science and Engineering (ICISE) 1456 – 1459.
7. Boadu KD, Omani FK (2010) Adaptive control of feed in the Hall-Héroult cell using a neural network. JOM62(2): 32-36.
8. Bhattacharyay D, Kocaefe D, Kocaefe Y, Morrais B, Gagnon M (2013) Application of the artificial neural network (ANN) in predicting anode properties. Light Metals: DOI: 10.1002/9781118663189.ch201
9. Bhattacharyay D, Kocaefe D, Kocaefe Y, Morrais B (2015) Comparison of linear multivariable, partial least square regression, and artificial neural network analyses to study the effect of different parameters on anode properties. Light Metals: DOI: 10.1002/9781119093435.ch189.
10. Parthiban T, Ravi R, Kalaiselvi N (2007) Exploration of artificial neural network [ANN] to predict the electrochemical characteristics of lithium-ion cells. Electrochimica Acta. 53(4): 1877-1882.
11. Pang G, Xu W, Zhai X, Zhou J (2004) Forecast and control of anode shape in
electrochemical machining using neural network.Advances in Neural Networks, Lecture Notes in Computer Science 3174: 262-268.
12. Shang GQ (2008) Application of BP neural network for predicting anode accuracy in ECM. International Symposium on formation Science and Engineering. 2: 428 – 432.
13. Wang L, Apelian D, Makhlouf M, Huang W (2008) Predicting compositions and properties of aluminum die casting alloys using artificial neural network. Metallurgical Science and Technology 26(1): 16-21.
14. Bhagavatula YS, Bhagavatula MT, Dhathathreyan KS (2011) Application of artificial neural network in performance prediction of PEM fuel cell. Int. J. Energy Res. 36(13): 1215-1225. 15. Ray M, Ganguly S, Das M, Datta S, Bandyopadhyay N R, Hossain S M (2008) Artificial neural network (ANN)-based model for in situ prediction of porosity of nanostructured porous silicon. Materials and Manufacturing Processes 24(1) : 83-87.
16. Panda DK, Bhoi RK (2005) Artificial neural network prediction of material removal rate in electro discharge machining. Materials and Manufacturing Processes 20(4): 645 – 672.
17. Fruhwirth RK, Filzwieser A (2007) Computational intelligence – neural computation in a copper refinery. EMC 2007 1-14.
18. Piuleac CG, Rodrigo MA, Cañizares P, Curteanu S, Sáez C (2010) Ten steps modeling of electrolysis processes by using neural networks. Environmental Modelling & Software 25(1): 74-81
19.Vega JJ, Reynoso R (2008) Learning limits of an artificial neural network, F´ISICA S 54 (1): 22–29.
20. Dursun E, Kilic O (2011) The Levenberg-Marquardt neural network model of the PEMFC's MEA. 10th International Conference on Environment and Electrical Engineering (EEEIC) 1 – 4. 21. Liu W (2012) Introduction to modeling biological cellular control systems. volume 6,
Springer, Milan.
22.Shmueli G, Patel NR, Bruce PC (2007) Data mining for business intelligence: concepts, techniques, and applications in Microsoft office excel withXLminer. 2nd. ed., Wiley, New Jersy. 23. Tosta MRJ, Inzunza EM, Delgado LA (2009) Boron salt inhibitors of air reactivity of prebaked carbon anodes- literature review and laboratory studies. Light Metals 1173-1176. 24. Bensah YD, Foosnaes T (2010) The nature and effect of sulphur compounds on CO2 and air reactivity of petrol coke.ARPN Journal of Engineering and Applied Sciences 5(6): 35-43. 25. Eidet T, Sorlie M, Thonstad J (1997) Effects of sulphur, nickel and vanadium on the air and CO2 reactivity of cokes. Light Metals 436-437.
26.Lee JM, Baker JJ, Rolle JG, Llerena R (1998) Characterization of green and calcined coke properties used for aluminum anode-grade carbon. ACS Div Fuel Chem 43 (2): 271-277.
27. Perruchoud RC, Meier MW, Fischer WK (1996) Bath Impregnation of carbon anodes. Light Metals: 673-679.
28. Liu FQ, Liu YX, Mannweiler U, Perruchoud R (2006) Effect of coke properties and its blending recipe on performances of carbon anode for aluminium electrolysis. Journal of Central South University of Technology 13(6): 647-652.
29. Tran K (2011) Influence of raw material properties and heat treatment temperature on the reactivity of carbon anodes. PhD Thesis. The University of Queensland.
30. Pietrzyk SS, Thonstad J (2012) Influence of the sulphur content in the anode carbon in aluminium electrolysis - a laboratory study, Light Metals: DOI: 10.1002/9781118359259.ch113. 31. Chevarin F, Lemieux L, Ziegler D, Fafard M, Alamdari H (2015) Air and CO2 reactivity of
carbon anode and its constituents : an attempt to understand dusting phenomenon. Light Metals : DOI: 10.1002/9781119093435.ch192.
32. Fang N, Xue J, Li X, Lang G, Gao S, Xia B, Jiang J, Bao C (2015) Effects of coke types and calcining levels on the properties of bench-scale anodes. Light Metals:
DOI: 10.1002/9781119093435.ch193.
33. Bonnetain L, Hoynant G (1965) Les Carbones. Tome 2, Masson et Cie, chap. XVII: 298-306. 34. Coste B, Schneider JP (2013) Influence of coke real density on anode reactivity
V or Fe Concentration, ppm
CO2 Reactivity
Figure 3. Effect of vanadium and iron concentrations on the CO
2reactivity of anode
Figure 4. Effect of sodium concentration on the CO
2reactivity of anode
0
5
10
15
20
25
20
25
30
35
40
45
50
CO
2R
eac
tivit
y,
m
g/c
m
2h
Na Concentration, ppm
Figure 5. Effect of sulfur concentration on the CO
2reactivity of anode
Figure 6. Effect of pitch content on the CO
2reactivity of anode
0
5
10
15
20
25
30
35
0,5
1,0
1,5
2,0
2,5
3,0
CO
2R
eac
tivit
y,
m
g/c
m
2h
S Concentration, wt%
20
22
24
26
28
30
32
15
16
17
18
19
20
CO
2R
eac
tivit
y,
m
g/c
m
2h
Pitch, wt%
Figure 7. Effect of coke porosity on the CO
2reactivity of anode
Figure 8. Effect of the air reactivity of coke on the CO
2reactivity of
anode
50
55
60
65
70
75
80
16
17
18
19
20
21
22
CO
2R
eac
tivit
y,
m
g/c
m
2h
Coke Porosity, %
30
34
38
42
46
0
50
100
150
CO
2R
eac
tivit
y,
m
g/c
m
2h
Figure 9. Effect of the CO
2reactivity of coke on the CO
2reactivity of
anode
0
10
20
30
40
50
10
15
20
25
CO
2R
eac
tivit
y,
m
g/c
m
2h
CO
2Reactivity of Coke, mg/cm
2h
Table1. Properties of the four types of coke and the pitch [2] Property Coke Pitch SSA SSB SSC Blend Moisture, wt% 0.05 0.12 0.06 0.02 - Ash, wt% 0.16 0.2 0.13 0.09 0.2 S, % 1.18 1.04 2.89 2.01 0.54 V, ppm 147 68 378 250 - Si, ppm 63 105 23 150 102 Fe, ppm 105 189 71 200 132 Ca, ppm 110 42 27 80 - Ni, ppm 82 44 170 150 - Na, ppm 55 28 43 60 - Zn, ppm 0 0 0 0 242 Density kg/dm3 2.07 2.065 2.07 2.086 1.32 Specific Electrical Resistivity, µOhm.m 490 473 487 500 - Air reactivity mg/cm2h 79.7 26.1 126.8 96.6 - CO2reactiv ity mg/cm2h 24.5 10.2 10.4 11 - Grain stability 87 66 85 74 - HGI 35 37 34 36 - Porosity % 16.8 21.1 17.1 20.5 -
able2. Different anode formulations [2] Sample no. Pitch wt% Coke wt% -63 µm particleswt % Coke type 1 15 85 45 SSA 2 18 82 45 SSA 3 20 80 45 SSA 4 15 85 45 SSB 5 18 82 45 SSB 6 20 80 45 SSB 7 15 85 45 SSC 8 18 82 45 SSC 9 20 80 45 SSC 10 15 85 45 Blend 11 18 82 45 Blend 12 20 80 45 Blend 13 15 85 63 SSA 14 18 82 63 SSA 15 20 80 63 SSA 16 15 85 63 SSB 17 18 82 63 SSB 18 20 80 63 SSB 19 15 85 63 SSC 20 18 82 63 SSC 21 20 80 63 SSC 22 15 85 63 Blend 23 18 82 63 Blend
24 20 80 63 Blend 25 15 85 94 SSA 26 18 82 94 SSA 27 20 80 94 SSA 28 15 85 94 SSB 29 18 82 94 SSB 30 20 80 94 SSB 31 15 85 94 SSC 32 18 82 94 SSC 33 20 80 94 SSC 34 15 85 94 Blend 35 18 82 94 Blend 36 20 80 94 Blend
Table 3. CO2 reactivities of baked anodes [2]
Sample No. CO2 reactivity, mg/cm2h 1 20.1 2 23.4 3 32.9 4 30.8 5 26.8 6 27.2 7 13.7 8 15 9 13.8 10 17.1 11 18.8
12 16.9 13 21.4 14 22.3 15 31.3 16 24.9 17 24.3 18 24.9 19 15.8 20 13.2 21 12.1 22 16.5 23 20.8 24 20.6 25 15.5 26 20.2 27 30 28 27.4 29 17.9 30 25 31 15.5 32 17.3 33 16.2 34 20.3 35 26.4 36 37.1
Table 4. List of independent variables Sa m pl e N o . P it c h % % of -63 µ m c ok e Mo is tu re, % A sh, % S, % V , ppm Si , ppm F e, ppm C a , ppm N i, ppm N a , ppm Z n, ppm R eal D en si ty, g/ cc of c ok e k g/ d m 3 S p eci fi c E lect ri ca l res is ti v it y o f co k e μΩ. m A ir rea ct iv it y m g /cm 2h CO 2 re ac ti vi ty m g/ cm 2h Gr a in s ta b ilit y HGI P or os it y % 1 15 45 0.04 0.17 1.08 125 69 109 94 70 47 36 2.07 490 79.7 24.5 87 35 16.8 2 18 45 0.04 0.17 1.06 121 70 110 90 67 45 44 2.07 490 79.7 24.5 87 35 16.8 3 20 45 0.04 0.17 1.05 118 71 110 88 66 44 48 2.07 490 79.7 24.5 87 35 16.8 4 15 45 0.10 0.20 0.97 58 105 180 36 37 24 36 2.065 473 26.1 10.2 66 37 21.1 5 18 45 0.10 0.20 0.95 56 104 179 34 36 23 44 2.065 473 26.1 10.2 66 37 21.1 6 20 45 0.10 0.20 0.94 54 104 178 34 35 22 48 2.065 473 26.1 10.2 66 37 21.1 7 15 45 0.05 0.14 2.54 321 35 80 23 145 37 36 2.07 487 126.8 10.4 85 34 17.1 8 18 45 0.05 0.14 2.47 310 37 82 22 139 35 44 2.07 487 126.8 10.4 85 34 17.1 9 20 45 0.05 0.14 2.42 302 39 83 22 136 34 48 2.07 487 126.8 10.4 85 34 17.1 10 15 45 0.02 0.11 1.79 213 143 190 68 128 51 36 2.086 500 96.6 11 74 36 20.5 11 18 45 0.02 0.11 1.75 205 141 188 66 123 49 44 2.086 500 96.6 11 74 36 20.5 12 20 45 0.02 0.11 1.72 200 140 186 64 120 48 48 2.086 500 96.6 11 74 36 20.5 13 15 63 0.04 0.17 1.08 125 69 109 94 70 47 36 2.07 490 79.7 24.5 87 35 16.8 14 18 63 0.04 0.17 1.06 121 70 110 90 67 45 44 2.07 490 79.7 24.5 87 35 16.8 15 20 63 0.04 0.17 1.05 118 71 110 88 66 44 48 2.07 490 79.7 24.5 87 35 16.8 16 15 63 0.10 0.20 0.97 58 105 180 36 37 24 36 2.065 473 26.1 10.2 66 37 21.1 17 18 63 0.10 0.20 0.95 56 104 179 34 36 23 44 2.065 473 26.1 10.2 66 37 21.1 18 20 63 0.10 0.20 0.94 54 104 178 34 35 22 48 2.065 473 26.1 10.2 66 37 21.1 19 15 63 0.05 0.14 2.54 321 35 80 23 145 37 36 2.07 487 126.8 10.4 85 34 17.1 20 18 63 0.05 0.14 2.47 310 37 82 22 139 35 44 2.07 487 126.8 10.4 85 34 17.1 21 20 63 0.05 0.14 2.42 302 39 83 22 136 34 48 2.07 487 126.8 10.4 85 34 17.1 22 15 63 0.02 0.11 1.79 213 143 190 68 128 51 36 2.086 500 96.6 11 74 36 20.5 23 18 63 0.02 0.11 1.75 205 141 188 66 123 49 44 2.086 500 96.6 11 74 36 20.5 24 20 63 0.02 0.11 1.72 200 140 186 64 120 48 48 2.086 500 96.6 11 74 36 20.5
25 15 94 0.04 0.17 1.08 125 69 109 94 70 47 36 2.07 490 79.7 24.5 87 35 16.8 26 18 94 0.04 0.17 1.06 121 70 110 90 67 45 44 2.07 490 79.7 24.5 87 35 16.8 27 20 94 0.04 0.17 1.05 118 71 110 88 66 44 48 2.07 490 79.7 24.5 87 35 16.8 28 15 94 0.10 0.20 0.97 58 105 180 36 37 24 36 2.065 473 26.1 10.2 66 37 21.1 29 18 94 0.10 0.20 0.95 56 104 179 34 36 23 44 2.065 473 26.1 10.2 66 37 21.1 30 20 94 0.10 0.20 0.94 54 104 178 34 35 22 48 2.065 473 26.1 10.2 66 37 21.1 31 15 94 0.05 0.14 2.54 321 35 80 23 145 37 36 2.07 487 126.8 10.4 85 34 17.1 32 18 94 0.05 0.14 2.47 310 37 82 22 139 35 44 2.07 487 126.8 10.4 85 34 17.1 33 20 94 0.05 0.14 2.42 302 39 83 22 136 34 48 2.07 487 126.8 10.4 85 34 17.1 34 15 94 0.02 0.11 1.79 213 143 190 68 128 51 36 2.086 500 96.6 11 74 36 20.5 35 18 94 0.02 0.11 1.75 205 141 188 66 123 49 44 2.086 500 96.6 11 74 36 20.5 36 20 94 0.02 0.11 1.72 200 140 186 64 120 48 48 2.086 500 96.6 11 74 36 20.5
Table 5. Results of different models Network model Training algorithm Error function Seed value R2 for 32 data R2 for 4 data CO2 reactivity, mg/cm2h
newff trainbfg msereg 1 0.938 0.908 12.2 27.5 22.3 25.2
newcf trainbfg mse 0 0.921 0.919 17.6 25.9 22.1 24.5
newcf trainlm msereg 0 0.933 0.926 17.0 26.5 23.3 24.7
newcf trainlm mae 0 0.933 0.926 17.0 26.5 23.3 24.7
newcf trainlm mse 0 0.933 0.926 17.0 26.5 23.3 24.7
newfit trainbfg msereg 1 0.938 0.908 12.2 27.5 22.3 25.2
Experimental CO2 reactivity values 17.3 30.8 24.3 25
Table 6. List of figures showing the effect of different parameters on CO2 reactivity of anodes.
Figure number Effect of parameter studied
3 Ppm of vanadium and iron
4 Ppm of sodium
5 Percentage of sulfur 6 Percentage of pitch
7 Percentage of porosity in anode 8 Air reactivity of coke
![Table 3. CO 2 reactivities of baked anodes [2]](https://thumb-eu.123doks.com/thumbv2/123doknet/7564491.230089/25.918.102.552.103.584/table-reactivities-baked-anodes.webp)